

Alert correlation
Collapses a burst of concurrent problems into alert storms with a root-cause device and blast radius, then has AI score the remaining groups and recommend actions. Professional and above.
When a core switch goes down, every device behind it becomes unreachable at once: one fault, hundreds of problems. Alert correlation collapses such a storm into one incident, names the most likely root-cause device and its blast radius, then groups the remaining problems by device and has AI rate their severity and recommend actions. It belongs to the alert_triage feature and needs a Professional or Enterprise license, including a trial.
How storms are found
Hosts with problems are the nodes. Two hosts join the same storm when their first problems fall inside the correlation window and one of these holds:
| Basis | Condition | How the root device is picked | Confidence |
|---|---|---|---|
| Trigger dependency | A trigger on A depends on a trigger on B (B is upstream) | The upstream-most host with the most downstream hosts | 90% |
| LLDP/CDP neighbour | An LLDP/CDP neighbour item on one host names the other | The best-connected host; the earliest to fail on ties | 70% |
| Same group, same time | No topology link, but at least 5 hosts in one host group fail within the window | The first host to fail; the higher severity on ties | 40% |
The correlation window is 600 seconds by default, set by RST_CORRELATION_WINDOW_S. The host count for same-group storms is RST_CORRELATION_STORM_MIN_HOSTS (default 5). RST_CORRELATION=0 turns storm detection off.
For a reliable root cause, give the reachability triggers of access and distribution devices a dependency on their upstream device in Zabbix. Rule BL-MON-007 on Monitoring health checks for this.
Run a correlation
Prerequisites
- A Professional or Enterprise license, including a trial.
Steps
- Under Which problems to correlate, enter a Host group, or choose All host groups I can access (collapses storms that span groups).
- Set Time window (minutes), 60 by default. Problems that started earlier and are still open are included.
- (Optional) Set Maximum problems (1 to 100, default 100) and Maximum groups sent to the model (1 to 30, default 30).
- (Optional) Add
event.getparameters as JSON under event.get overrides (optional). - Select Correlate.
When you select Send to triage in Ask AI or Live problems, the problems come along directly and the page says Received N problems. Select Pull from Zabbix instead to go back to pulling by host group.
While it runs, the elapsed seconds are shown; select Stop to interrupt. When it finishes, the result is archived to Investigations.
The result
The top of the result shows the number of Problem events and the groups they fall into, how many groups are Scored and High and above, and Collapsed: how many storms.
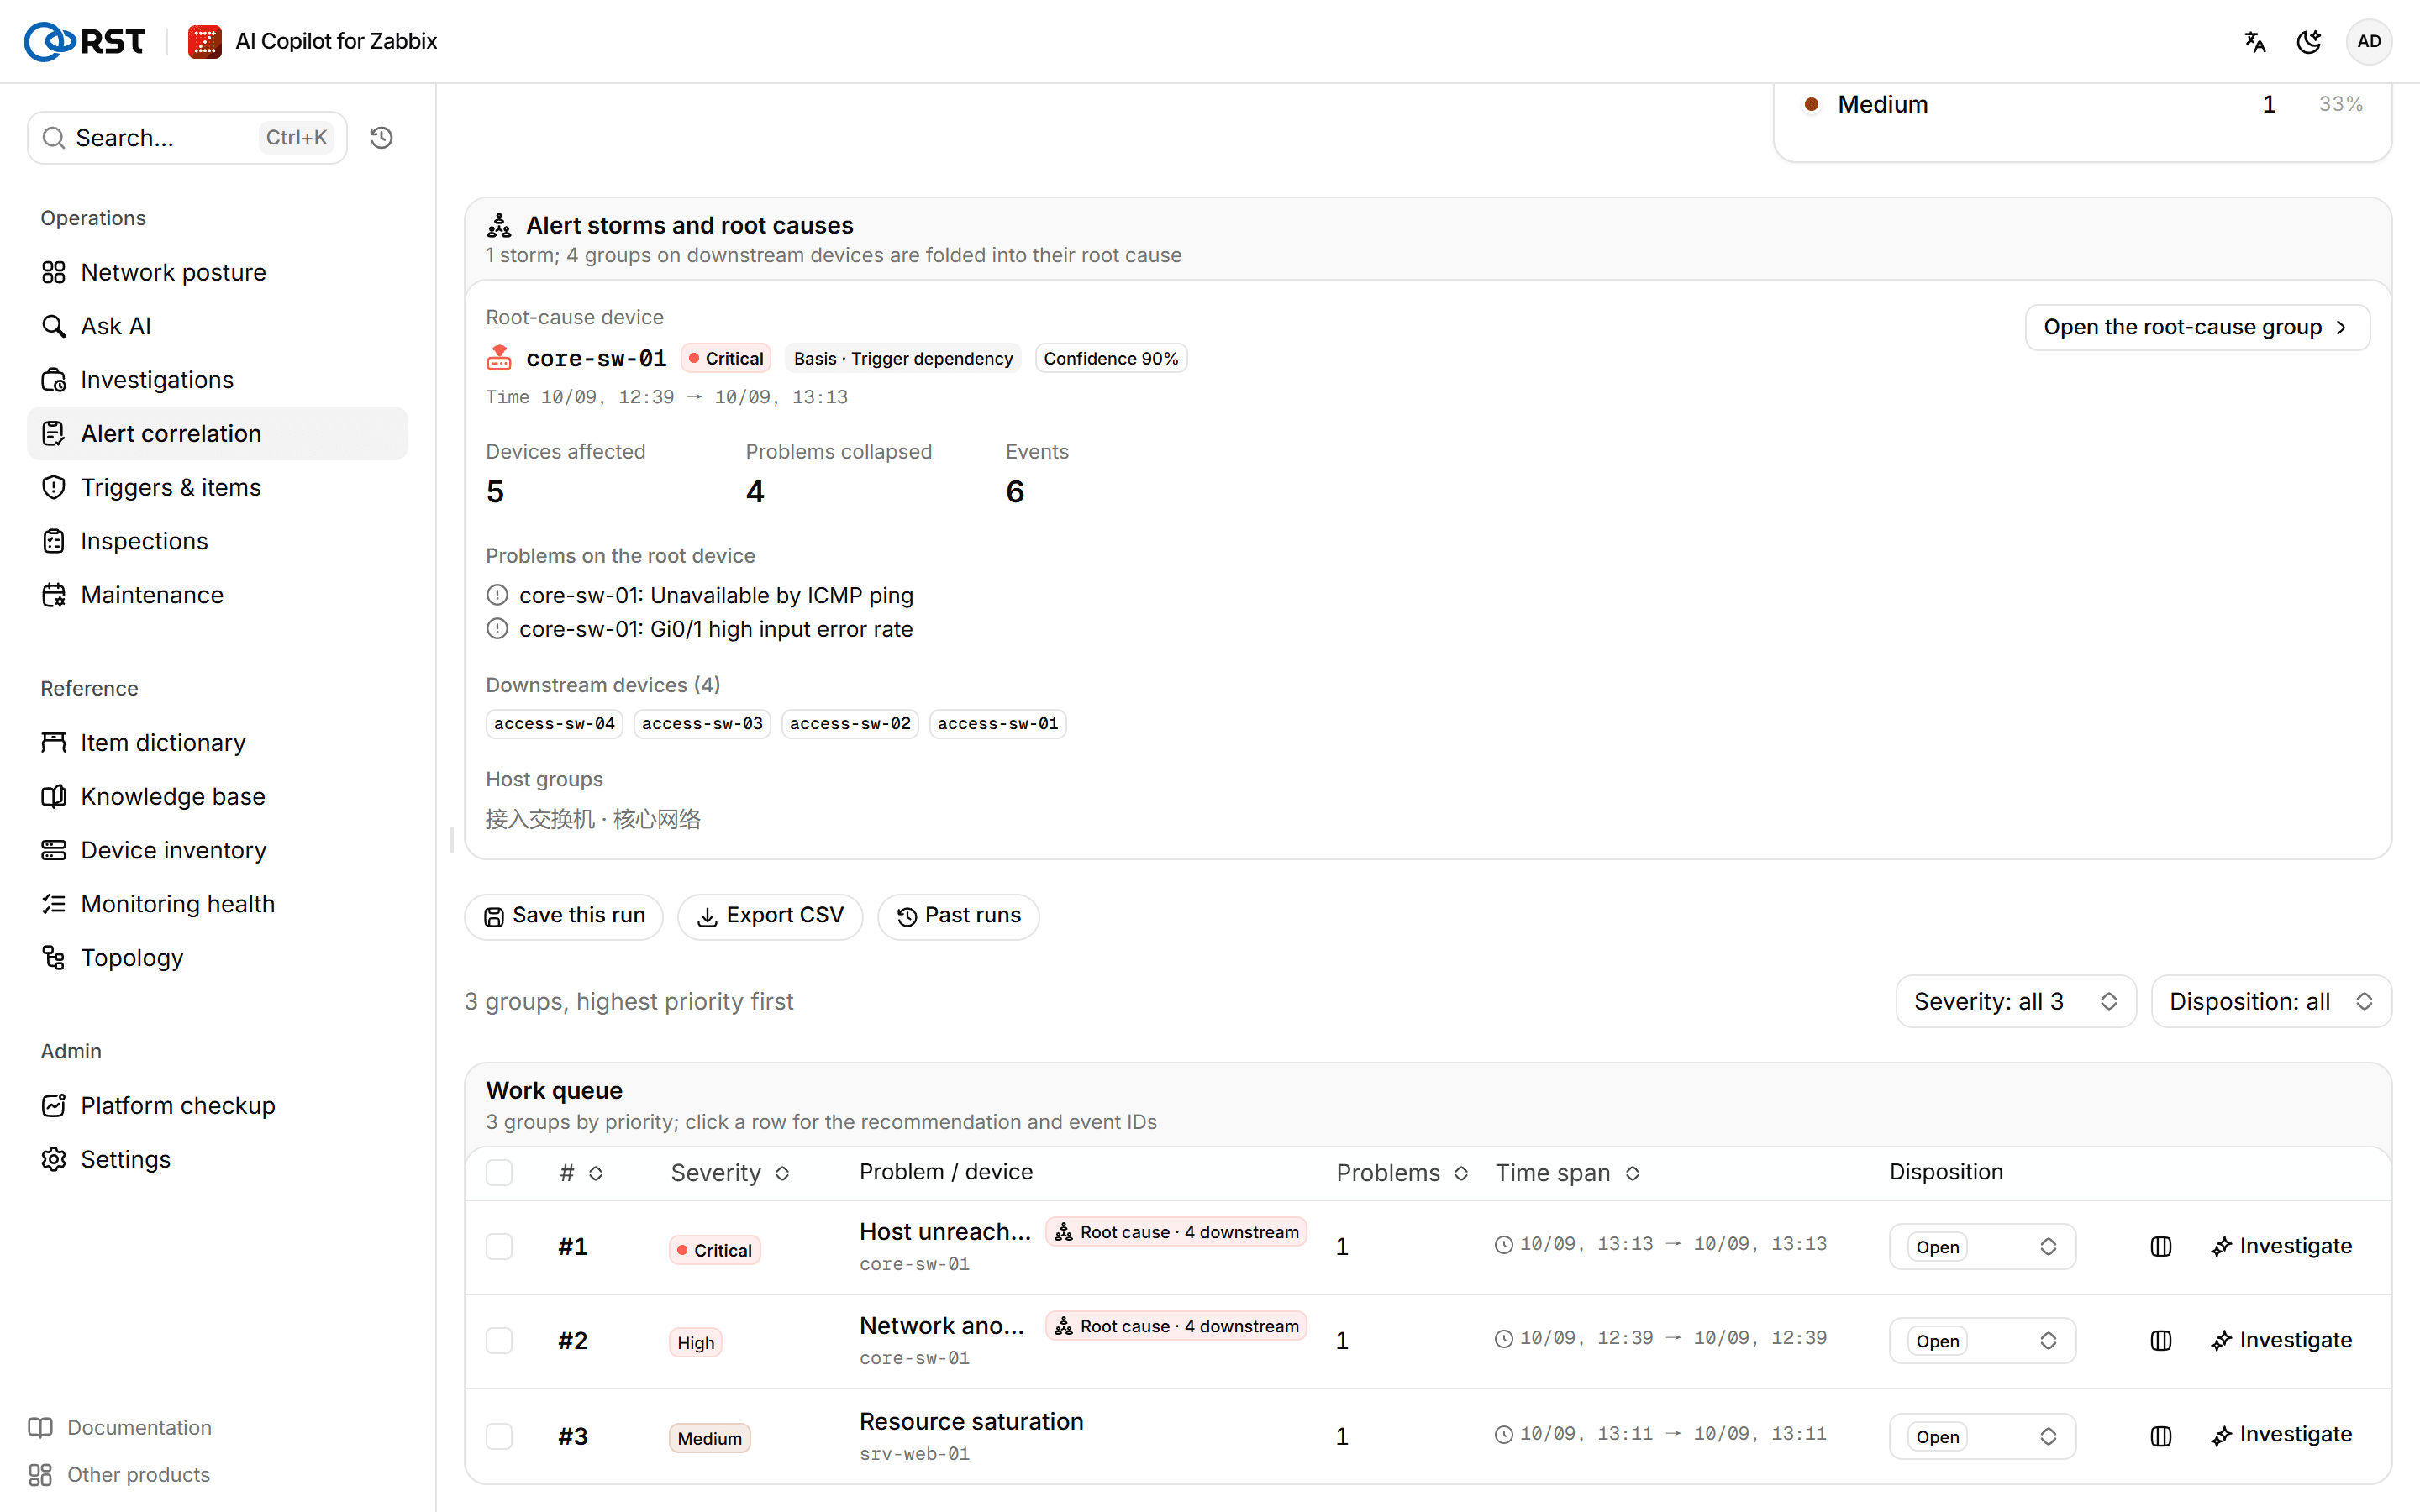
Alert storms and root causes lists each storm:
| Field | Content |
|---|---|
| Root-cause device | The most likely root-cause device |
| Basis | Trigger dependency, LLDP/CDP neighbour or same group, same time, with its confidence |
| Devices affected, Problems collapsed, Events | How many devices, collapsed problems and events the storm covers |
| Downstream devices | Devices taken down by the root device |
| At-risk neighbours | Devices directly connected to the root device that are not failing yet |
| Problems on the root device | The root device's own problems |
Groups on downstream devices are folded into their root cause and not listed separately in the work queue. Select Open the root-cause group to jump to the root device's group.
The Work queue lists groups by priority. Select a row to see its Recommendation and event IDs. On each row, Compare adds it to a side-by-side comparison at the bottom of the page, and Investigate starts a problem investigation around that device.
If the model is unavailable, the page says AI scoring is unavailable. Storms are still found, groups are ordered by Zabbix severity and problem count, and there are no AI recommendations. Submit again once the model is back. If there are more groups than the scoring cap, the page says how many were not scored; raise the cap and submit again.
Set dispositions
Dispositions are shared across the team: Open, Handled, False positive, Escalated.
Prerequisites
- Analyst or administrator role. Viewers can look but cannot change dispositions or save runs.
- Pushing an escalation needs an on-call channel under Outbound channels.
Steps
- Pick a status under Disposition on a group. You can also select several groups and set them in one step.
- When you choose Escalated, the page asks whether to push it to the on-call channel; confirm to push.
Dispositions live only on the gateway and are not written to Zabbix. To acknowledge the problems in Zabbix, use Live problems.
Save and export
Select Save this run and add an optional note; the run is saved on the server and visible to the whole team. Saved runs are under Past runs. Export CSV downloads the group list.
Live problems
Ingests problem events by polling or a Zabbix webhook and writes a one-line AI summary for each. Filter and acknowledge problems in the alert feed, and run an AI investigation on any one of them. Ingestion, summaries and acknowledgement in all editions; AI investigation Professional and above.
Triggers & items
Generate Zabbix triggers in plain language and create them disabled; get item keys and SNMP OIDs, template recommendations, LLD discovery-rule drafts and a diagnosis of unsupported items. Professional and above.