

Network posture
The on-call board: open problems, unreachable devices, busy links, flapping interfaces, a problem timeline, the noisiest triggers and the latest alerts. Read straight from Zabbix, no model calls. All editions.
Network posture answers "where is the network hurting right now". Every load reads Zabbix directly without calling the model, and it is available in every edition. The page refreshes every 30 seconds; select Pause refresh in the upper-right corner to stop it. The Window can be 1 hour, 6 hours, 24 hours, 7 days or 30 days, 24 hours by default. You can filter by Host group; with the host-group allowlist on, a host group is required.
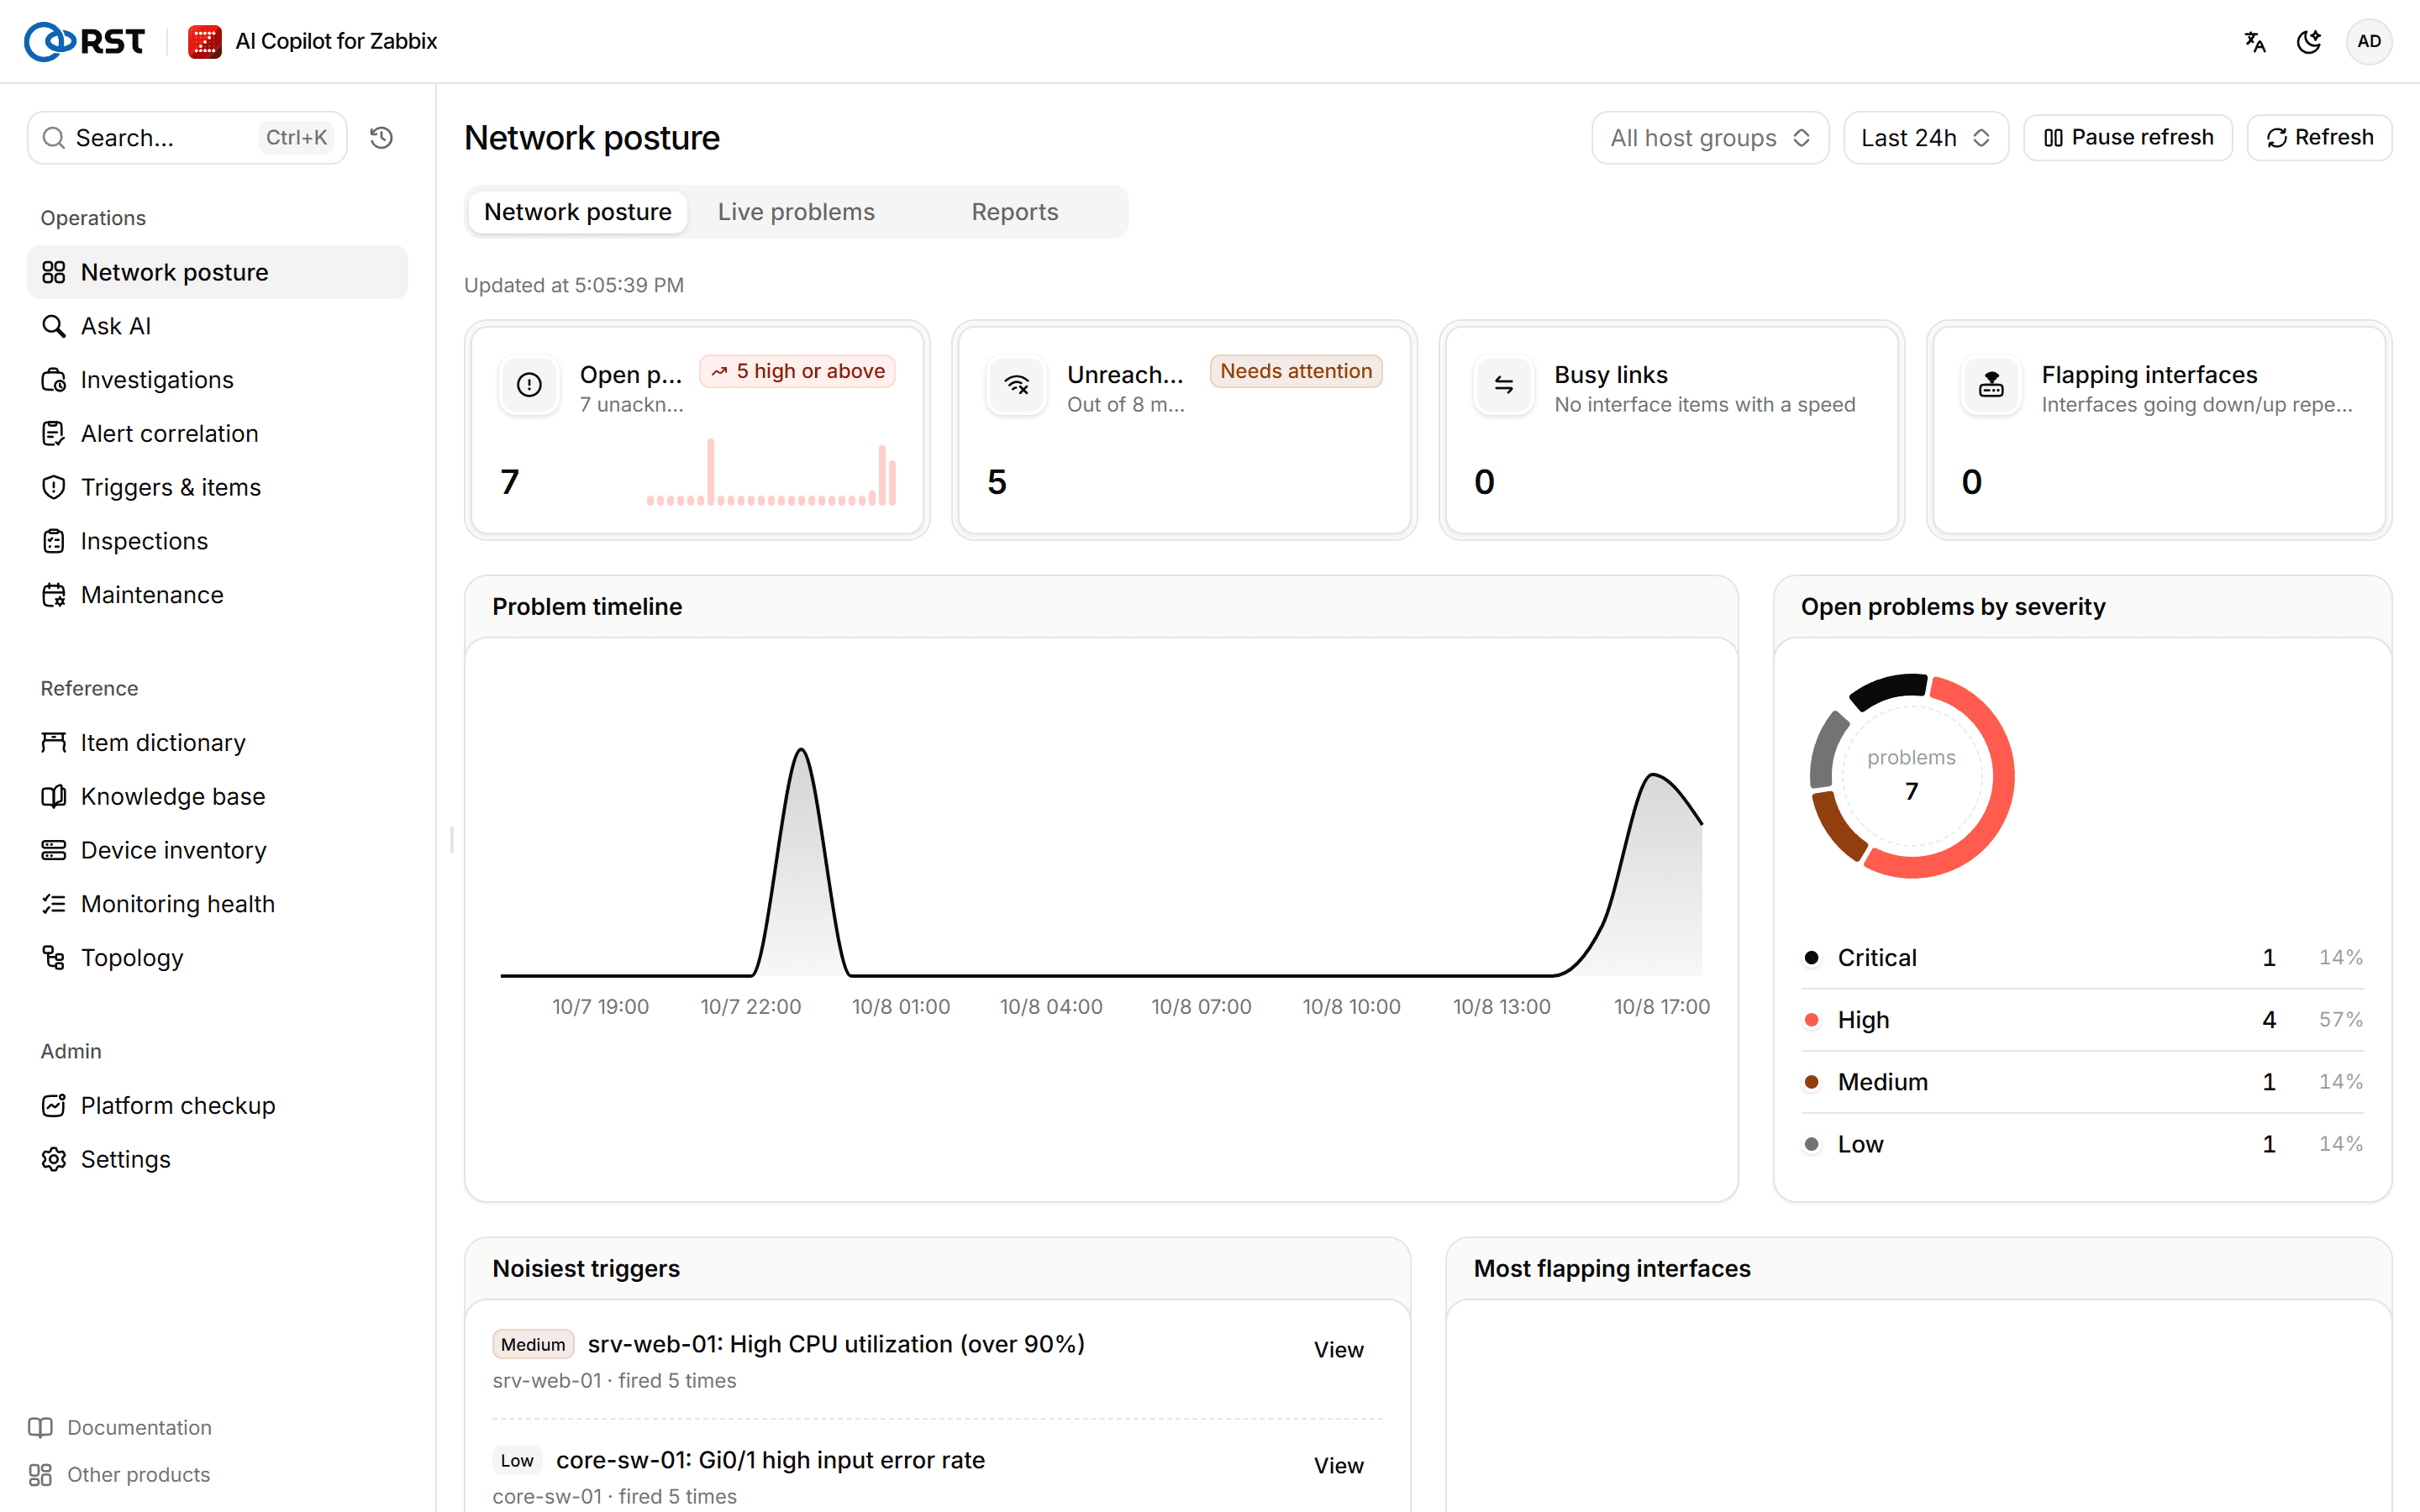
Key metrics
| Metric | How it is counted |
|---|---|
| Open problems | Problems not yet resolved, with how many are unacknowledged. Problems of high severity or above are counted on a badge |
| Unreachable devices | Monitored hosts whose agent, SNMP, IPMI or JMX interface is unavailable, or whose latest icmpping value is 0 |
| Busy links | Interfaces whose current in or out rate is at least 80% of net.if.speed. The threshold is set by RST_REPORT_LINK_BUSY_PCT. Without interface items that carry a speed, it shows No interface items with a speed |
| Flapping interfaces | Interfaces whose interface trigger fired 2 or more times in the window |
Interface triggers are recognized by name (for example Link down, Interface, operational status) or by tag (interface, ifname, port), which covers the stock Zabbix network templates.
Problem timeline and severity mix
Problem timeline counts problem events in the window per time bucket. Next to it, Open problems by severity shows the severity split of problems still open. With more than 10,000 problem events in the window, the page notes that the timeline and rankings only count the latest 10,000.
Rankings and latest alerts
| List | Content | Selecting an entry |
|---|---|---|
| Noisiest triggers | The 10 triggers that fired most in the window | Opens Live problems filtered to that trigger |
| Most flapping interfaces | The top 10 interface triggers that fired 2 or more times | Same |
| Unreachable devices | Unreachable devices and why | |
| Busy links | Links over the threshold | |
| Latest alerts | The most recent problems; filter with Search trigger or device | Opens that alert's details |
One noisy trigger often fills most of the queue. Regenerate its threshold in Triggers & items, or adjust it in Zabbix. For long-term link trends (P95, forecast), see Reports.
Maintenance
Describe a maintenance in one sentence and get a preview of the Zabbix maintenance; nothing is written to Zabbix until you confirm. Maintenance created by this product can be cancelled here. Drafting, creating and cancelling need Professional or above; Community can view the existing Zabbix maintenance.
Topology
Draws device links from Zabbix maps, LLDP/CDP neighbours and trigger dependencies, works out the blast radius of a device going down, and runs remote ping / traceroute from the Zabbix server or proxy. Topology and blast radius in all editions; remote diagnostics Professional and above.