

Live problems
Ingests problem events by polling or a Zabbix webhook and writes a one-line AI summary for each. Filter and acknowledge problems in the alert feed, and run an AI investigation on any one of them. Ingestion, summaries and acknowledgement in all editions; AI investigation Professional and above.
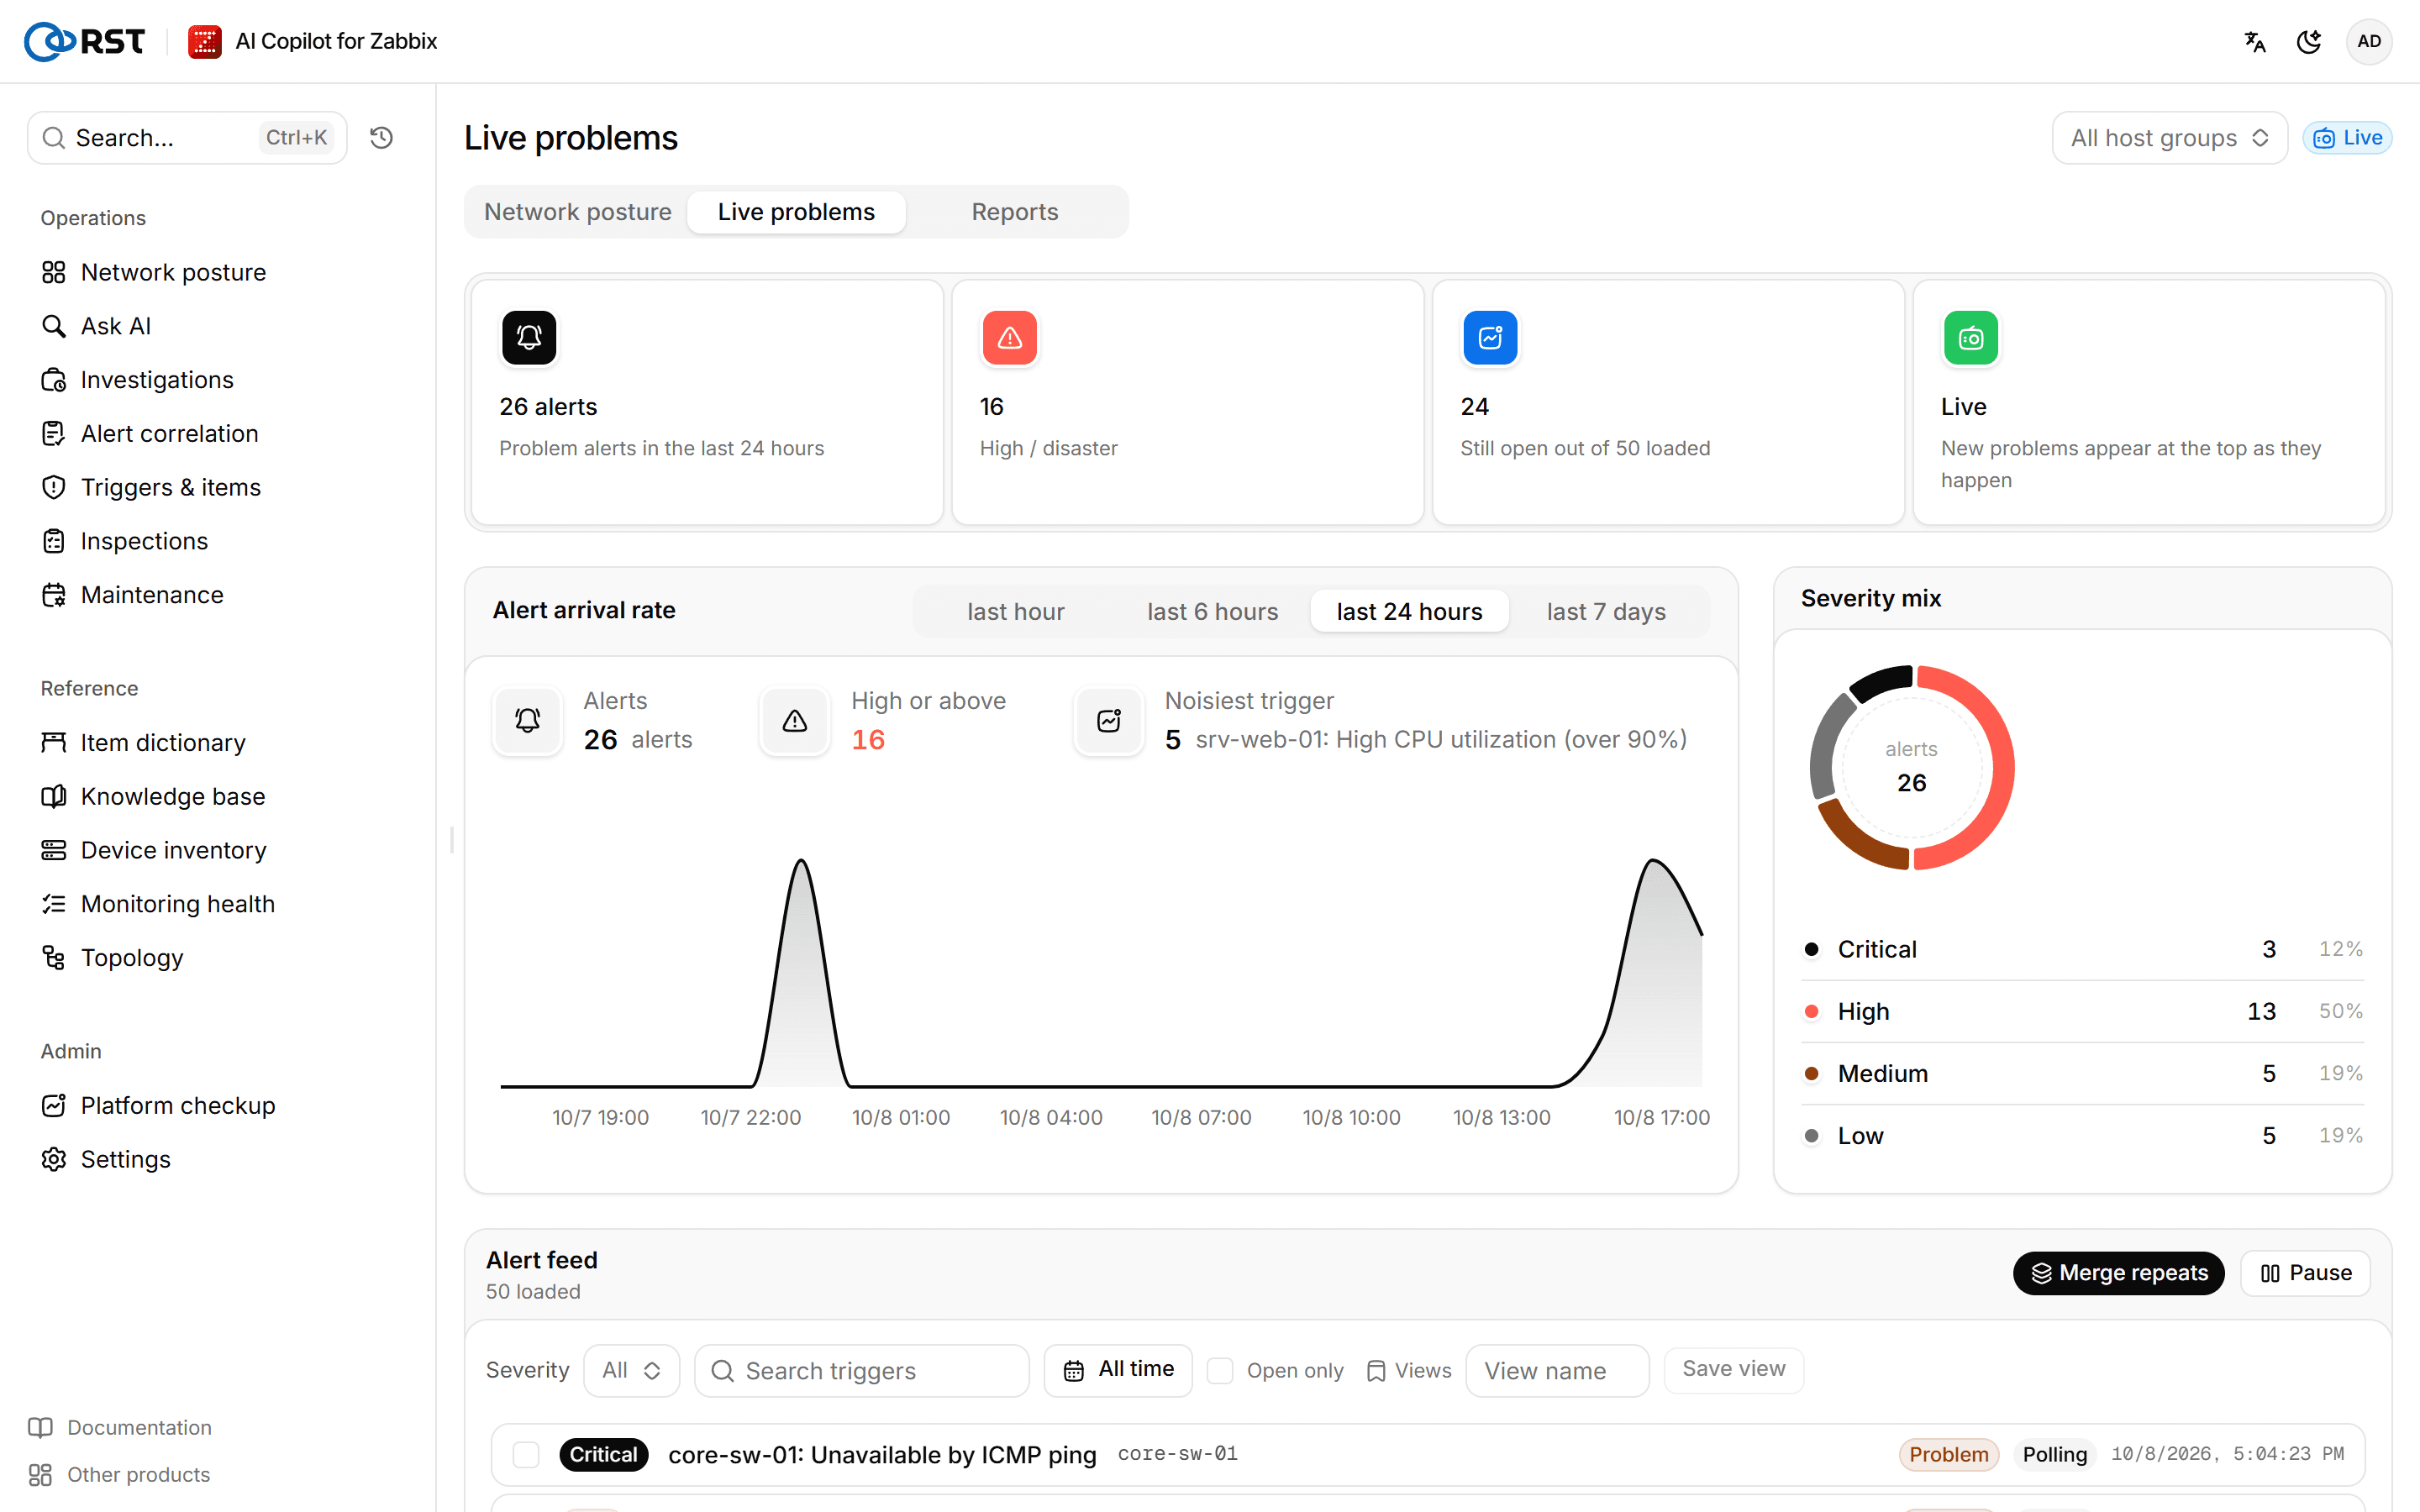
Live problems is a tab of Network posture. The gateway ingests problem events from Zabbix, writes a one-line AI summary for each new problem and pushes it to the alert feed in real time. Ingestion, summaries, filtering and acknowledgement are available in every edition. AI investigation belongs to the alert_investigation feature and needs a Professional or Enterprise license.
Alerts are kept on the gateway for RST_ALERTS_TTL_DAYS (30 days by default). AI summaries are written in the RST_OUTPUT_LANG language.
Alert ingestion
Alert ingestion at the bottom of the page shows the state of both ingestion paths. Both can run at once; the same event is never stored twice.
Polling (event.get)
The gateway calls event.get on an interval to pull new problem events and sweeps for recovered ones. Polling is on by default and configured with environment variables; restart the gateway after changing them:
| Variable | Default | Meaning |
|---|---|---|
RST_ALERT_INGEST_POLL | 1 | 0 turns polling off |
RST_ALERT_INGEST_INTERVAL_SECONDS | 15 | Interval, at least 3 seconds |
RST_ALERT_INGEST_GROUPS | empty (all host groups) | Comma-separated host group names |
RST_ALERT_INGEST_LOOKBACK | 1h | How far back the first poll looks, e.g. 24h, 7d |
Webhook push (Zabbix media type)
Zabbix pushes problem and recovery messages to the gateway as soon as an action fires, with no polling delay.
Prerequisites
- Administrator role (to download the media type file).
- Zabbix administrator rights to import the media type and create the action.
Steps
- Set
RST_ALERT_WEBHOOK_SECRET(a random string) on the gateway and restart it. Without it, the endpoint rejects every push. - Under Alert ingestion, select Download media type, and import it in Zabbix under Alerts → Media types.
- Edit the RST Copilot media type: set URL to the address shown in Push URL and Token to the secret from step 1. Fill GatewayToken if the gateway sets
RST_GATEWAY_SHARED_SECRET; otherwise leave it empty. - Add the media to a dedicated user (for example
rst-copilot), then create a trigger action whose operations and recovery operations send a message to that user.
Webhook alerts whose host is outside the host-group allowlist are dropped at ingest and never stored. The status shows N dropped (outside the allowlist), counted since the gateway started.
AI summaries
Each new problem gets a one-line AI summary, shown in the feed and in the details.
| Setting | Default | Meaning |
|---|---|---|
RST_ALERT_SUMMARY | 1 | 0 turns summaries off |
RST_ALERT_SUMMARY_MIN_SEVERITY | warning | Problems below this severity get no summary |
RST_ALERT_INGEST_BUDGET_S | 20 | Summary time budget per ingestion round (seconds) |
In an alert storm, problems on several devices that correlate into one incident share one summary from a single model call. When a batch runs over the time budget, the remaining alerts are stored as usual; their details show Skipped: over the summary budget and the ingestion status shows N without summary.
Alert overview
The summary cards at the top show problem alerts in the selected window, how many are high or above, how many of the loaded alerts are still open, and the live-stream state. Below them, Alert arrival rate and Severity mix switch between last hour, last 6 hours, last 24 hours and last 7 days. The page header filters by Host group.
Work the alert feed
New problems appear at the top of the feed as they happen. When you scroll away from the top or select Pause, new alerts are buffered until you return to the top or select Resume.
Steps
- (Optional) Filter by Severity, Search triggers, time range or Open only. Save a filter combination you use often under Views.
- (Optional) Turn on Merge repeats to fold repeated alerts from the same trigger into one row.
- Select an alert to open its details.
Coming from Noisiest triggers or Latest alerts on Network posture, the feed is already filtered to that trigger or has that alert open.
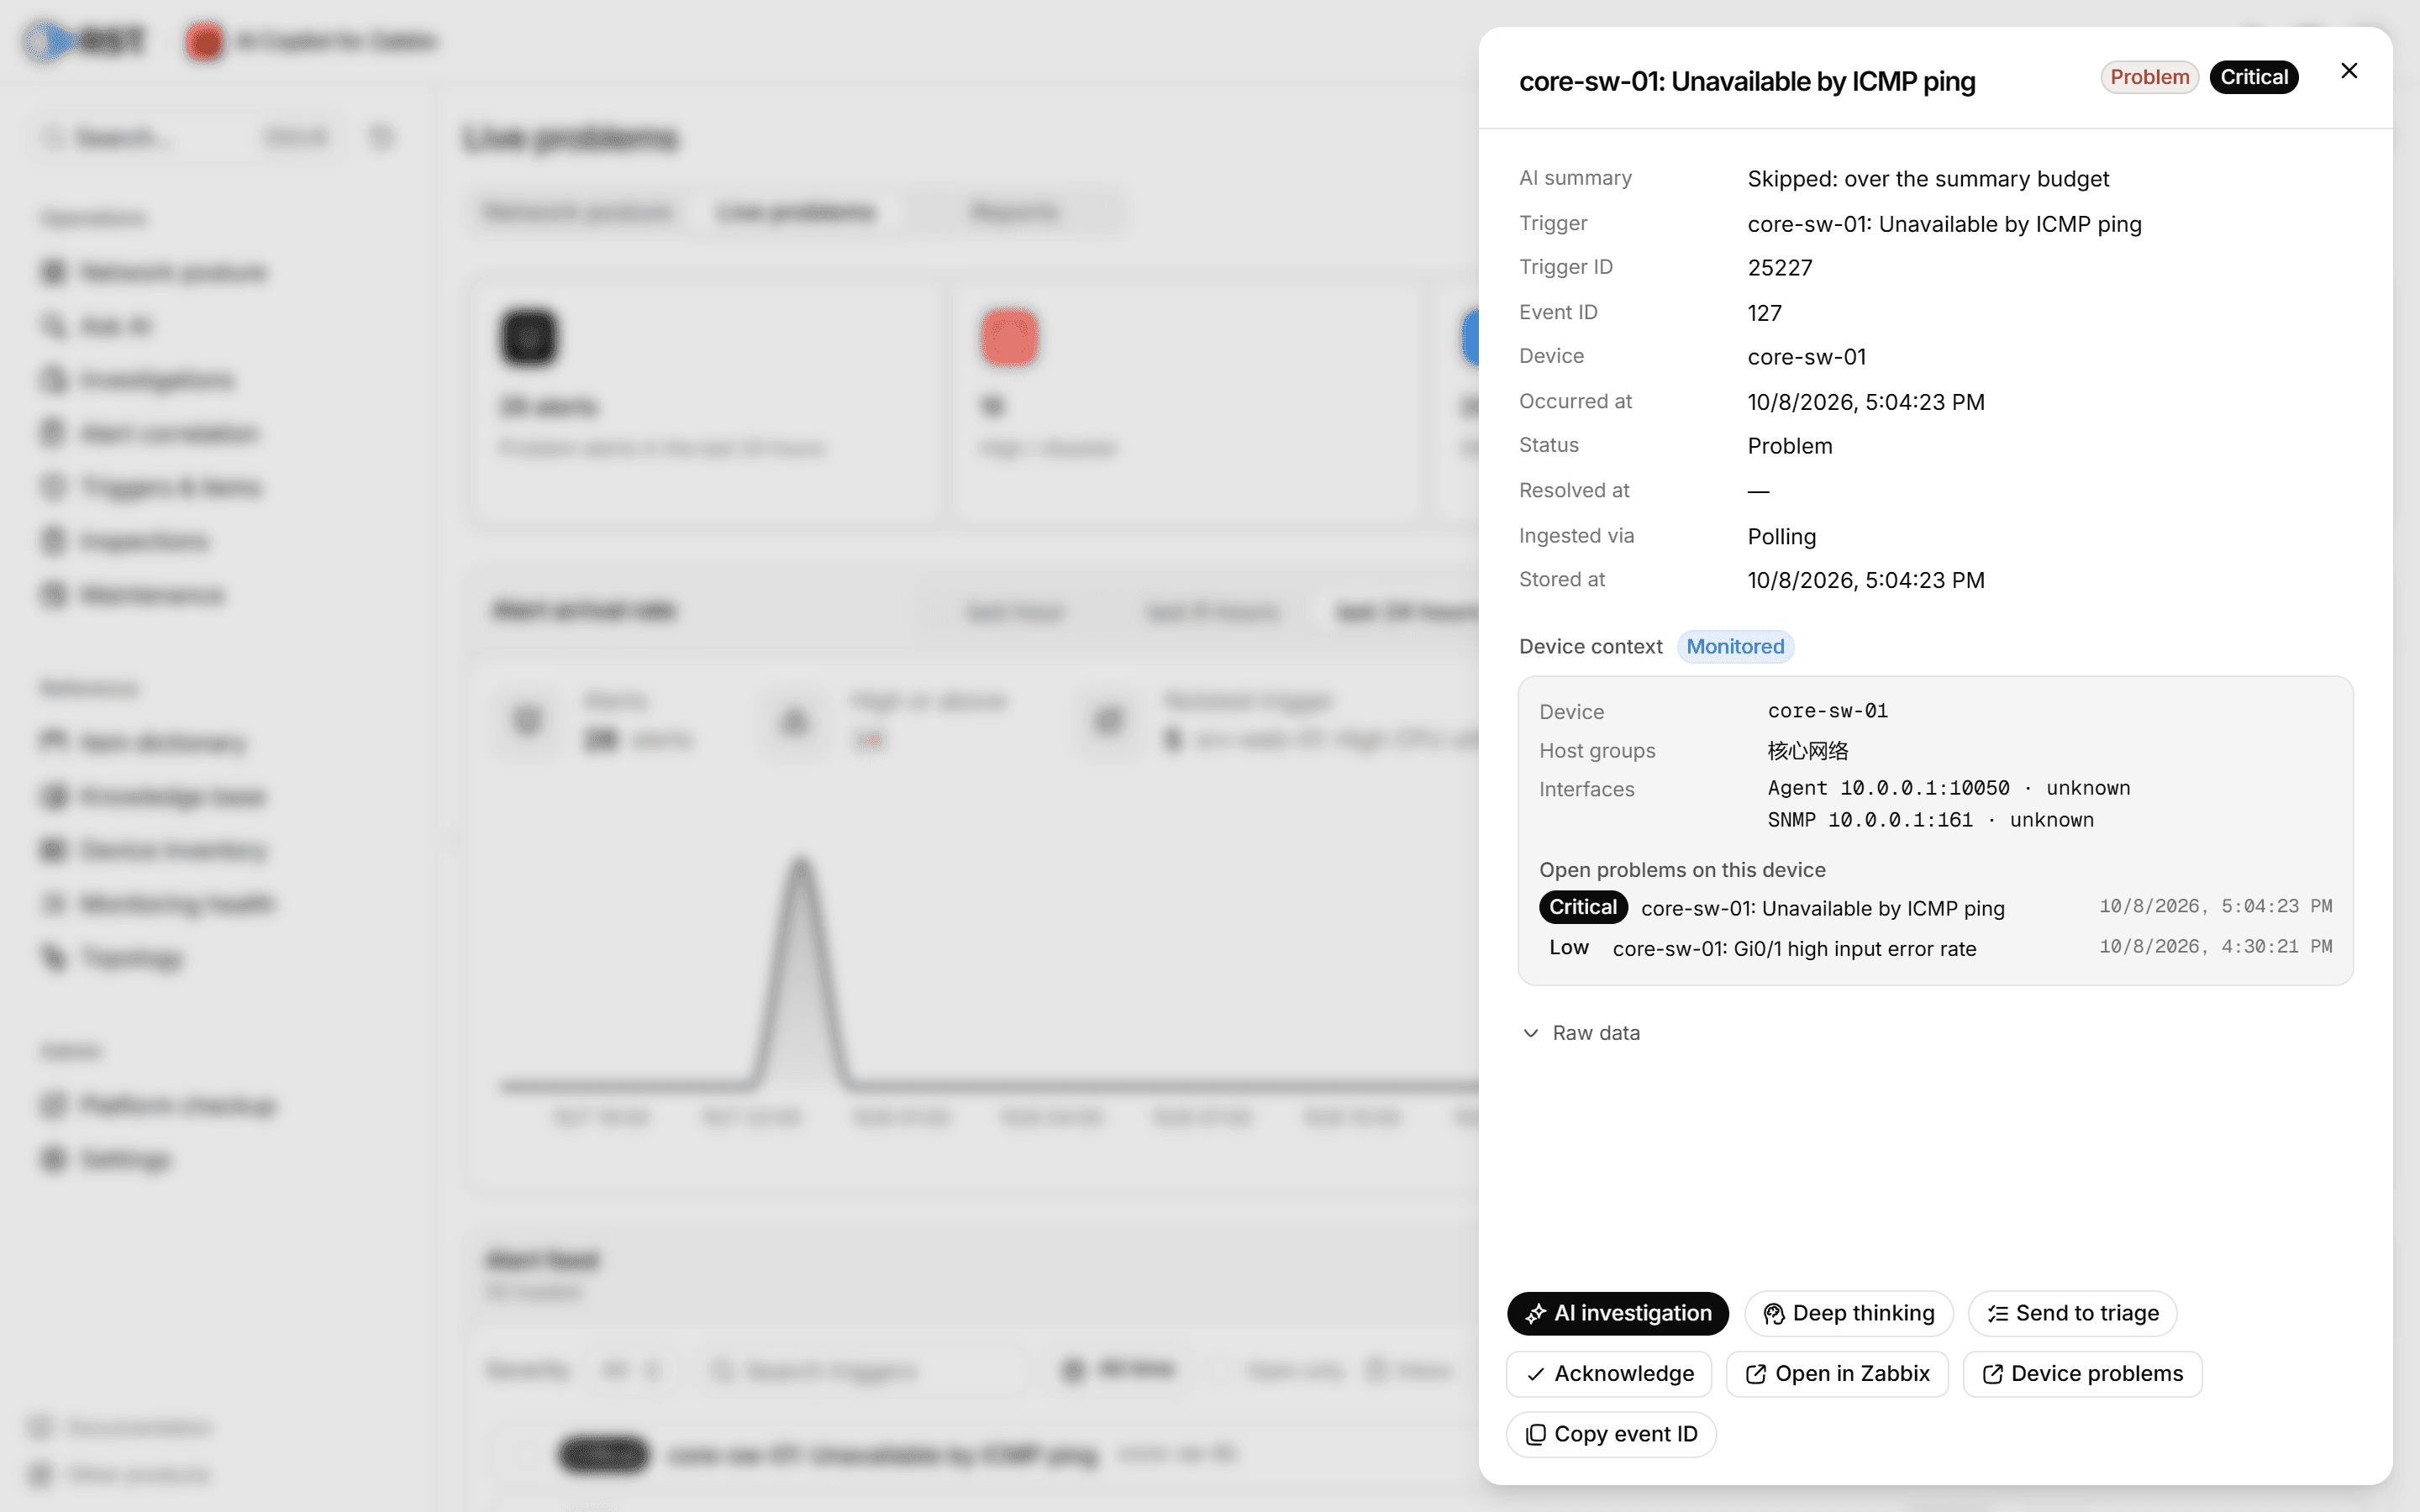
The details show the AI summary, trigger, event ID, device, occurrence and recovery times, how it was ingested, and Device context: host groups, interfaces and their availability, inventory, and the open problems on this device. The actions at the bottom:
| Action | What it does | Needs |
|---|---|---|
| AI investigation | See below | Professional or above |
| Send to triage | Brings this alert to Alert correlation | Professional or above |
| Acknowledge | Acknowledges the event in Zabbix | Analyst or administrator |
| Open in Zabbix, Device problems | Opens the event, or the device's problem list, in the Zabbix frontend | |
| Copy event ID |
Acknowledge problems in Zabbix
Prerequisites
- Analyst or administrator role, and the administrator has not taken the acknowledge permission away from that role.
- The Zabbix API account the gateway uses has write rights on the host.
Steps
- In the feed, select one or more alerts and then Acknowledge in Zabbix. Or select Acknowledge in the details.
The acknowledgement is written with event.acknowledge and appears in Zabbix under the gateway's API account; the actual user is recorded in the Audit log. An alert without a Zabbix event ID cannot be acknowledged.
AI investigation
An AI investigation is run by the network troubleshooting agent: the model calls read-only tools around the device over several rounds to gather evidence, then gives a conclusion. Every tool is read-only and scoped to the alert's host group. An investigation takes at most 6 rounds (RST_AGENTIC_MAX_STEPS) within a 180-second budget (RST_AGENTIC_DEADLINE_S); on timeout it concludes from the evidence gathered so far. If the model has no function calling, or RST_AGENTIC_INVESTIGATE=0 is set, it falls back to a single-step investigation.
| Tool | What it looks at |
|---|---|
| Interface traffic | In/out traffic and peaks per interface, with utilization against the interface speed |
| Interface errors | Interface errors and discards |
| ICMP | Ping reachability, loss and response time |
| Routing neighbours | BGP / OSPF neighbour state |
| Interface flaps | Interface up/down changes |
| Reboot check | Whether uptime fell back |
| Device health | Current, average and peak CPU, memory and temperature |
| Peer comparison | One item compared with devices in the same group and template: is it this device or all of them |
| Nearby problems | Problems on other hosts in the host group in the window: is it upstream or regional |
| Change signals | See below |
The model can also make read-only Zabbix API calls, checked by the same rules as in Ask AI.
Prerequisites
- A Professional or Enterprise license, including a trial.
- The alert's host belongs to a host group inside the host-group allowlist.
Steps
- In the alert details, select AI investigation.
- In the Problem investigation dialog that opens, wait for it to finish, usually 30 to 60 seconds.
The report is shown when it finishes and archived to Investigations. Its header shows severity, confidence, whether it is a likely false positive, the number of agent rounds and how much context was pulled. The report has a conclusion, False-positive verdict, Timeline, Impact chain, Affected objects, Recommended actions and Lookup steps (agentic), which lists each call and its hit count, failed steps included.
Select Export problem report (Markdown) to download the investigation report. To push the finding to notification channels, open the record in Investigations and select Push.
Change signals
"Did someone touch this device?" is the first on-call question. The gateway works out device changes only from data Zabbix already collects; it never logs in to a device and stores no device credentials. AI investigations read these signals through the change-signals tool.
| Signal | Based on |
|---|---|
| Reboot | system.uptime, sysUpTime or hrSystemUptime fell back. A 32-bit counter wrapping after about 497 days is not counted |
| Firmware change | The value of a sysDescr, OS or firmware text item changed |
| Configuration change | Cisco ccmHistoryRunningLastChanged / ccmHistoryStartupLastChanged moved; a Huawei config-change trap item (hwCfgManEventlog, hwCfgChgNotify) received a value; or a trigger event carries a config-change tag, set by RST_CHANGE_TAGS |
| Interface flap | ifOperStatus changed state; 3 or more changes count as flapping |
A device without the matching items produces no such signal.
Remote ping / traceroute
Select a device on Topology to run ping or traceroute against it from the Zabbix server or proxy. This needs a Professional or Enterprise license.
Investigations
Automatic archive of problem investigations and alert correlations, kept per account, with follow-up questions about a device and pushing a finding to notification channels. All editions.
Alert correlation
Collapses a burst of concurrent problems into alert storms with a root-cause device and blast radius, then has AI score the remaining groups and recommend actions. Professional and above.