

Platform checkup
A check-up of Zabbix itself: version, self-monitoring data, monitoring queue, process busy, cache usage, HA nodes, proxy status and unsupported items. The AI read groups failing checks by cause and orders the fixes. Professional and above.
The platform checkup looks at the Zabbix server itself: is data collected on time, are pollers and caches large enough, are proxies and HA nodes online. It only reads data through the Zabbix API. The checkup and the AI read belong to the platform-ops copilot (platform_ops_copilot) and need a Professional or Enterprise license, including a trial. Both follow the interface language. In Community you can open the page as a preview; no checkup runs, and Run again opens an upgrade dialog.
The tabs at the top of the page also hold the audit log and Outbound channels.
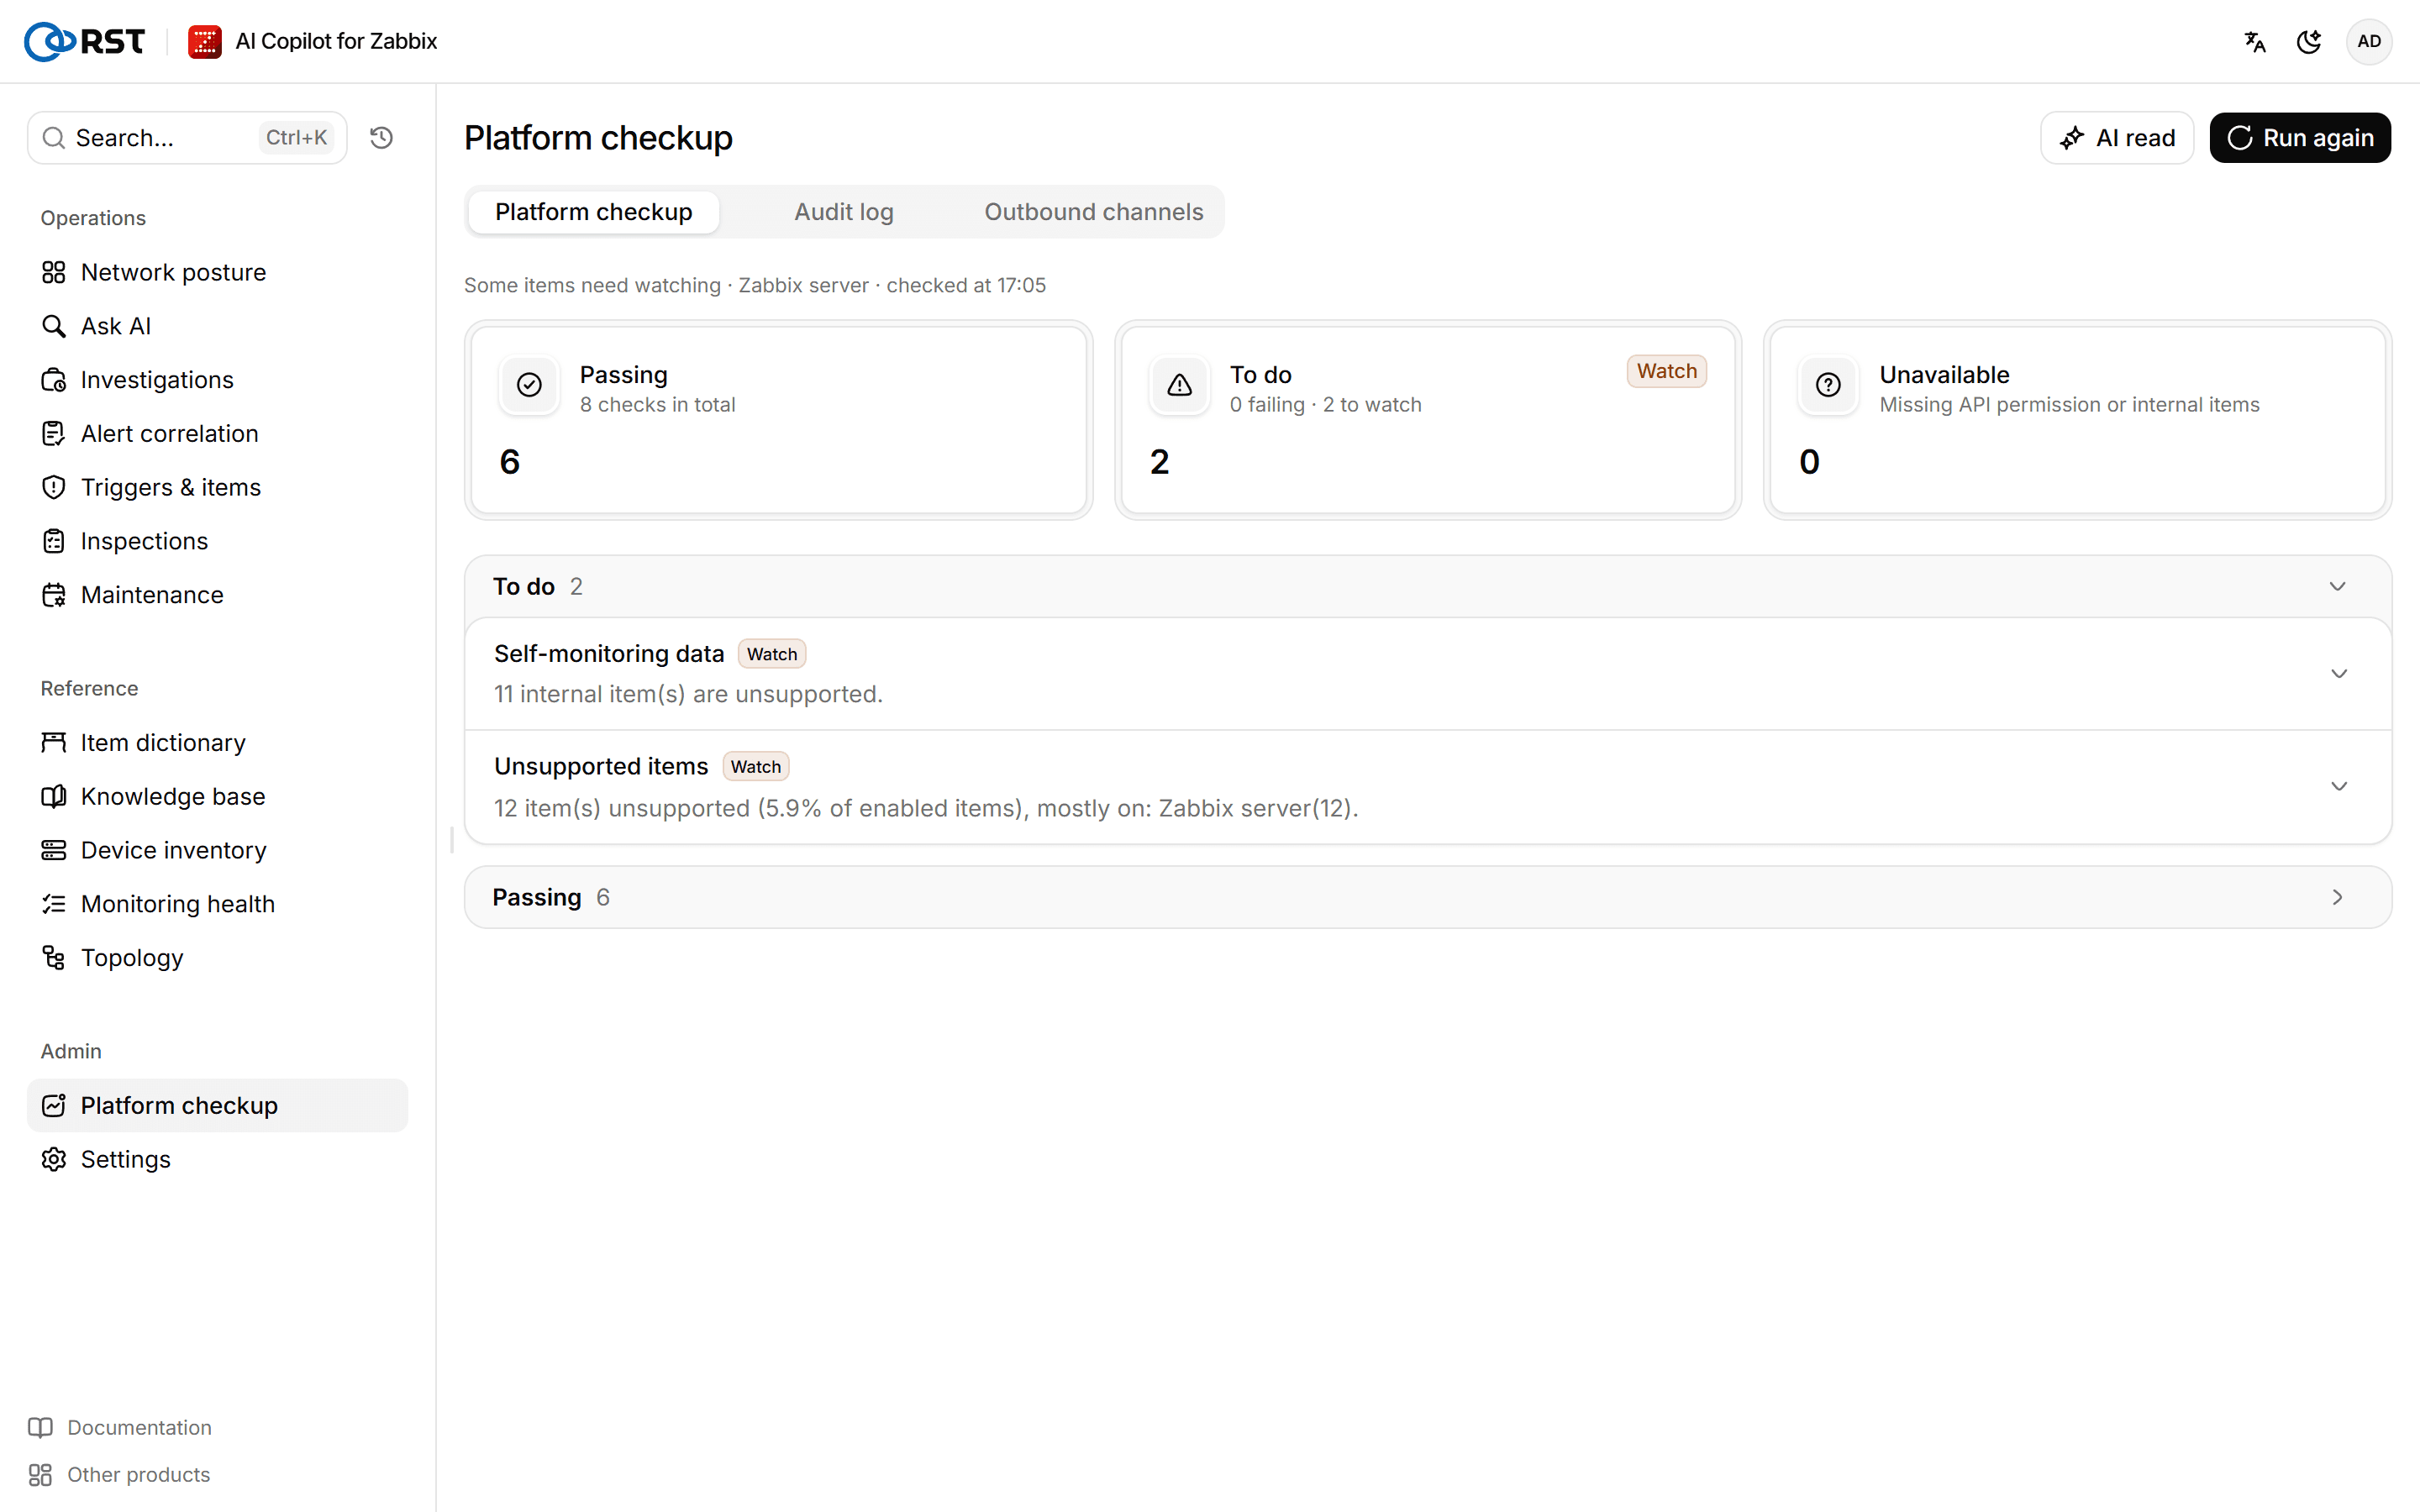
Run a checkup
Steps
- Open Platform checkup. The page runs a checkup automatically.
- After fixing something, select Run again.
Check-up overview gives a one-line verdict and three counts: Passing, To do (failing and to watch) and Unavailable (missing API permission or internal items). Checks groups the checks into to do, passing and unavailable, each with its verdict, result and suggested fix.
Unavailable is not an error. The two usual causes:
- The queue, process and cache checks read the Zabbix server's internal items (
zabbix[...]). Check that the host "Zabbix server" is linked to the "Zabbix server health" template and that the gateway's API account can read that host. If the host has another name, setRST_ZABBIX_SERVER_HOST. - The HA nodes check calls
hanode.get, which needs Super admin rights. See Zabbix permissions.
Get the AI read
Each check already has its own verdict and advice. The model's job is to connect them: busy unreachable pollers, a growing queue and one proxy offline are often a single cause (a site link is down). The AI read says which checks share a root cause, what to fix first and how.
Prerequisites
- A Professional or Enterprise license, including a trial.
Steps
- When some checks did not pass, select AI read in the upper-right corner of the page.
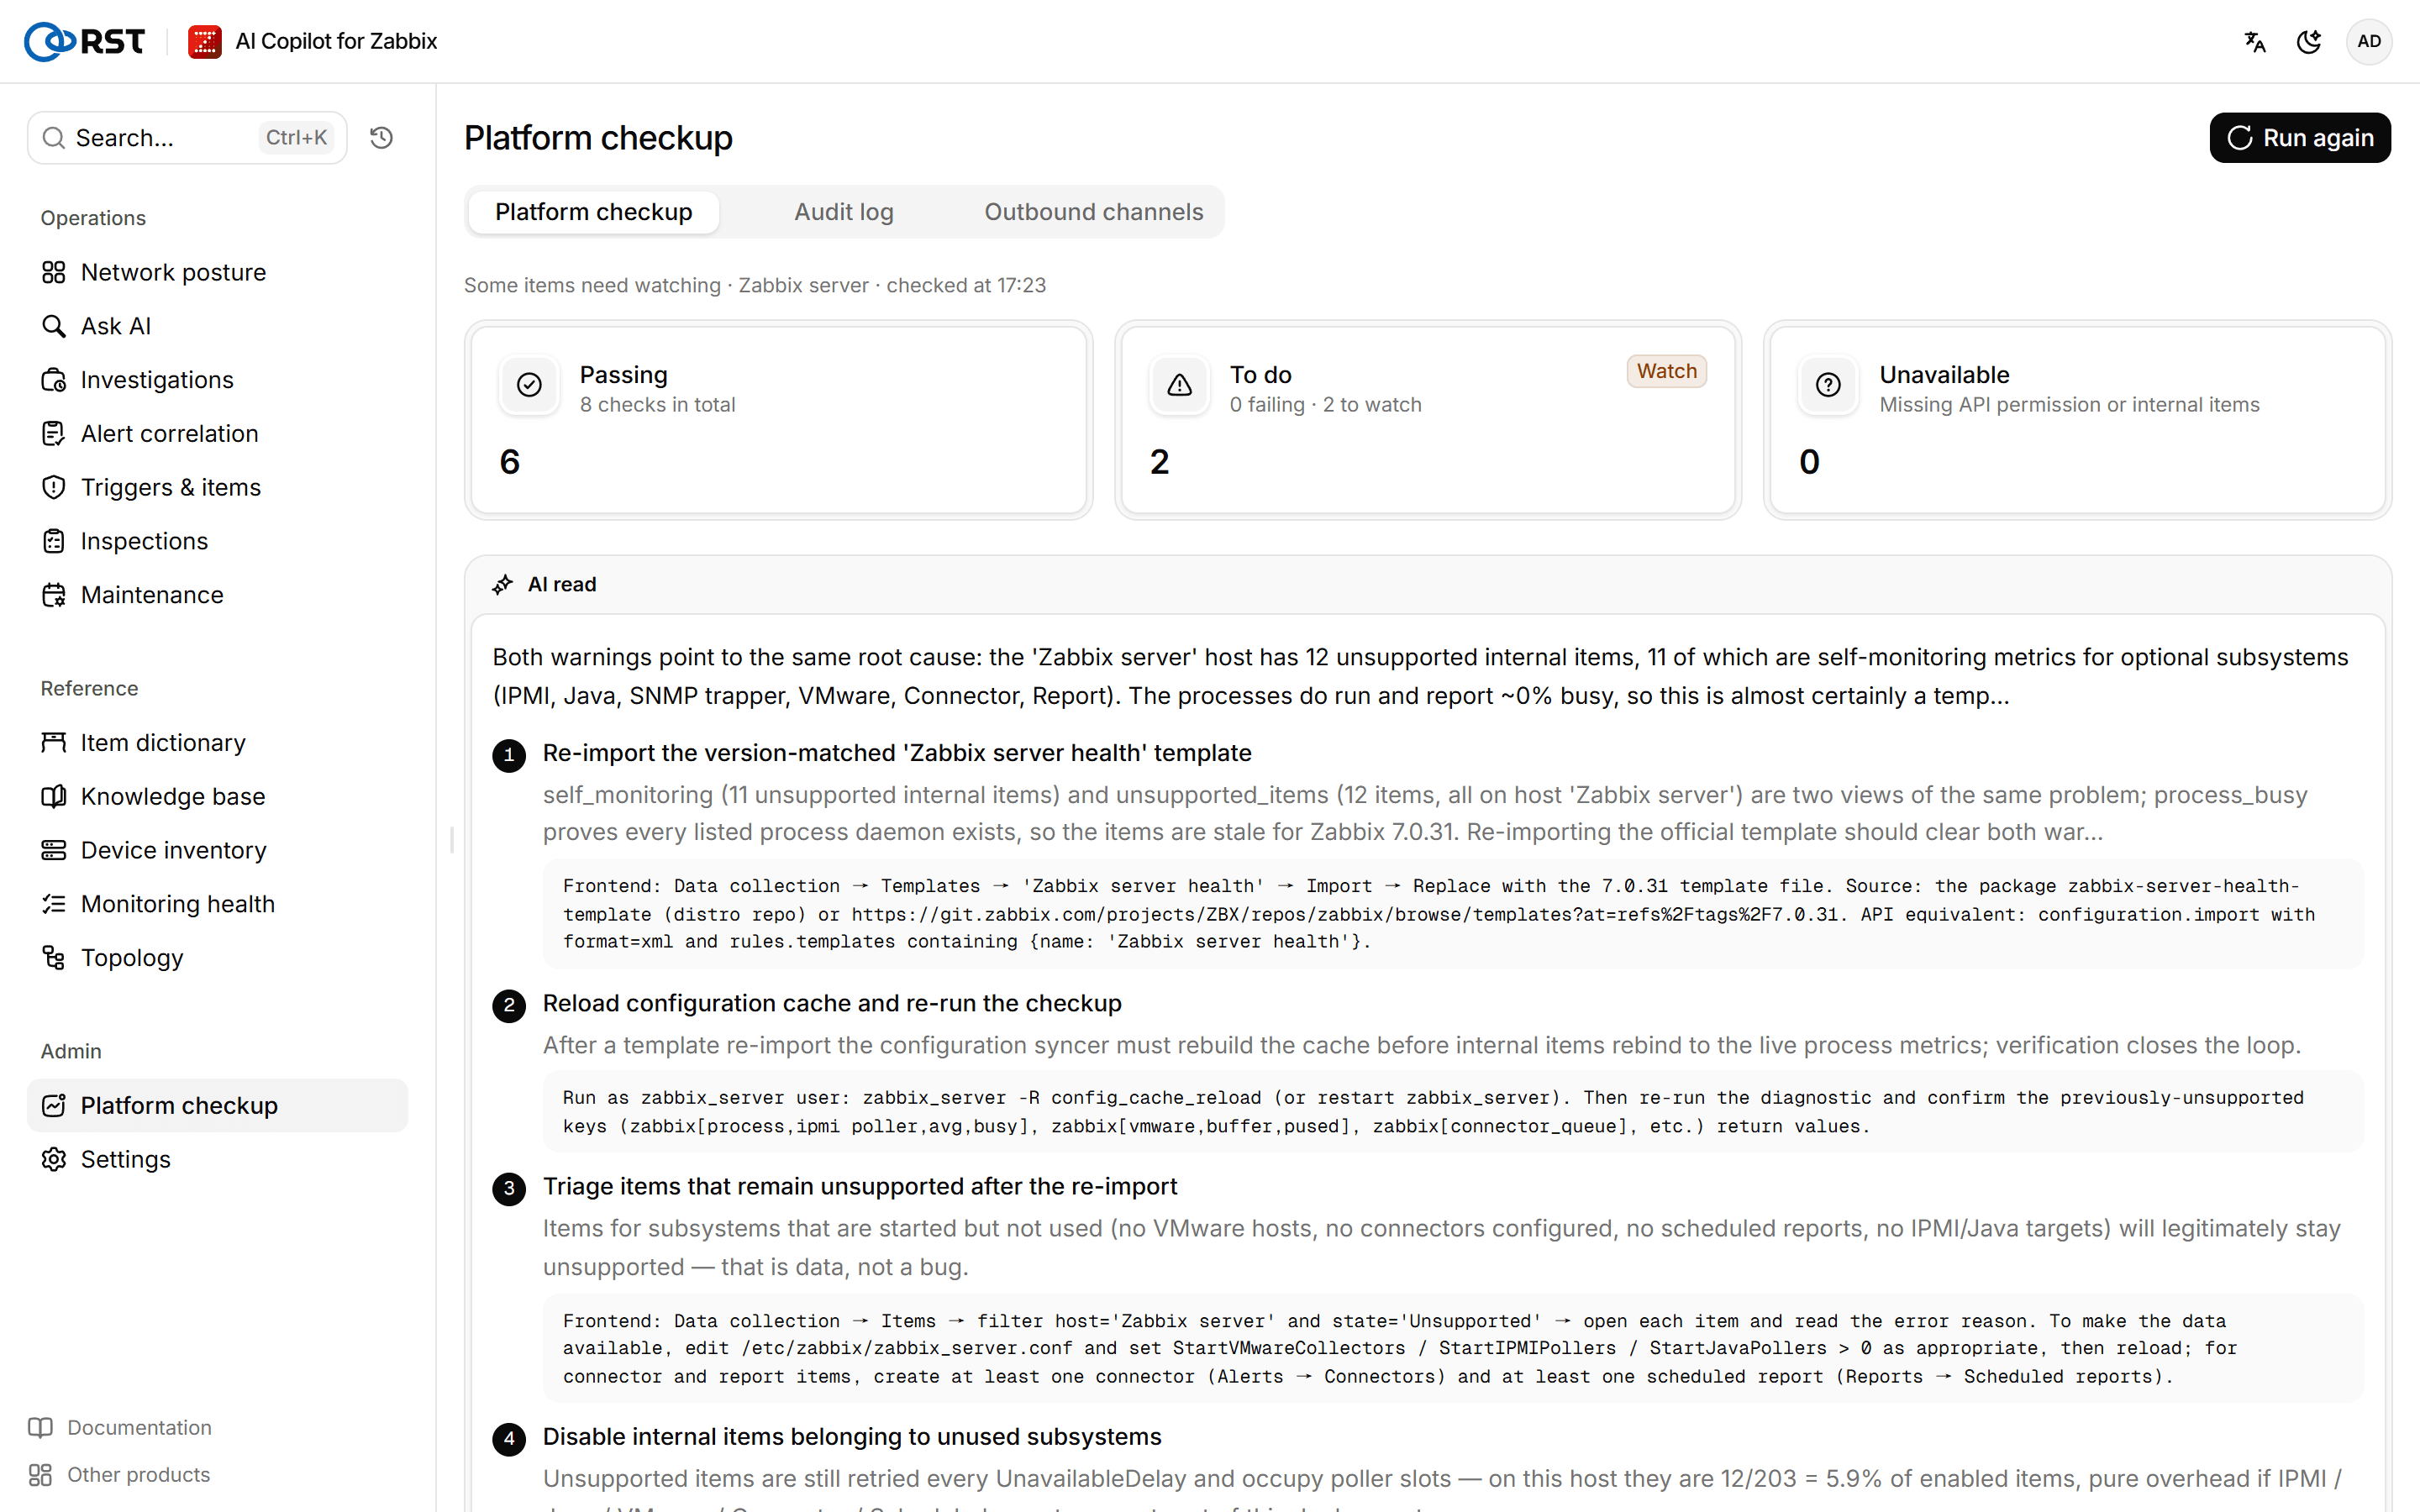
If every check passes, AI read is not shown and no model is called. With a knowledge base configured, the model also retrieves relevant documents and the result notes that it did. If the model returns nothing usable, the page lists the checks ordered by their own severity.
Checks
| Check | What it looks at | Verdict |
|---|---|---|
| Zabbix version | The version returned by apiinfo.version | Below 6.0 is watch (no longer supported upstream). A 6.x release other than 6.0 LTS is watch |
| Self-monitoring data | Whether the Zabbix server's internal items are updating | No update for more than RST_OPS_INTERNAL_STALE_S (900 seconds by default) is failing. No internal items found, or unsupported internal items, is watch |
| Monitoring queue | zabbix[queue,10m]: items delayed by more than 10 minutes | 1 or more is watch, 100 or more is failing |
| Process busy | Average busy rate per process type, zabbix[process,*,avg,busy] | 75% or more is watch, 90% or more is failing |
| Cache usage | Usage per cache, zabbix[*cache,*,pused] | 75% or more is watch, 90% or more is failing |
| HA nodes | The state of each node in the HA cluster | No active node is failing. A node unavailable or stopped is watch. HA not enabled passes |
| Proxy status | Time since each proxy last checked in, and version compatibility | 300 seconds is watch, 1,800 seconds is failing. An outdated version is watch, an unsupported one is failing. No proxies configured passes |
| Unsupported items | Enabled items in the unsupported state | Any is watch. 20% or more of enabled items is failing |
The thresholds are set with the RST_OPS_* settings; see the configuration reference.
Inspections
Scheduled inspections by host group and check: metric thresholds, host availability and open problems, compared with the previous run, written up with AI suggestions and delivered. Professional and above.
Settings
Zabbix connection test, host group allowlist, field masking mode, switching off write actions per role, separation of duties, version updates and content packs. Changes apply as soon as they are saved. Available in every edition; separation of duties needs Enterprise.