

Reports
Daily, weekly and monthly reports: problem counts, time to resolve, device availability, link capacity and fill-up forecast, SLA compliance and AI usage. Generate on demand, or on a schedule with archiving and delivery. Professional and above.
Reports is a tab of the Network posture page. It rolls a period's operations data into one report. Reports, SLA, scheduled reports and the inspection report history belong to the reports feature and need a Professional or Enterprise license, including a trial. Without one you can browse the page, and generating a report opens the upgrade dialog.
The data comes from Zabbix problem records, interface traffic trends, ICMP ping and SLAs; AI usage comes from the gateway's audit log. The gateway computes the report itself; no model is called.
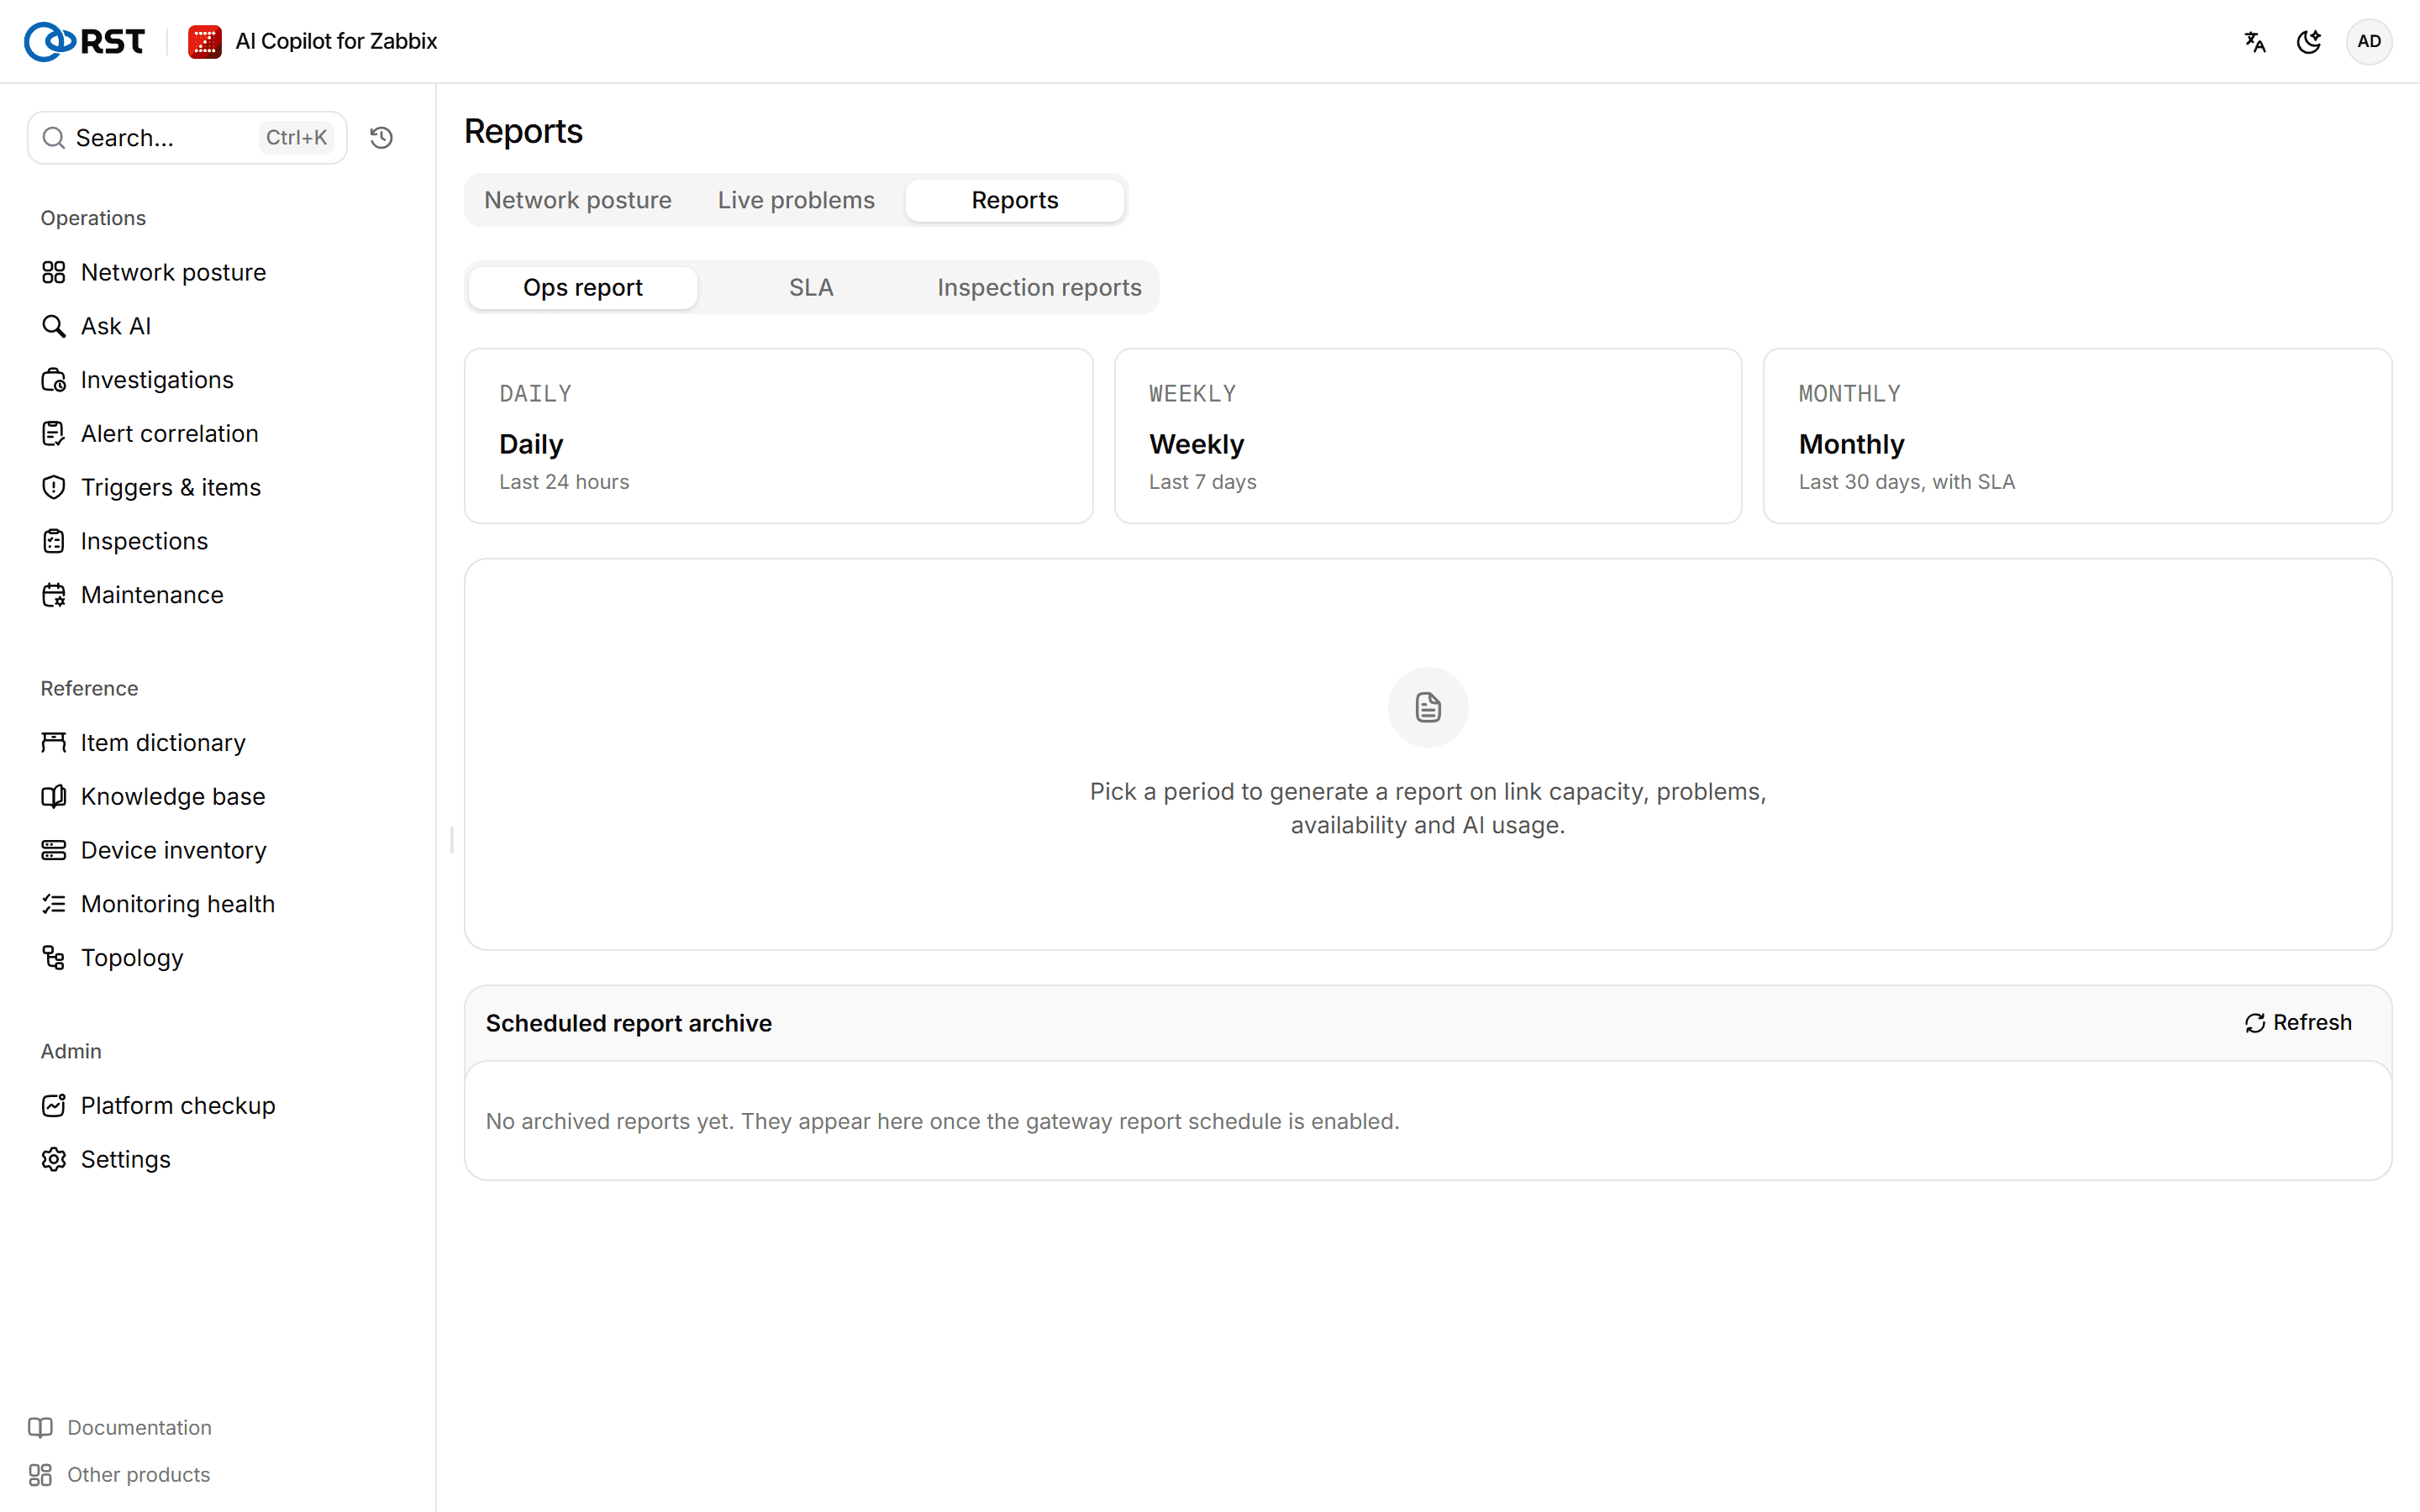
Generate a report
Steps
- Open Reports. On the Ops report tab, under Choose a report period, select Daily, Weekly or Monthly, covering the last 24 hours, 7 days and 30 days. The monthly report includes SLA.
- Wait a few seconds for the report to appear below.
- (Optional) Select Regenerate to recompute with the latest data, or Download .md to save the full Markdown.
If a data source fails, the top of the report lists it, and the numbers that depend on it are placeholder zeros, not real zeros.
Report contents
| Section | Contents |
|---|---|
| Executive summary | Problems (with open and acknowledged counts), Mean time to resolve (with mean time to acknowledge), Average availability, Busy links |
| Problem severity | Problems in the period by severity |
| Most frequent triggers, Devices with most problems | Top 10 of each |
| Link capacity top N | In and out P95 from hourly trends and utilization, using the busier direction |
| Capacity forecast | Linear-trend estimate of when each link fills up; only links that fill up within RST_REPORT_FORECAST_DAYS (90 by default) are listed |
| Least available devices | Share of the period each device answered ICMP ping |
| SLA | SLA compliance in the monthly report; see below |
| AI usage | Calls, success rate, users, average latency, usage by feature and top users |
| Report body | The full Markdown |
A busy link is one whose P95 utilization is at least RST_REPORT_LINK_BUSY_PCT (80% by default). Link data comes from net.if.in and net.if.out items with trend data, and availability from icmpping items. Without those items the matching sections are empty.
View SLAs
The SLA tab reads the SLAs configured in Zabbix (Services → SLA in Zabbix) and lists each service's SLI, SLO, downtime and whether it was met.
Steps
- Select the SLA tab.
- Pick an SLA or All SLAs, then pick the Period.
If no SLA is configured in Zabbix, the page says so.
Schedule reports
Scheduled reports are off by default. The easiest way to turn them on is in the UI:
Steps
- Open Platform checkup → Outbound channels, and on the Destinations tab pick the periods under Schedule.
- Pick the hour of day and the time zone, and select Save the schedule.
The schedule takes effect as soon as it is saved, with no restart: the daily report runs every day, the weekly report on Mondays and the monthly report on the 1st, at that hour. See Outbound channels.
If no period is picked under Schedule, the gateway's environment variables decide instead:
RST_REPORT_SCHEDULE=daily,weekly,monthlyRestart the gateway container after setting it. By default the daily report runs at 01:00, the weekly report on Mondays at 02:00 and the monthly report on the 1st at 03:00, in the RST_REPORT_TZ time zone (UTC by default). RST_REPORT_CRON_DAILY, RST_REPORT_CRON_WEEKLY and RST_REPORT_CRON_MONTHLY take other cron expressions. For other settings, see the configuration reference.
Scheduled reports appear under Scheduled report archive and are kept for RST_REPORT_RETENTION_DAYS days (90 by default).
Deliver reports
When a scheduled report is generated, it is pushed to every destination in Outbound channels bound to that period: Feishu, DingTalk, WeCom, Teams, Slack or email.
Inspection reports
The Inspection reports tab lists the reports produced by inspection tasks, with the task, time generated, status, highest severity and number of findings. Select a report to read it in full.
Knowledge base
Upload runbooks and SOPs; problem investigation, alert correlation, result explanations, trigger generation and the platform checkup retrieve and cite them. Needs an embedding model. Available in every edition.
Inspections
Scheduled inspections by host group and check: metric thresholds, host availability and open problems, compared with the previous run, written up with AI suggestions and delivered. Professional and above.