

Reports
Daily / weekly / monthly SOC operations summaries, a seven-section incident report, archive, Markdown export, push to Feishu or open a ticket.
Operations reports
Generate a summary for a period (day / week / month, or a custom range) from this instance's own data:
| Section | Source |
|---|---|
| Executive summary | The model's summary of the sections below (paid engine; without a licence only the tables appear) |
| Alert posture | Alert index: totals, by severity, top rules / subjects (enriched with names and criticality from the Asset inventory) |
| Investigations | Investigation / triage / explanation counts and severity split in the period |
| Triage | Clusters, likely false-positive share |
| Baseline | Latest patrol score and failed checks |
| Audit and usage | AI calls, success rate, tokens, top indexes |
| Platform health | Check-up verdict |
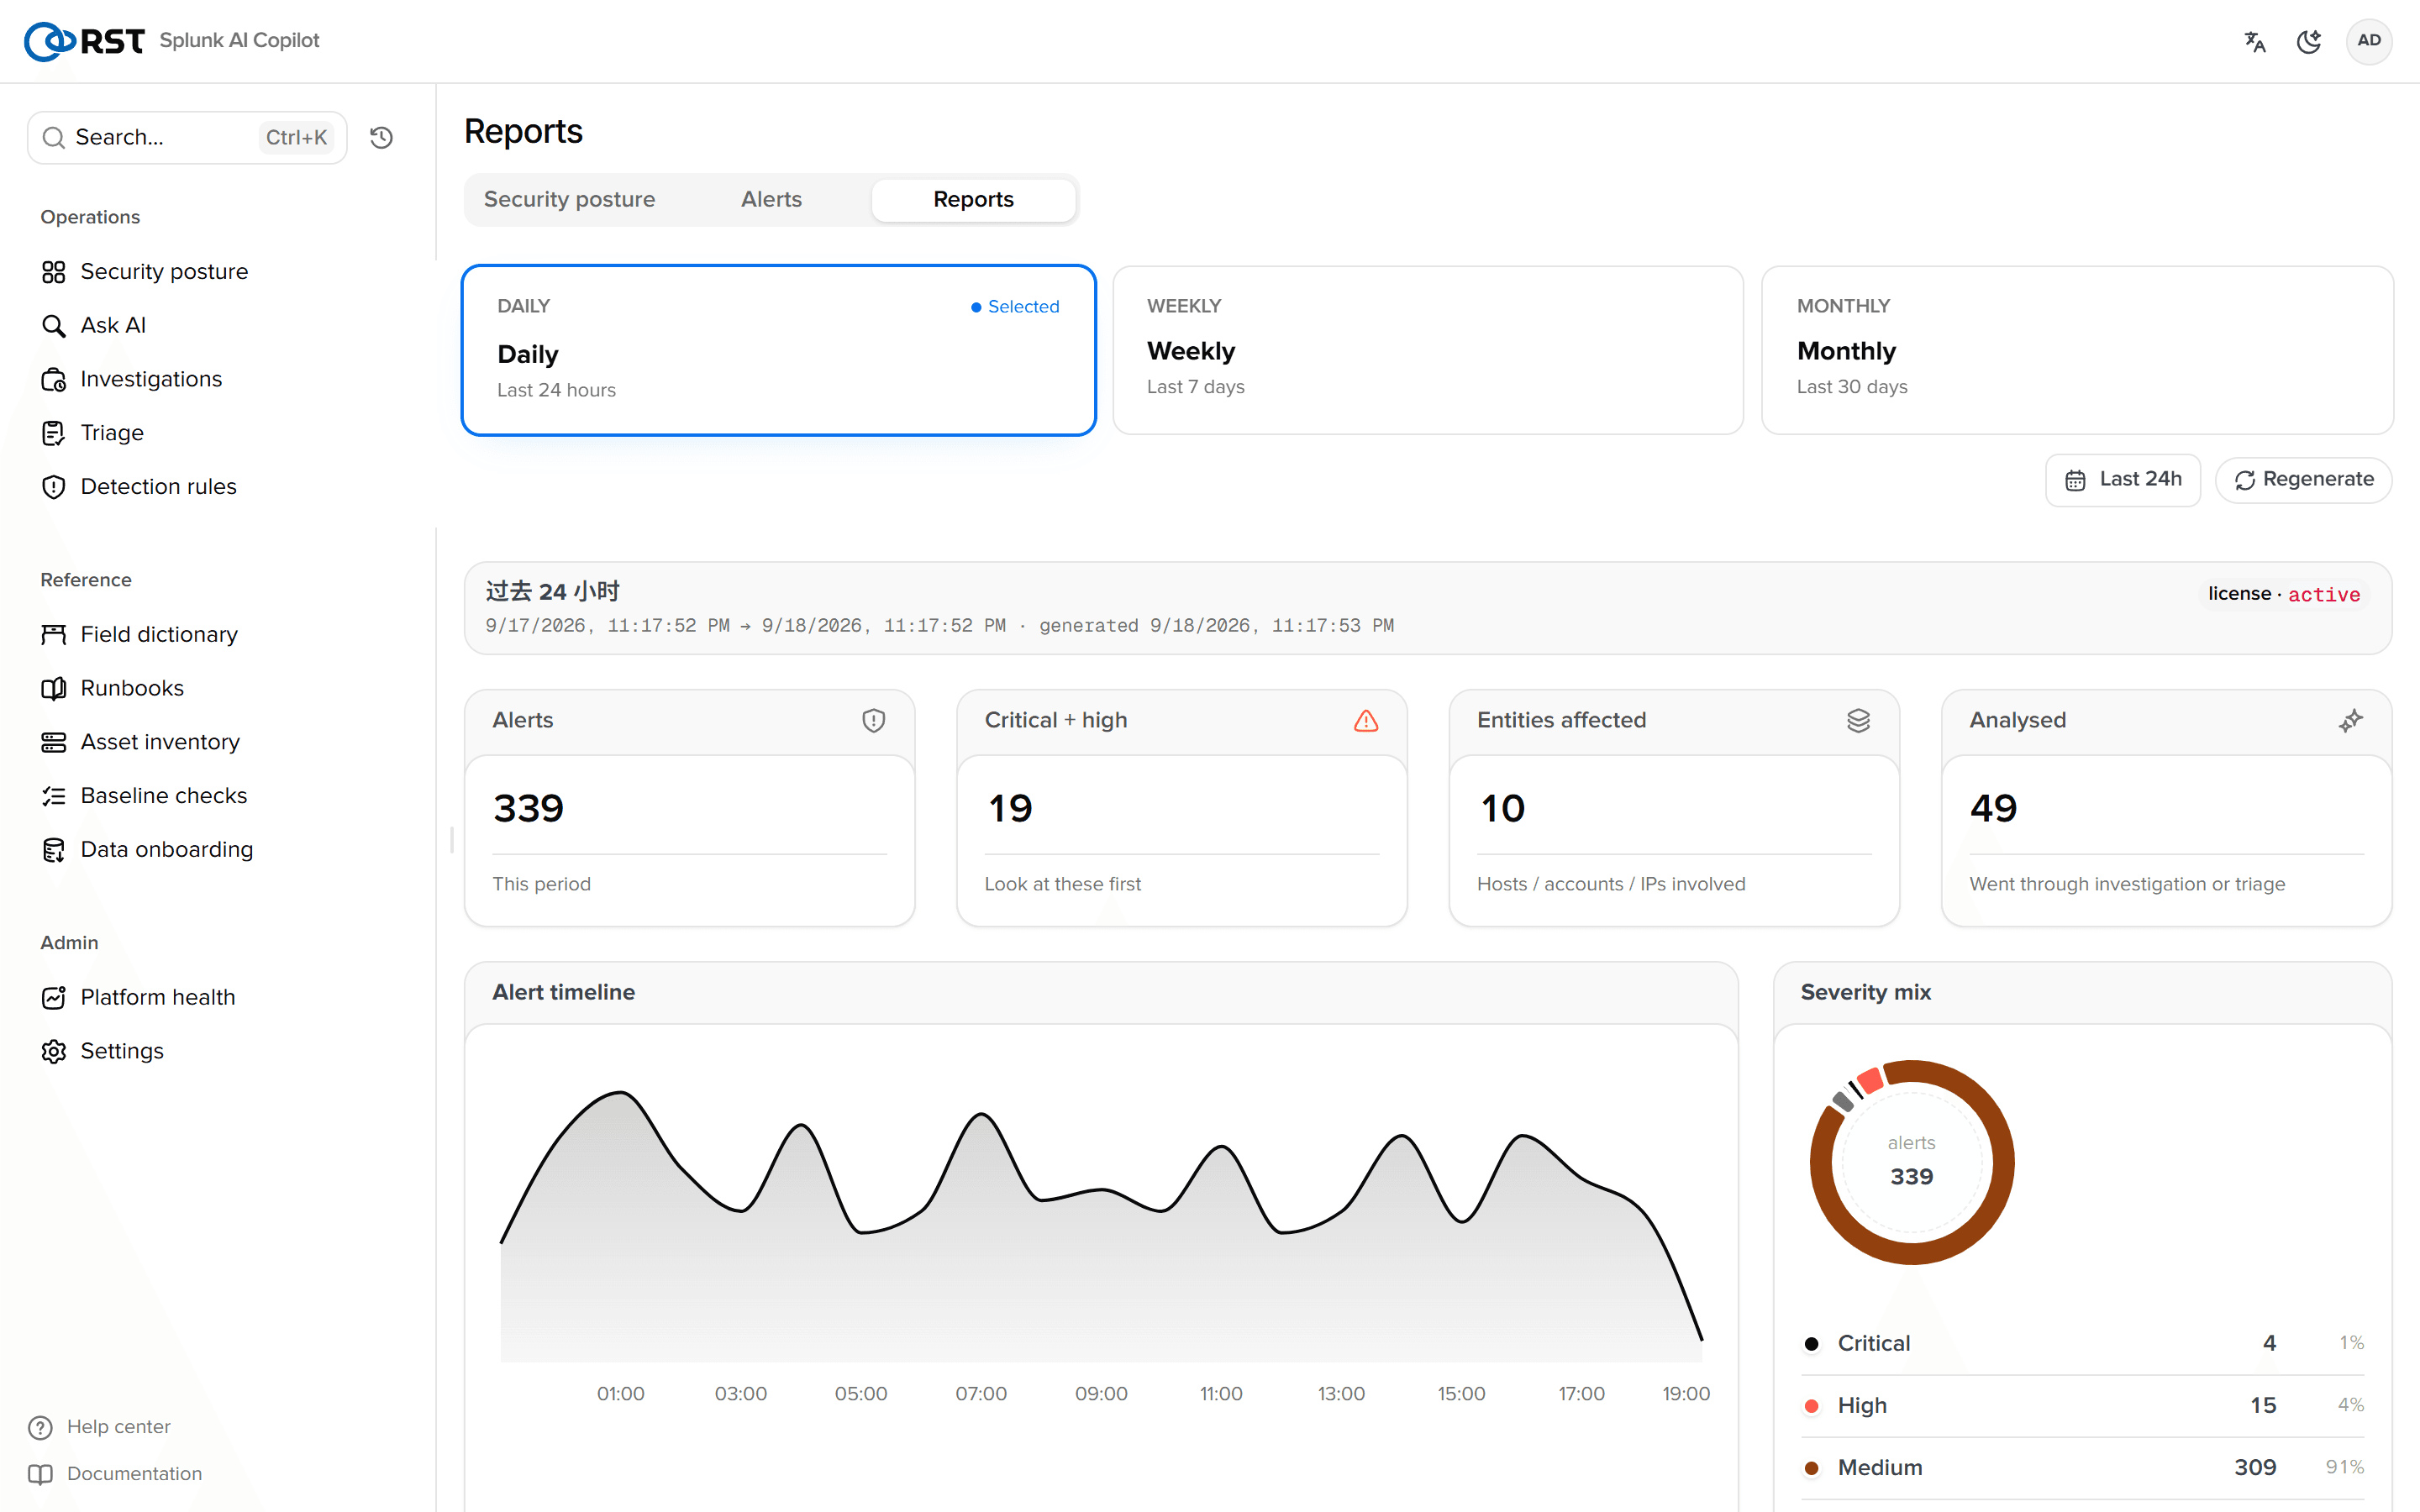
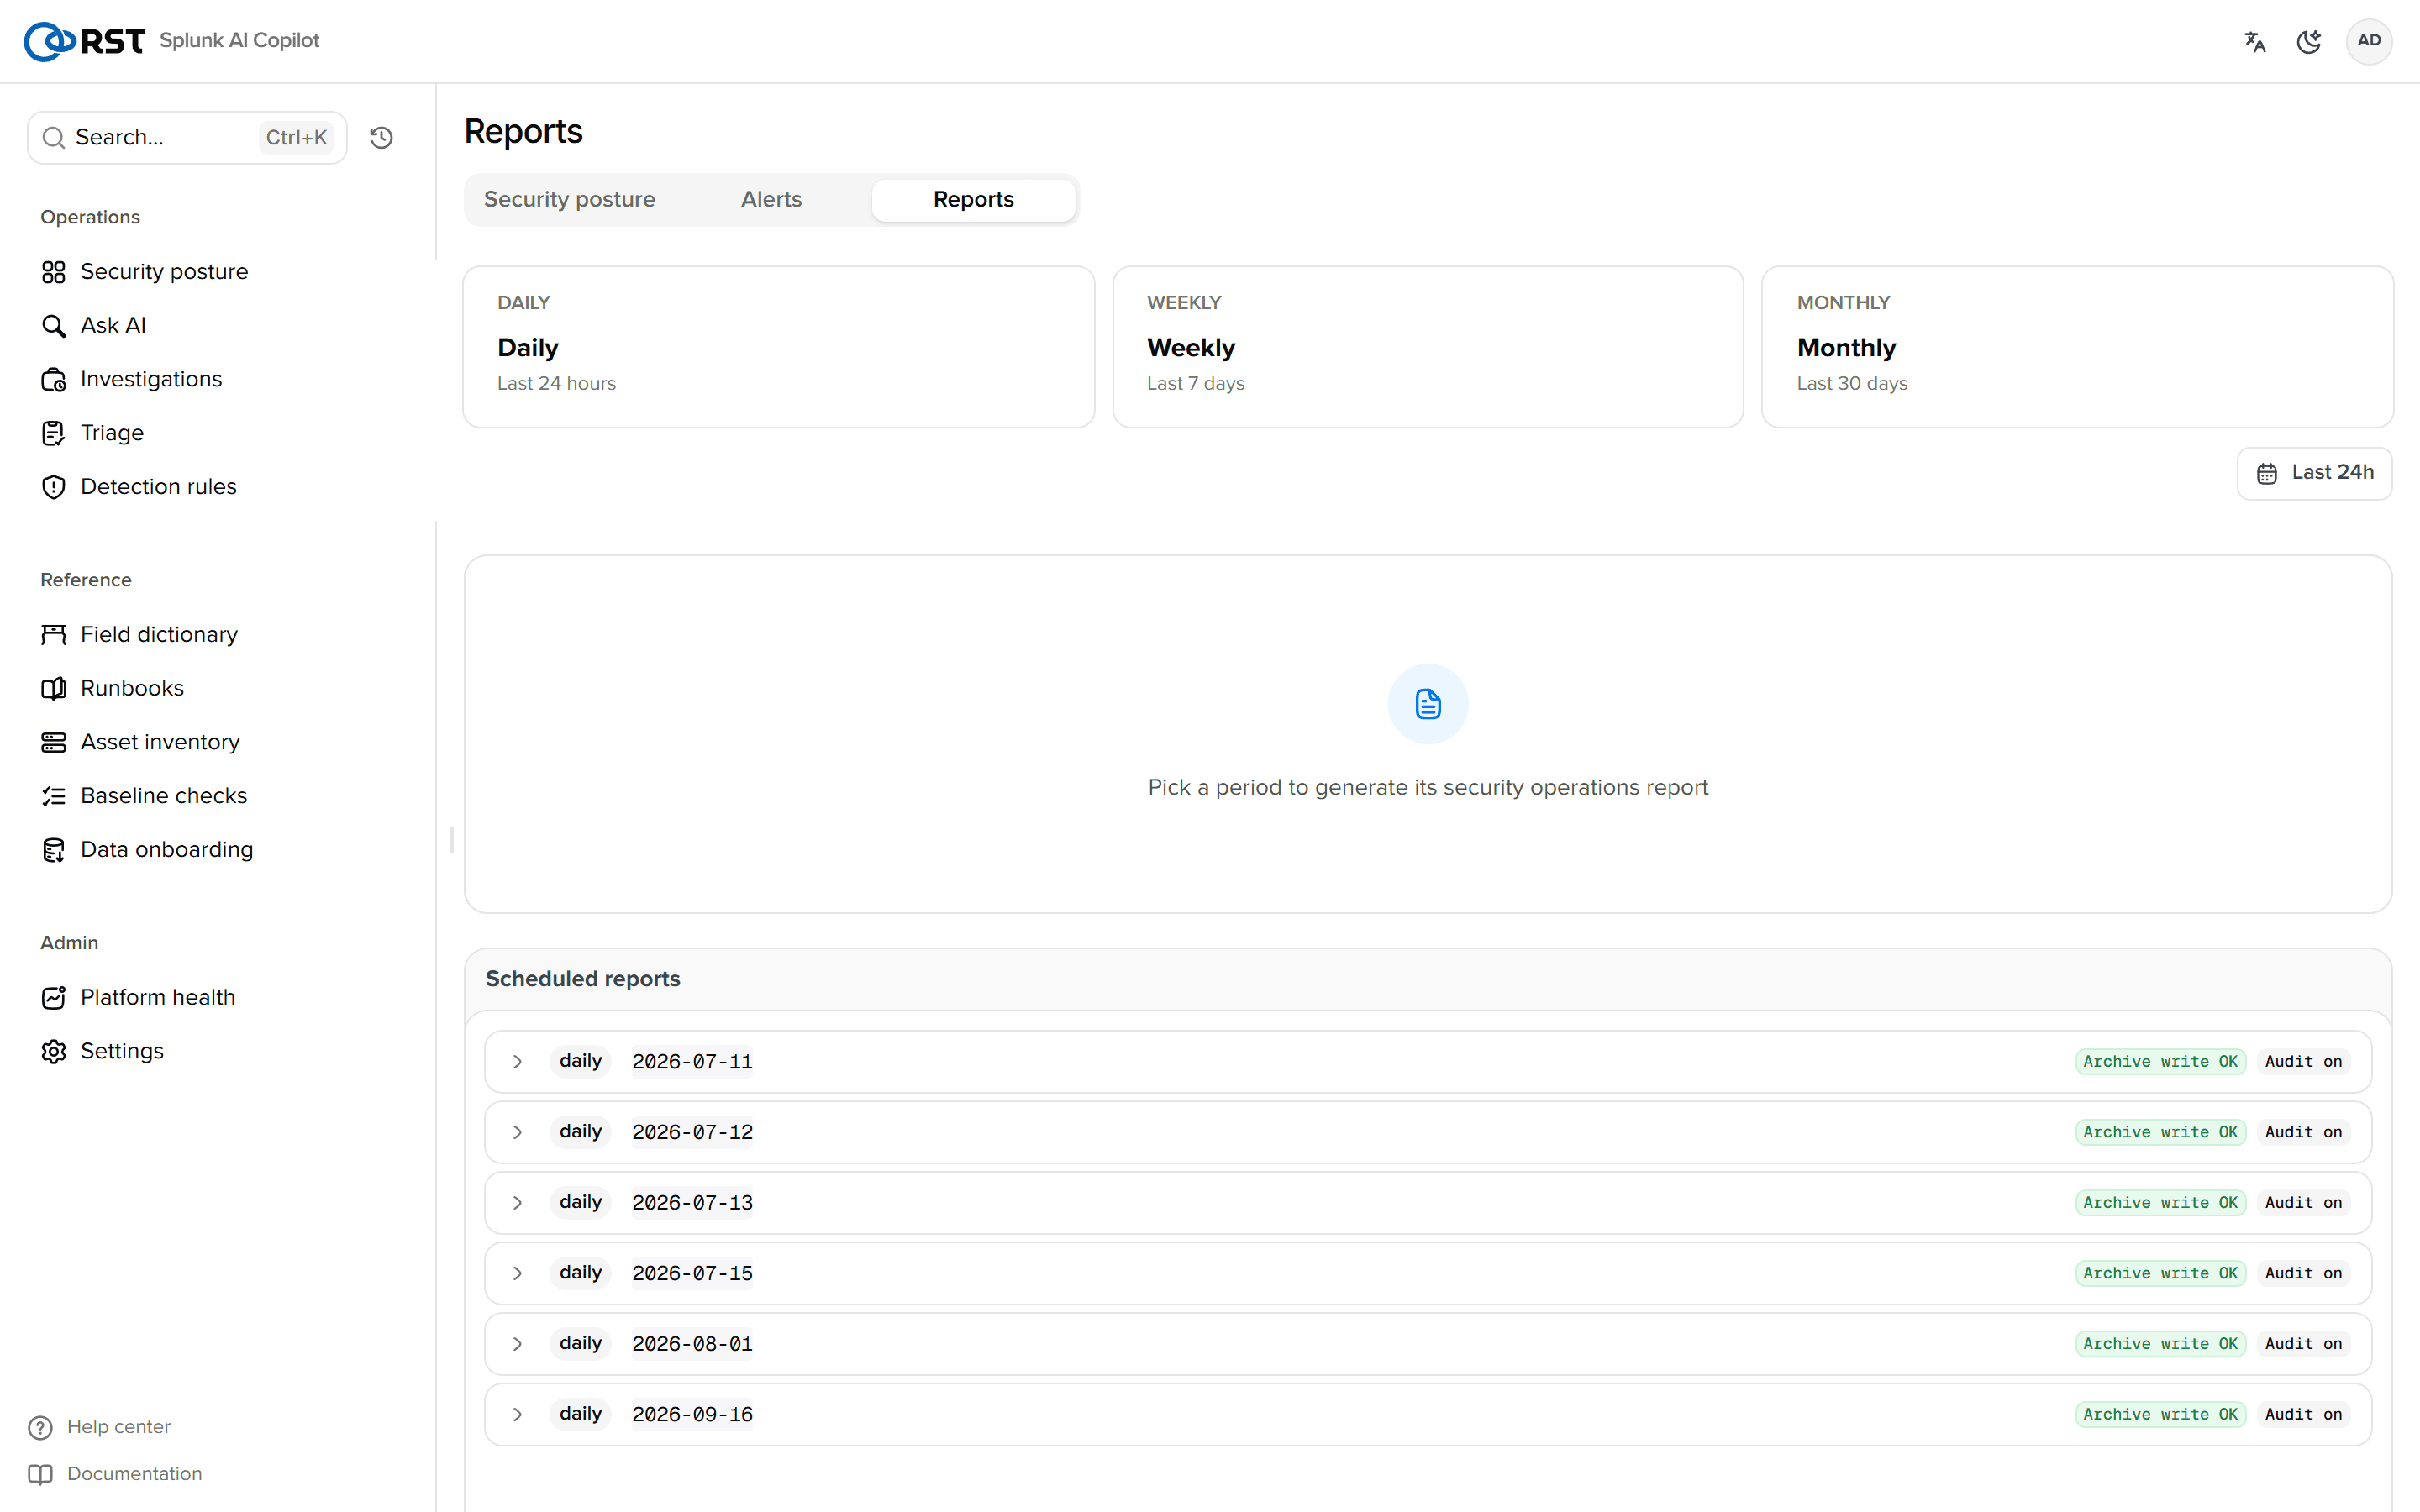
Generated reports join the archive (KV copilot_reports; custom ranges are not archived) for review, Markdown download and "Push to Feishu" (an alert card through Outbound channels). Scheduled generation is set under "Schedule" on the channels page (hour, time zone).
Incident report
After an investigation, "Generate incident report" produces a seven-section Markdown document (overview, blast radius, timeline, attack chain, evidence, recommended actions, open items) for download, push to a channel, or "Open ticket" as the ServiceNow / Jira body. The incident report itself needs no licence, but the investigation it draws on does.
Notes
- Time windows in report SPL are passed to Splunk as
%m/%d/%Y:%H:%M:%Sin the splunkd process time zone; a searching user with another zone sees an offset. - "Top indexes" counts only calls whose audit event recorded
index=.
Alerts
A polled feed of the alert index, handled one by one: explain, investigate (autonomous evidence gathering), escalate to triage, write back to the ES notable, open a ticket; reachable from Incident Review's row menu.
Platform health
An eight-point Splunk check-up with AI interpretation; the slow-search advisor: the most expensive searches from _audit, rewritten, verified by result count on real data, applied to the saved search.