

Platform health
An eight-point Splunk check-up with AI interpretation; the slow-search advisor: the most expensive searches from _audit, rewritten, verified by result count on real data, applied to the saved search.
Platform health is the first page of "Administration"; its tab family includes Audit log and Outbound channels, with a "Search performance" tab inside the page. The check-up is in every edition; interpretation is a paid capability.
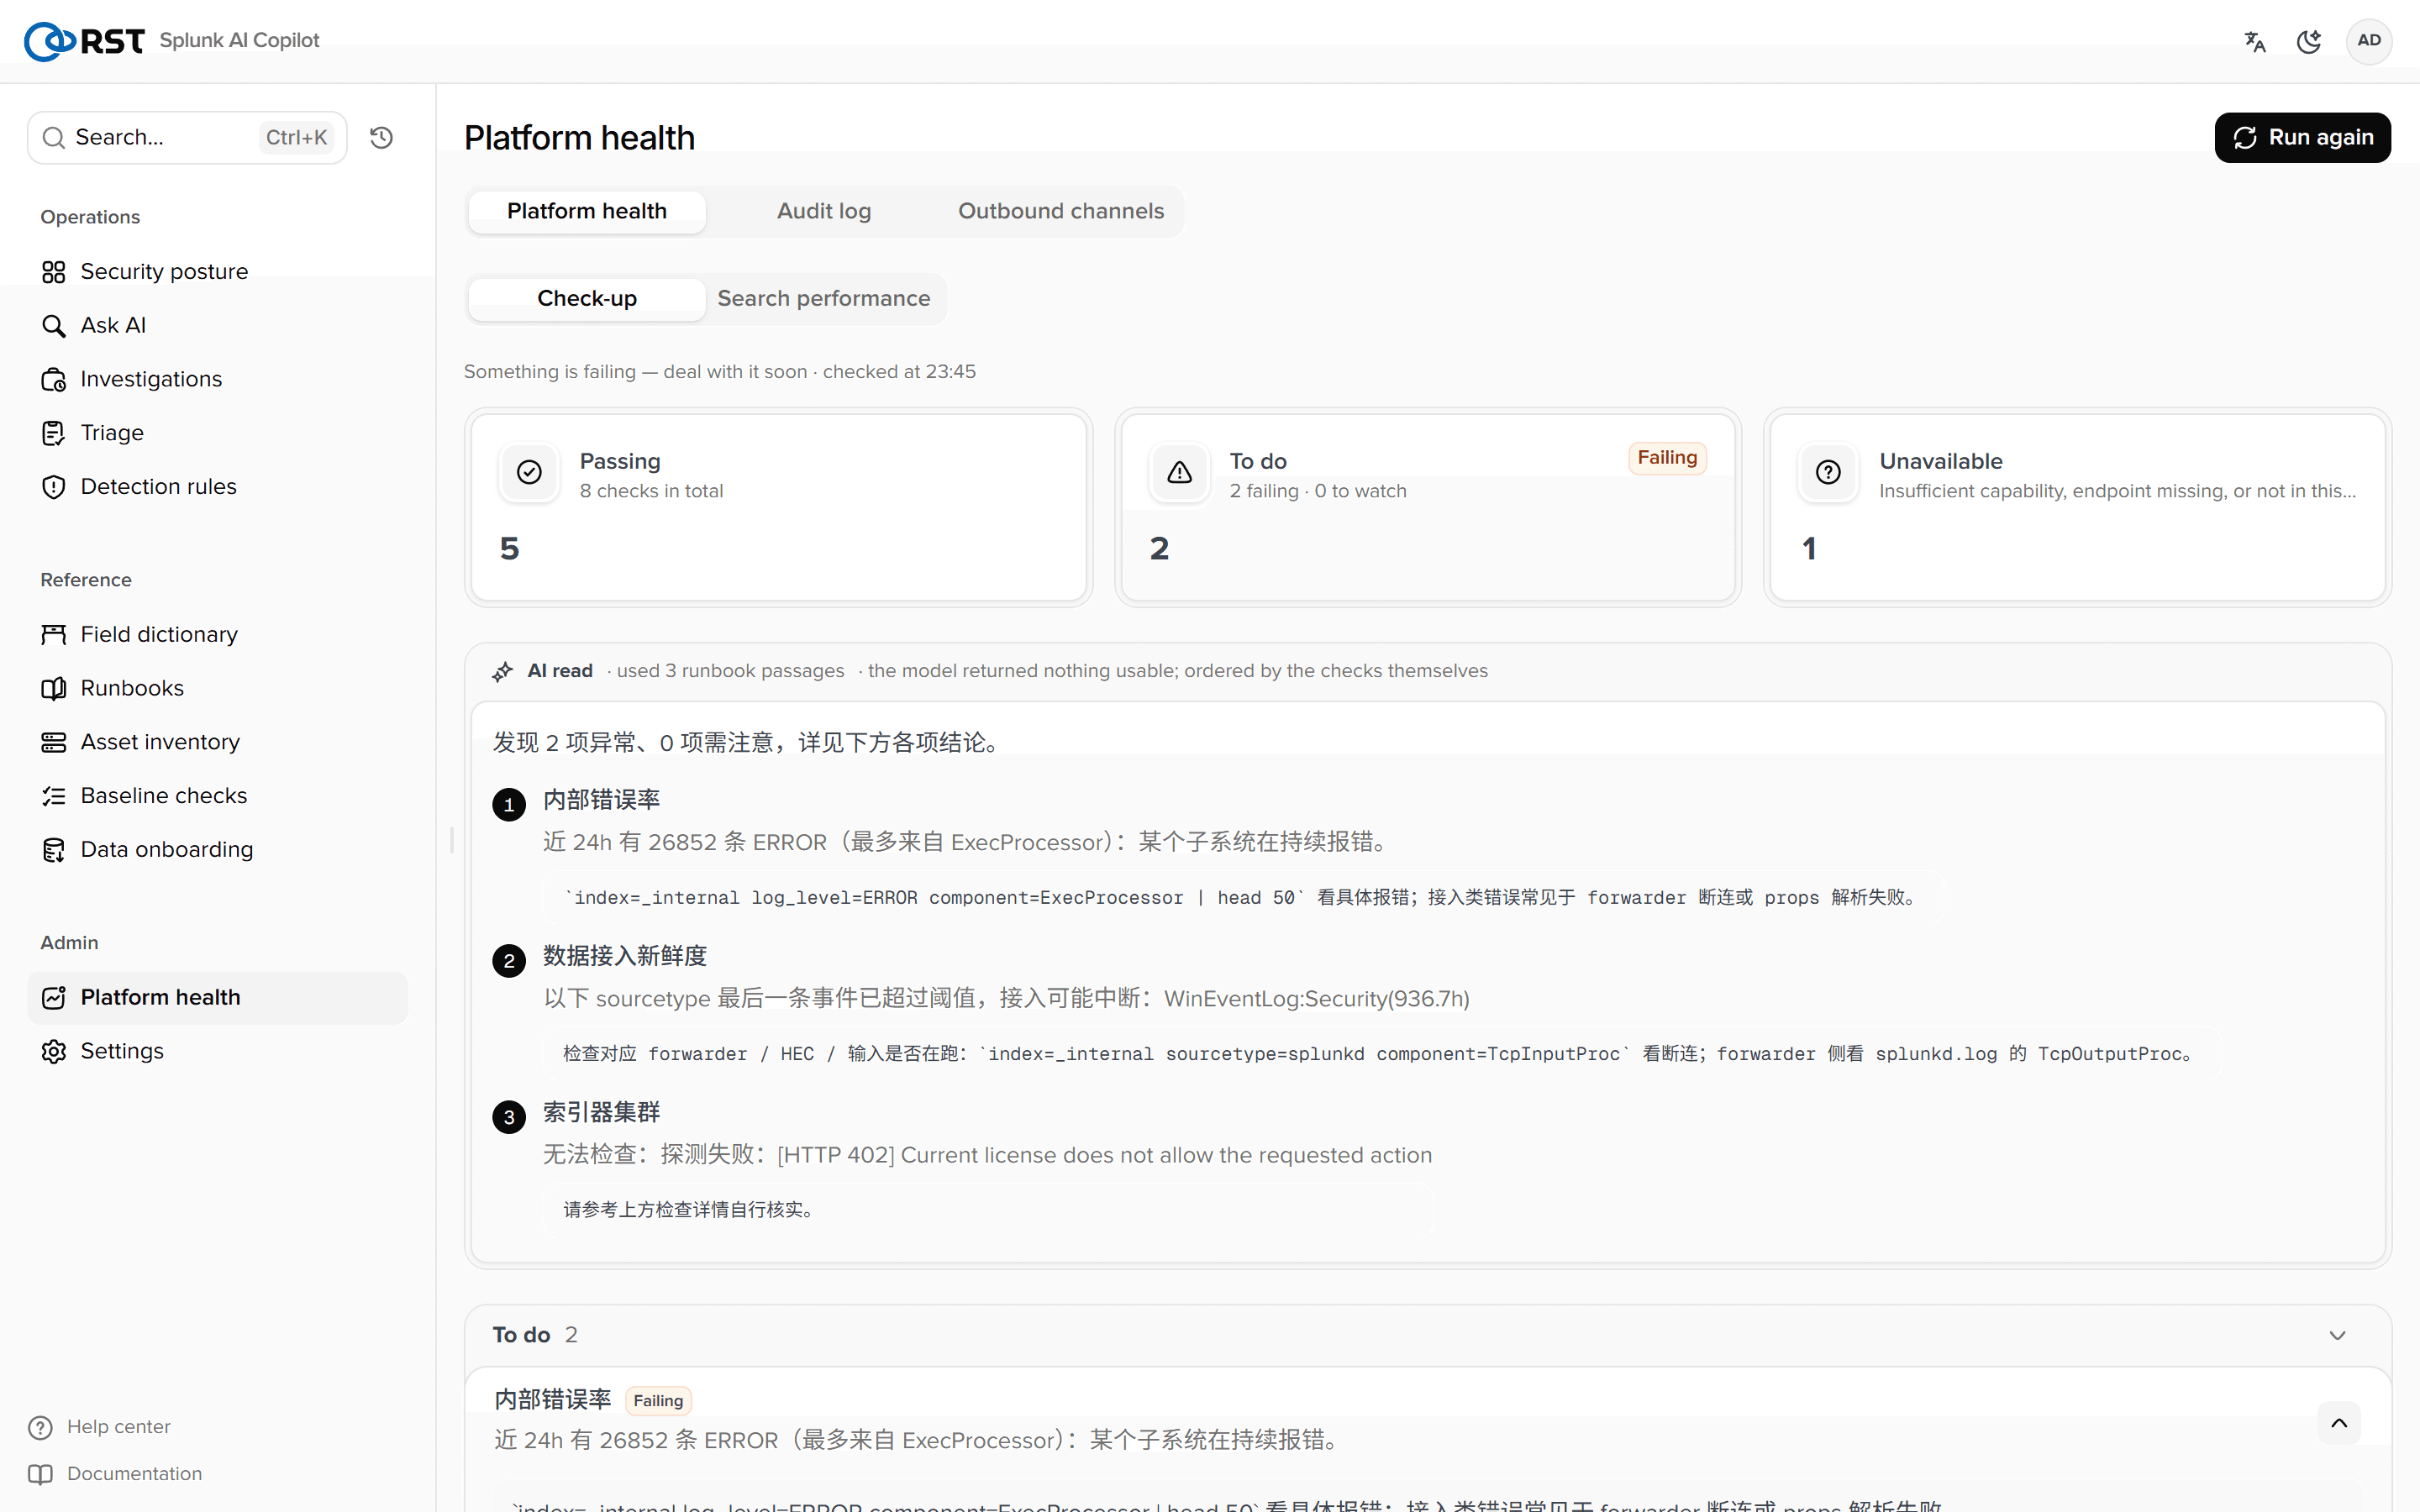
Check-up
Eight checks, each ok / warn / fail / unknown with summary, evidence and advice; thresholds in [platform]:
| Check | What | Source |
|---|---|---|
| splunkd health | Yellow / red features in the health tree and their reasons | /services/server/health/splunkd/details |
| Indexer cluster | Cluster state; a standalone instance is ok | /services/cluster/manager/info |
| Licence usage | Pool usage %, warning count (5 = fail) | /services/licenser/pools |
| Internal error rate | 24-hour log_level=ERROR by component | index=_internal |
| Scheduler skips | Skip ratio, most-skipped saved searches and reasons | index=_internal sourcetype=scheduler |
| KV store | Status | /services/kvstore/status |
| Ingest freshness | Age of each sourcetype's newest event (fewer than 100 events ignored) | | metadata type=sourcetypes |
| Clock baseline | Event time ahead of now (collector clock skew) | Same |
A user without read access to licenser / cluster sees those checks as unknown. Under a Splunk Free licence the cluster endpoint returns 402 and is unknown too.
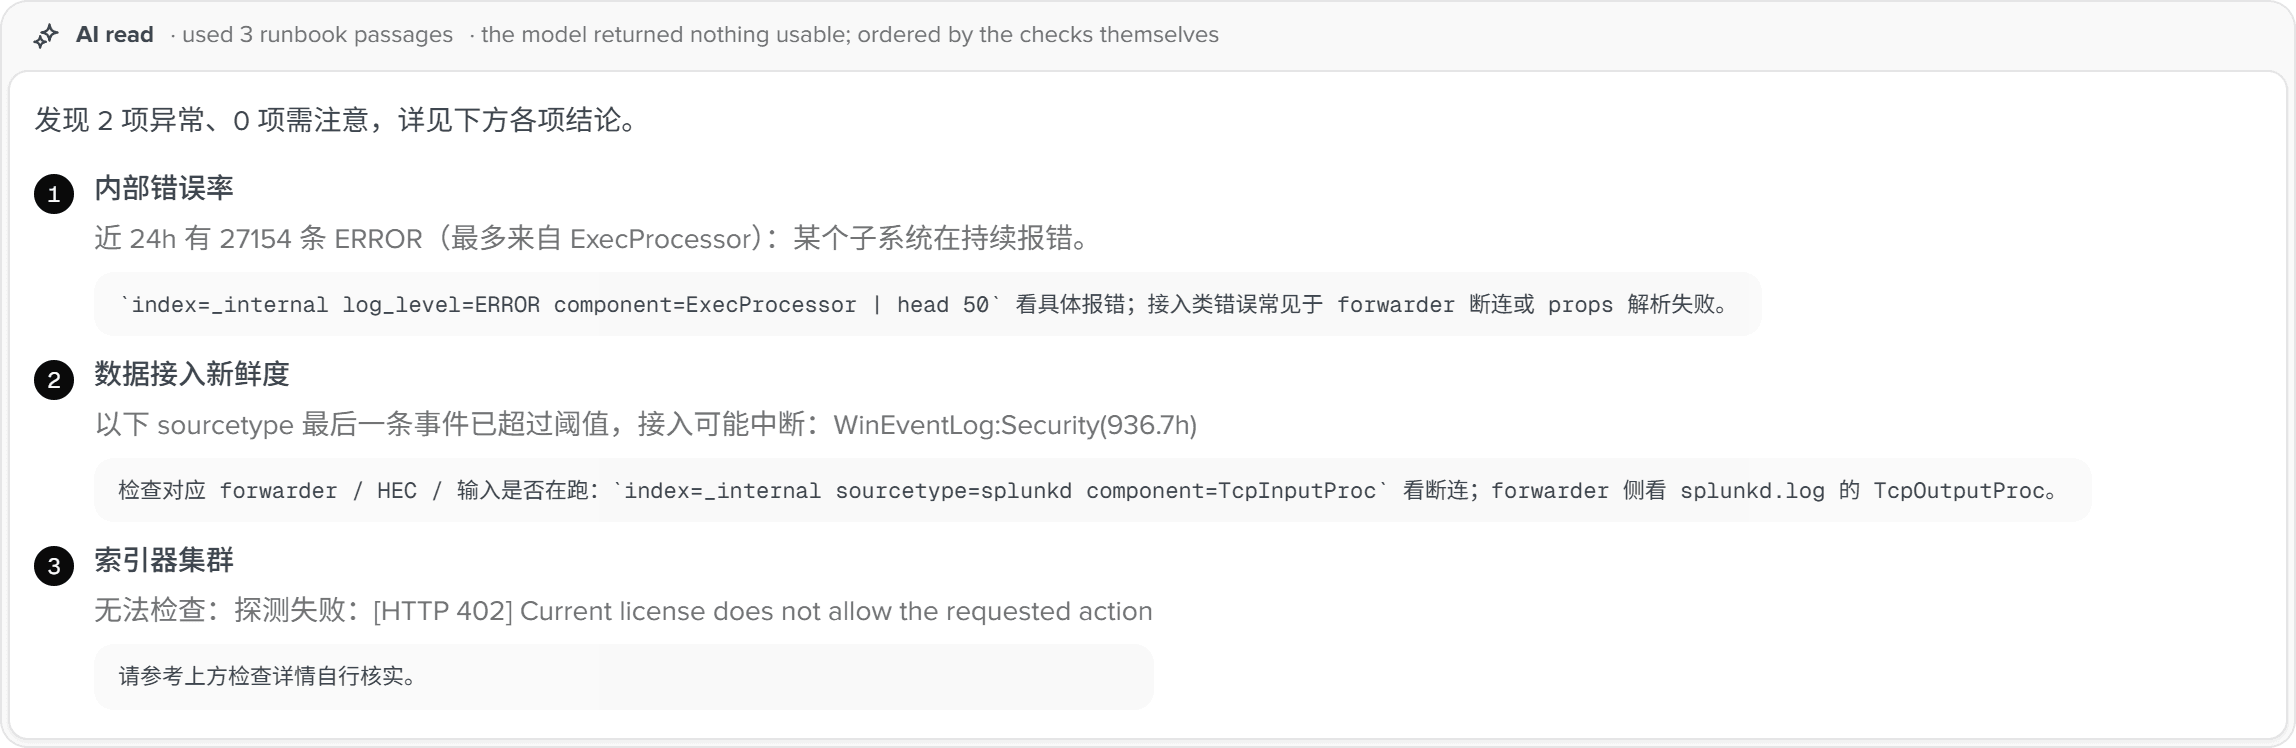
AI interpretation
"Interpret" hands the eight results to the model, which links related failures ("two log types stopped in the same second → upstream collection path") and returns a conclusion plus actions[{title, why, how}] where how is read-only SPL. Matching runbooks from the knowledge base enter the prompt. 25–32 s on the 1.9.0 test box.
Search performance (1.8.0+)
The "Search performance" tab pulls the last 7 days of completed searches from _audit (action=search info=completed), excludes this app's own, DMC housekeeping and splunk-system-user, and ranks the Top 20 by total run time:
| Column | Notes |
|---|---|
| Search | SPL fragment |
| Runs / total time | Over 7 days |
| Scan efficiency | event_count / scan_count; lower is more wasteful |
| Source | Which saved search (required before a rewrite can be applied) |
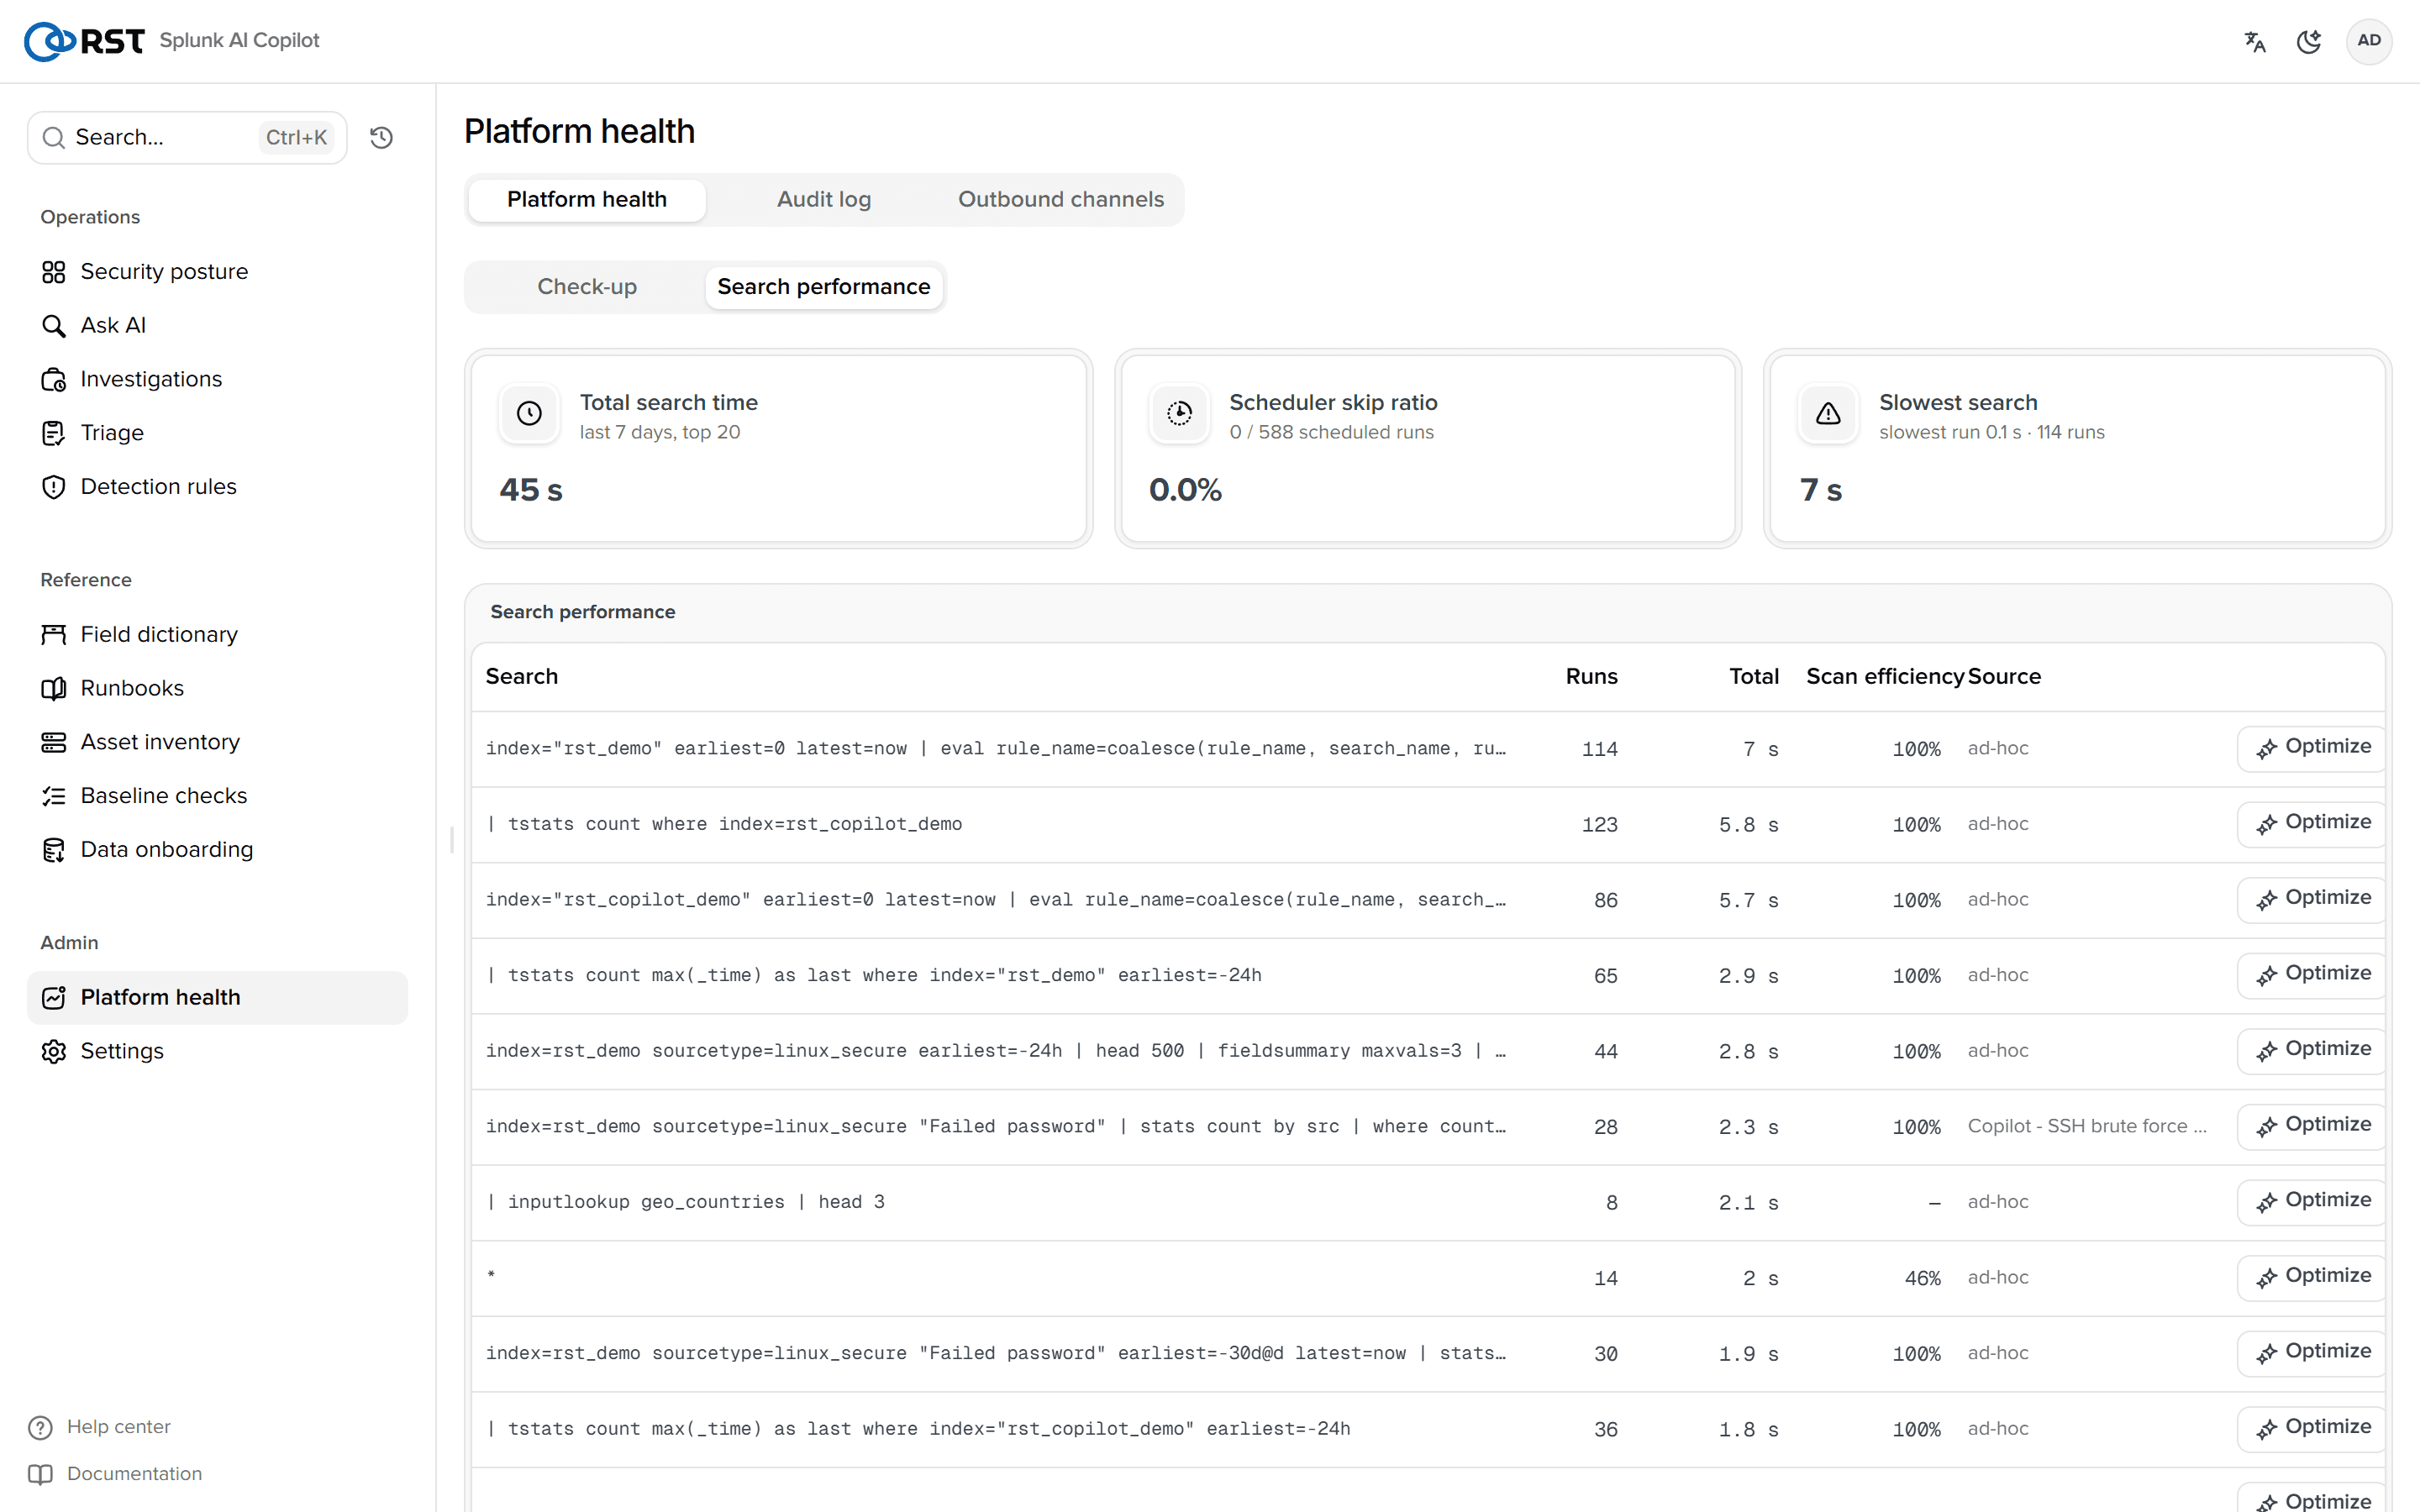
"Optimize" on a row: the model returns optimized_spl / expected_gain / why / risk; both SPLs are syntax-checked with | head 0 and compared with | stats count ([spl_advisor] verify_window, default -24h), and verified states whether the counts match. Typical rewrite: index=* | stats count by host → index=rst_demo | fields host | stats count by host.

"Apply to saved search" (admin) replaces its search field after a KV backup (copilot_state kind advisor_backup); "Revert" on the row restores it. Only searches applied from this page have a backup; anything else returns advisor_no_backup. The 2^64-scale total_run_time that _audit writes for cancelled or zombie jobs is filtered out.
Reports
Daily / weekly / monthly SOC operations summaries, a seven-section incident report, archive, Markdown export, push to Feishu or open a ticket.
Audit log
One metadata event per AI call: who, which action, which index, how long, outcome, tokens. A server-aggregated dashboard, thumbs-down review, usage and budget.