

Alerts
A polled feed of the alert index, handled one by one: explain, investigate (autonomous evidence gathering), escalate to triage, write back to the ES notable, open a ticket; reachable from Incident Review's row menu.
Where alerts come from

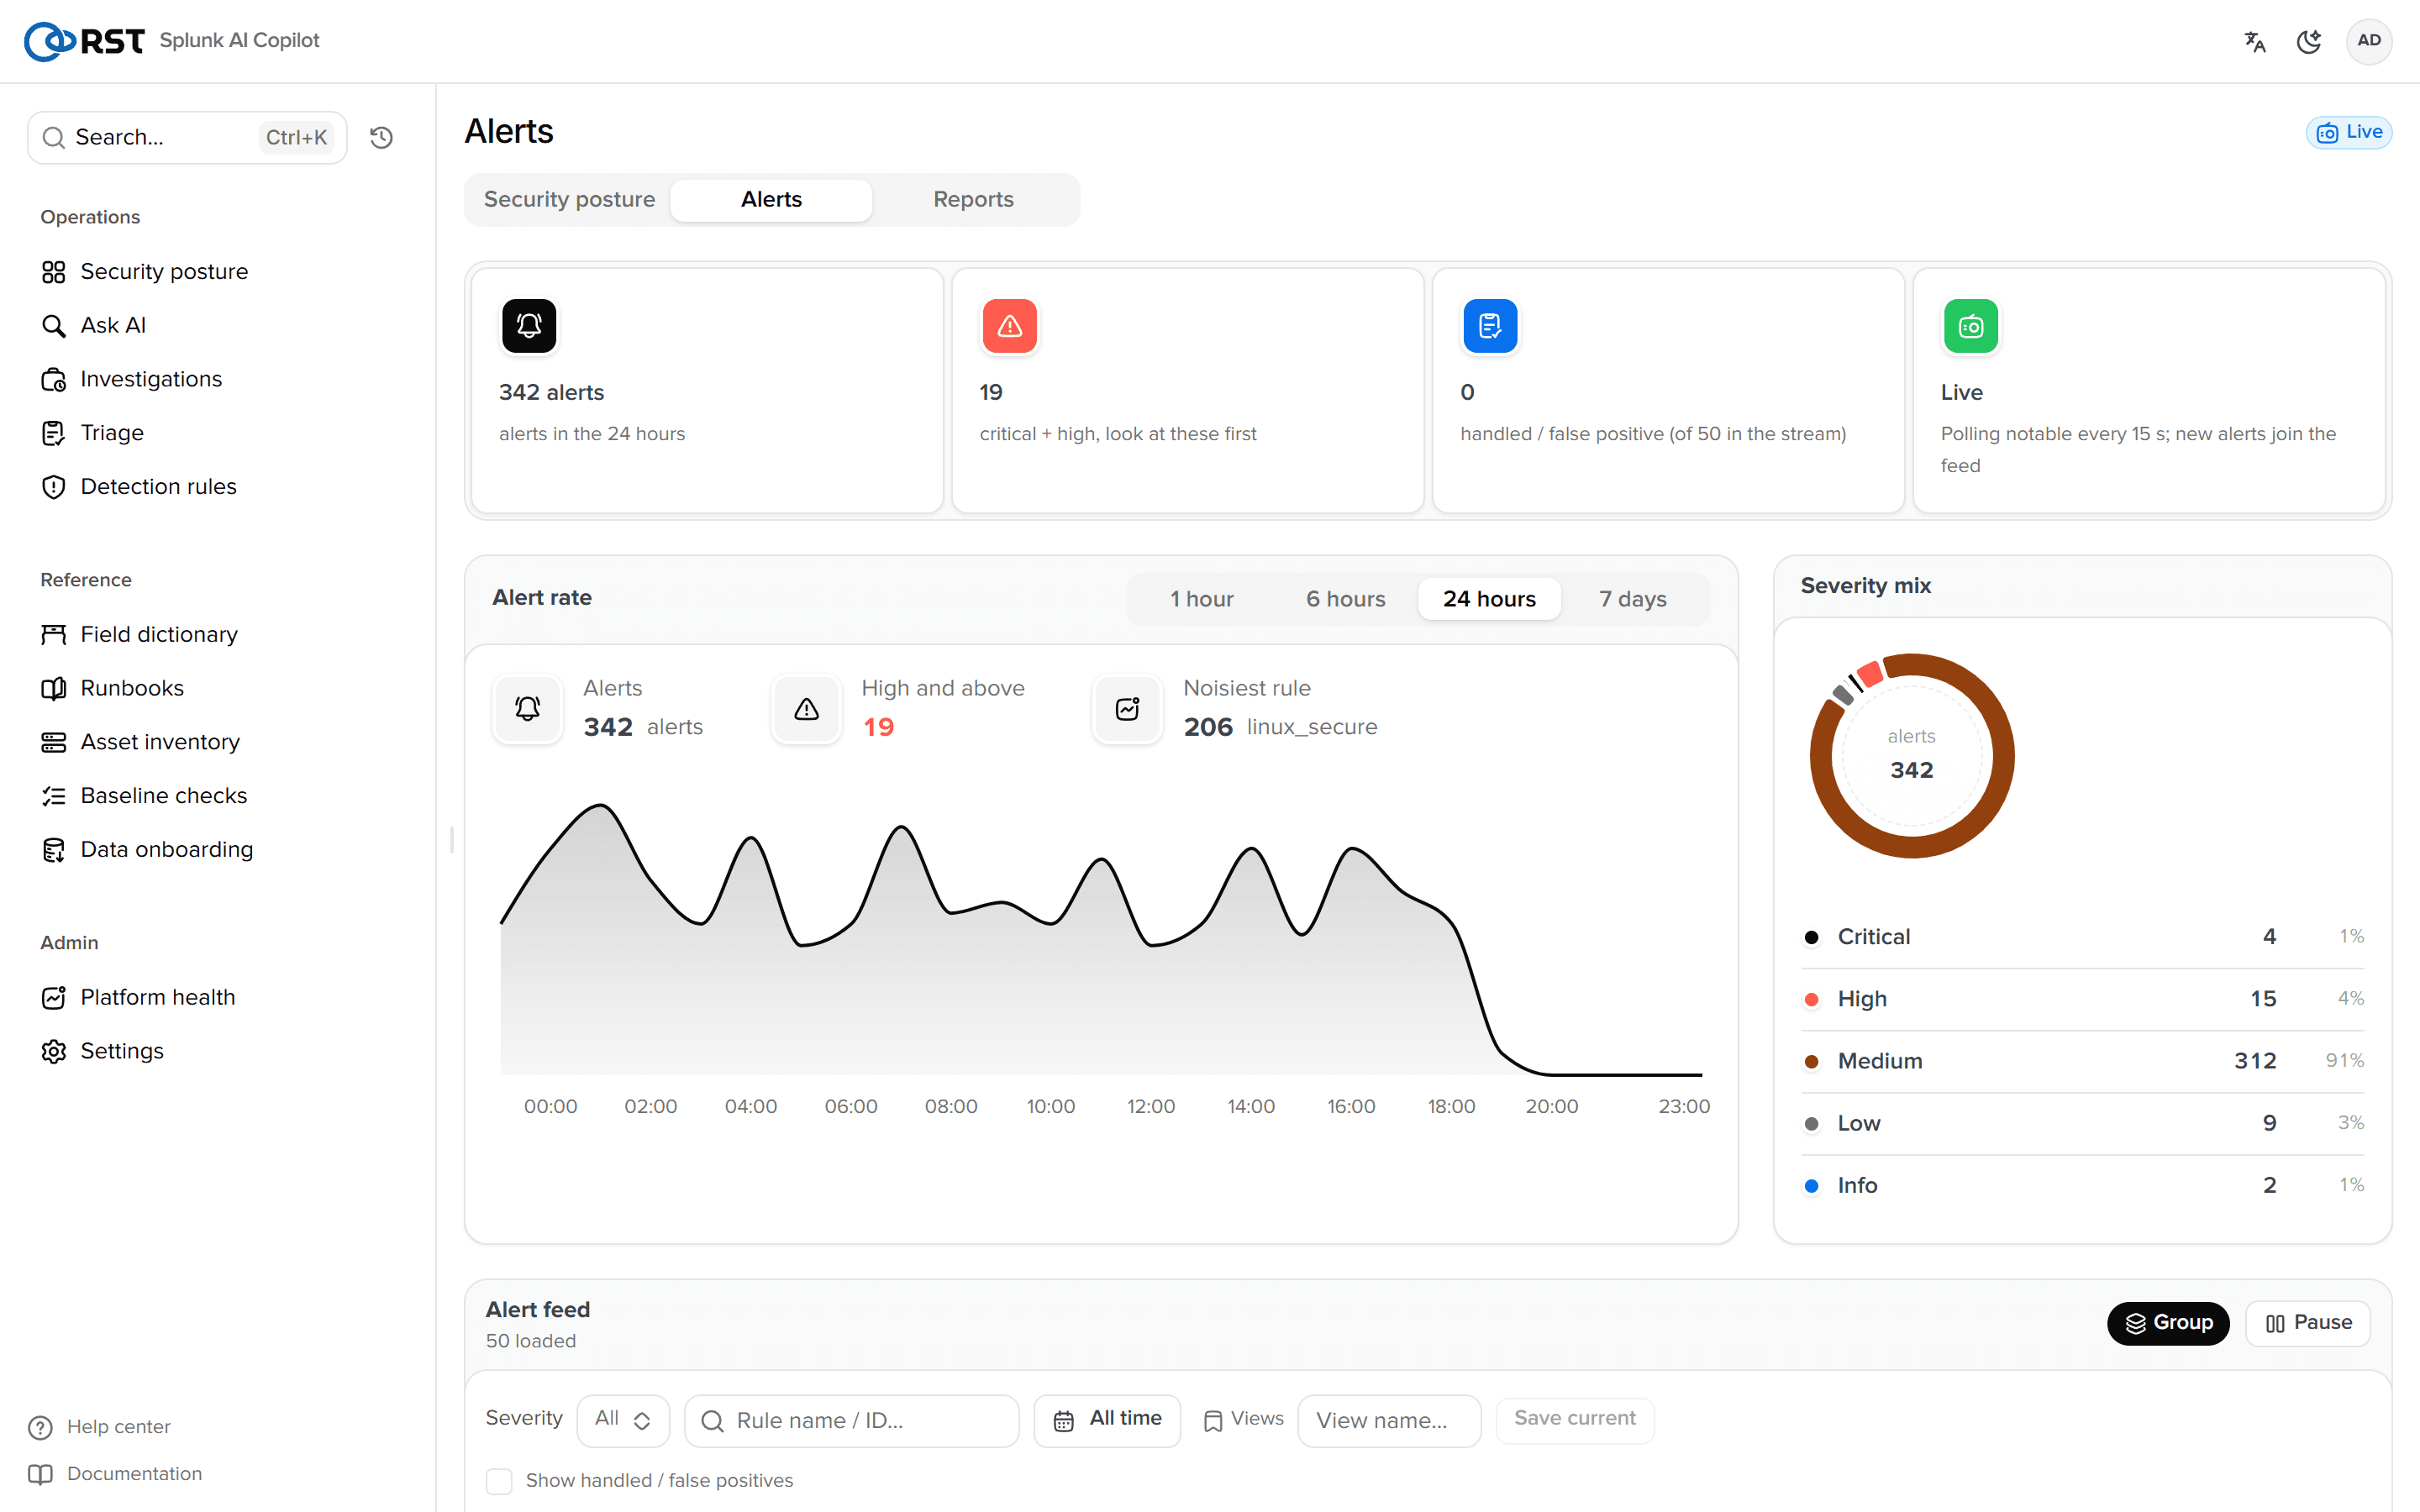
The page polls the alert index (default notable) every 15 seconds, deduplicates by cursor and puts new alerts on top. Splunk's REST handlers cannot stream, so polling stands in. "Ingest status" at the top shows whether the index exists, the 24-hour count, the newest timestamp, how many rules carry the copilot_autotriage alert action, and the latest auto-triage batches.
| Source | Notes |
|---|---|
| ES notables | index=notable with rule_name / urgency / status / owner |
| Any index | Change the alert index at the top; default field mapping in Security posture |
| Alert action | Any saved search with the copilot_autotriage action triages its results automatically |
List
Filter by severity / rule / time; each row shows severity, rule, subject (the main one of dest / src / user / host), time, ES status and owner where ES exists. "Open in Splunk Search" looks the raw event up by event_id.
Handling
| Action | What | Tier |
|---|---|---|
| Explain | The model explains the alert's raw event | viewer |
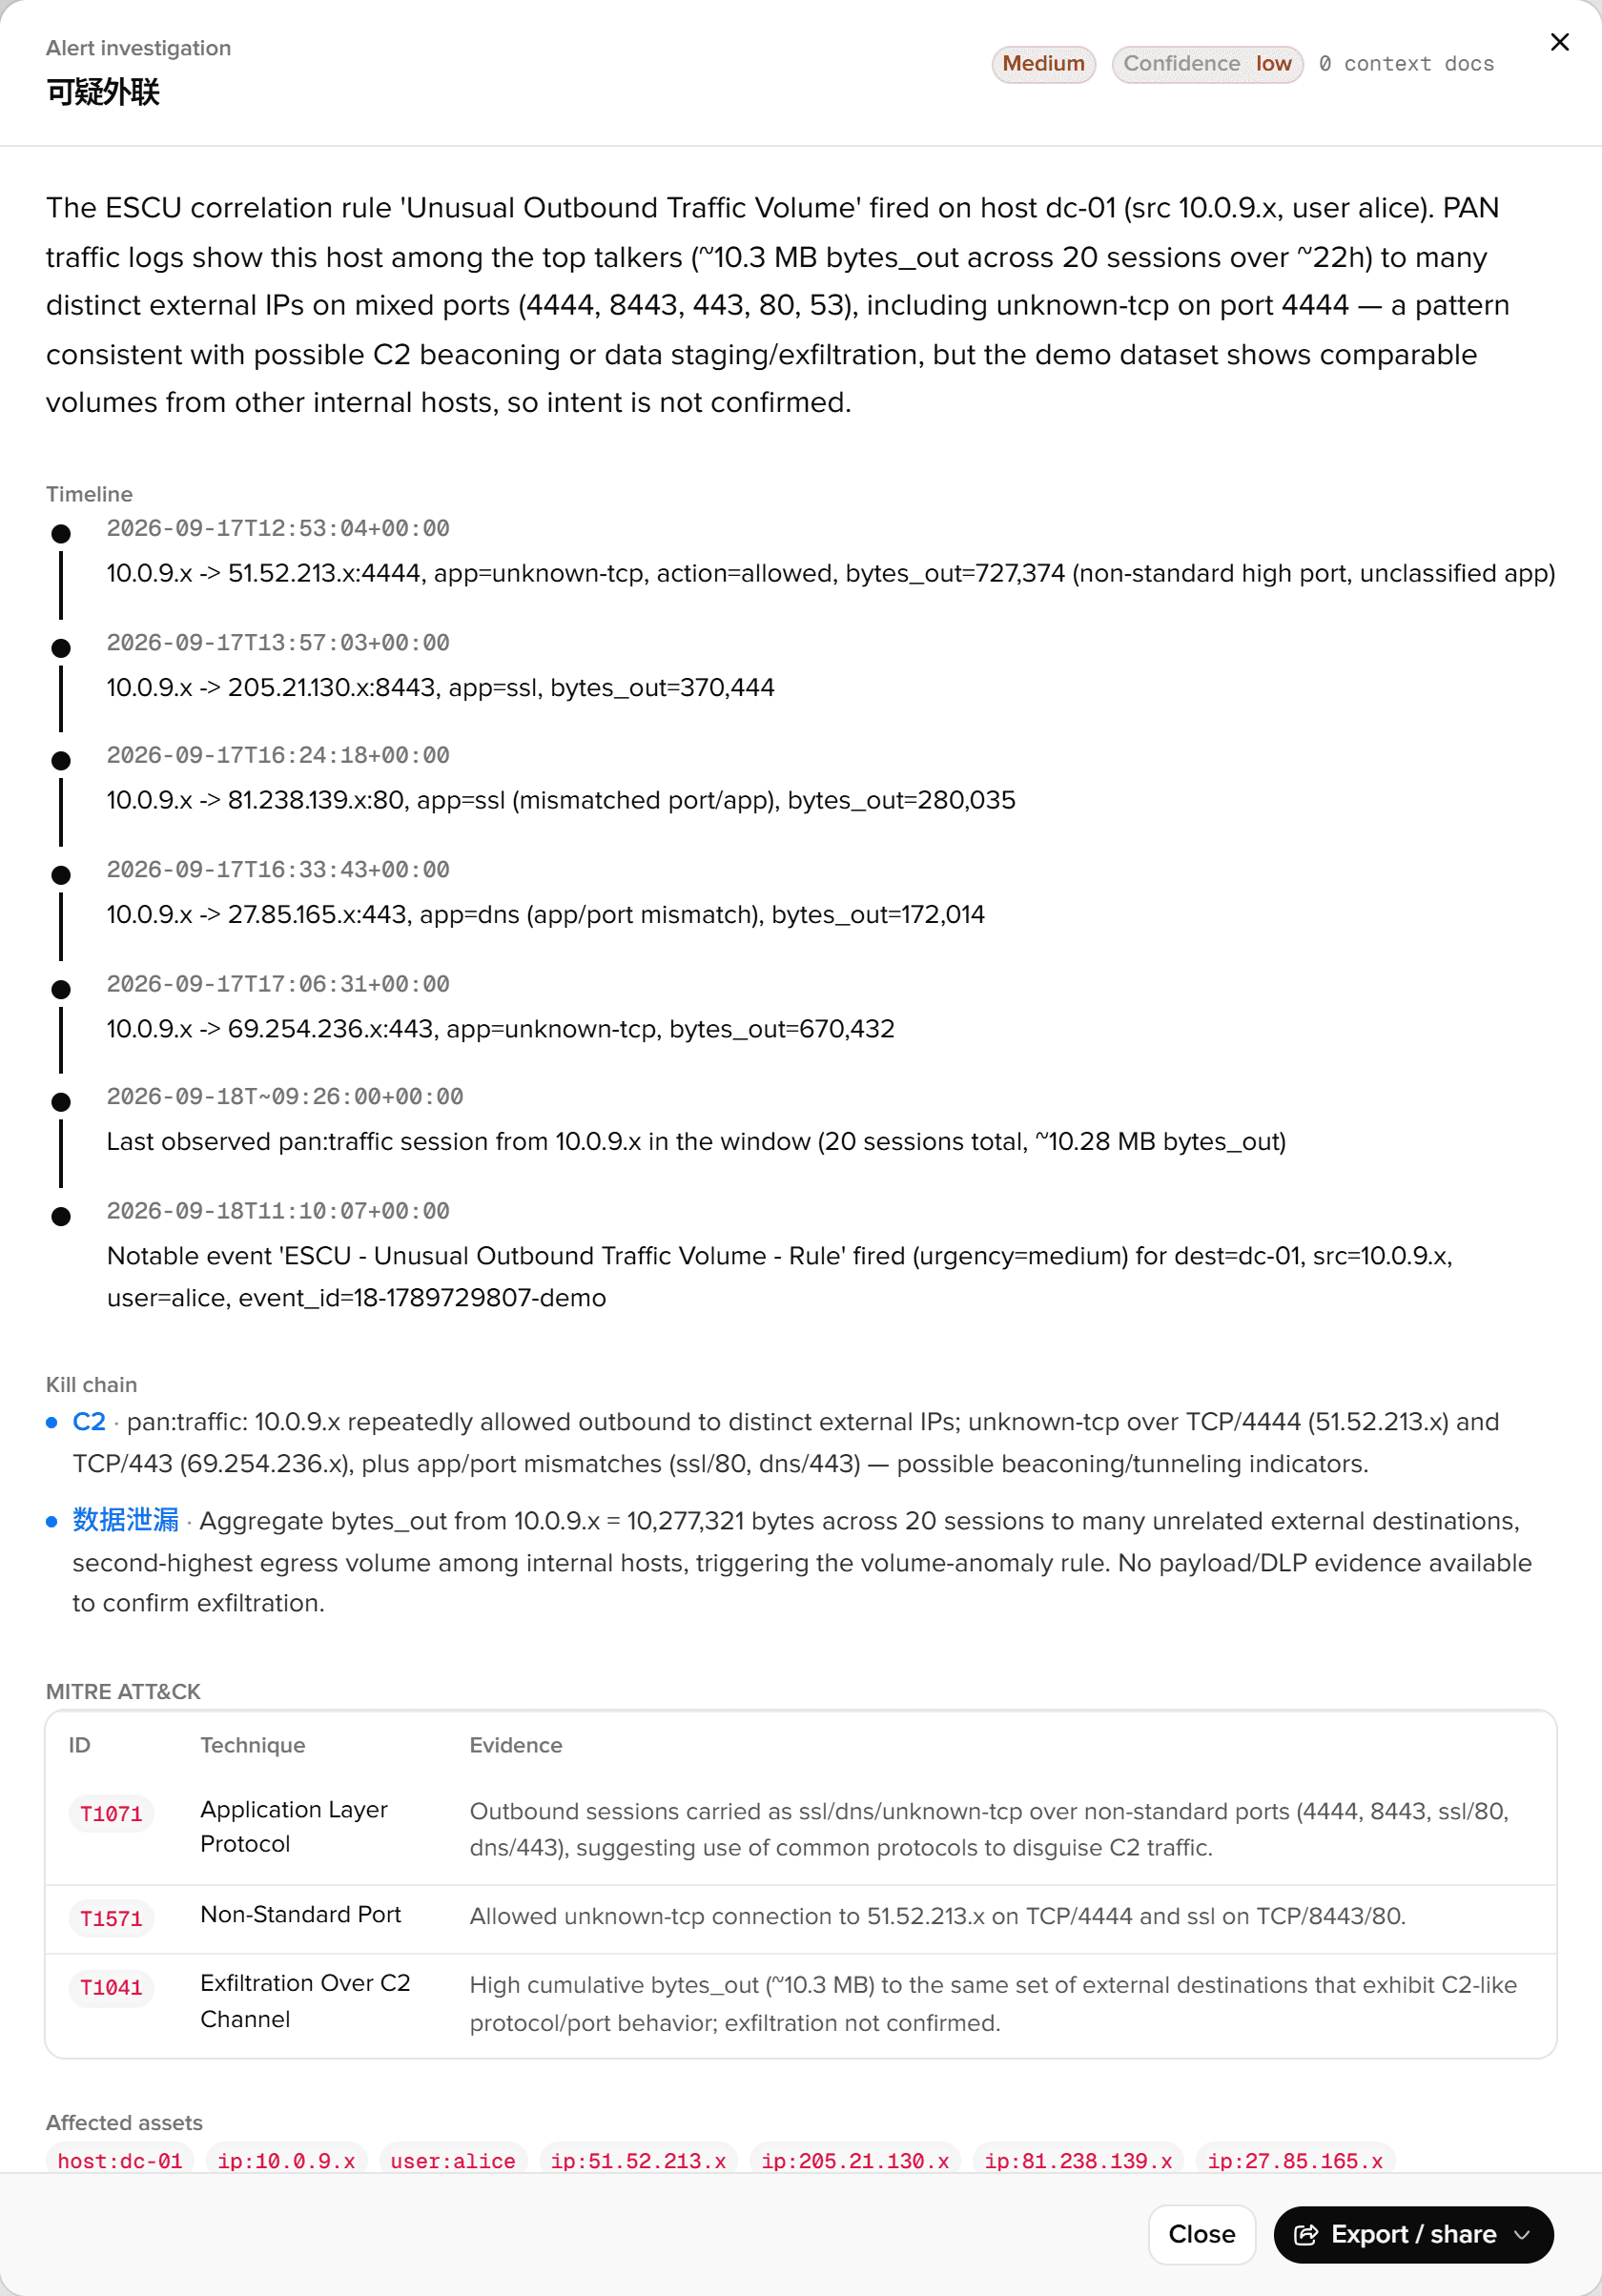
| Investigate | Opens a dialog; the agentic engine gathers evidence on its own (run_spl for surrounding activity, lookup_asset for asset context, search_kb for runbooks) and returns summary, timeline, MITRE attack chain, affected assets, false-positive verdict, recommended actions. 51–58 s and 9–10 tool calls on the 1.9.0 test box | analyst |
| Escalate to triage | Hands the alert to Triage | analyst |
| Write back to ES | Puts the verdict on the notable: status (New / In Progress / Resolved / Closed), urgency, comment (pre-filled with the conclusion), owner | analyst |
| Open ticket | Opens a ServiceNow / Jira ticket with the investigation report as body; the key is stored on the record | analyst |
| Turn into a detection rule | Carries the conditions to Detection rules | analyst |
Enterprise Security integration
From Incident Review: the app ships workflow_actions.conf, so every notable's row menu in ES → Incident Review offers "Investigate with Copilot". It opens this page in a new tab with the investigation dialog already up (URL carries ?investigate=<event_id>).
Write-back: "Write back to ES" at the bottom of the dialog calls ES notable_update (ruleUIDs + status + urgency + comment + newOwner). In Triage, "Write back to ES (cluster)" on a cluster row writes the whole cluster's alert ids at once. Without ES the buttons are hidden and the endpoint returns es_not_installed. The user needs ess_analyst or above in ES.

Notifications
A verdict can be "sent to channels" (Feishu / DingTalk / WeCom / Slack / Teams / email / webhook, see Outbound channels), routed by severity to the targets whose threshold it meets.
Security posture
The first look of a shift: four stat cards, an alert timeline, two Top 10s, the recent-alert queue. One aggregation search over the alert index.
Reports
Daily / weekly / monthly SOC operations summaries, a seven-section incident report, archive, Markdown export, push to Feishu or open a ticket.