

Outbound channels
Nine channel types (Feishu, DingTalk, WeCom, Slack, Teams, email, webhook…) routed by severity, delivery records with retry, report schedule; ticketing (ServiceNow / Jira) configuration.
Outbound channels govern how things leave the product: investigation verdicts, operations reports, budget alerts, baseline failures, routed by severity to the targets whose threshold they meet. Admins configure; analysts can test-send.
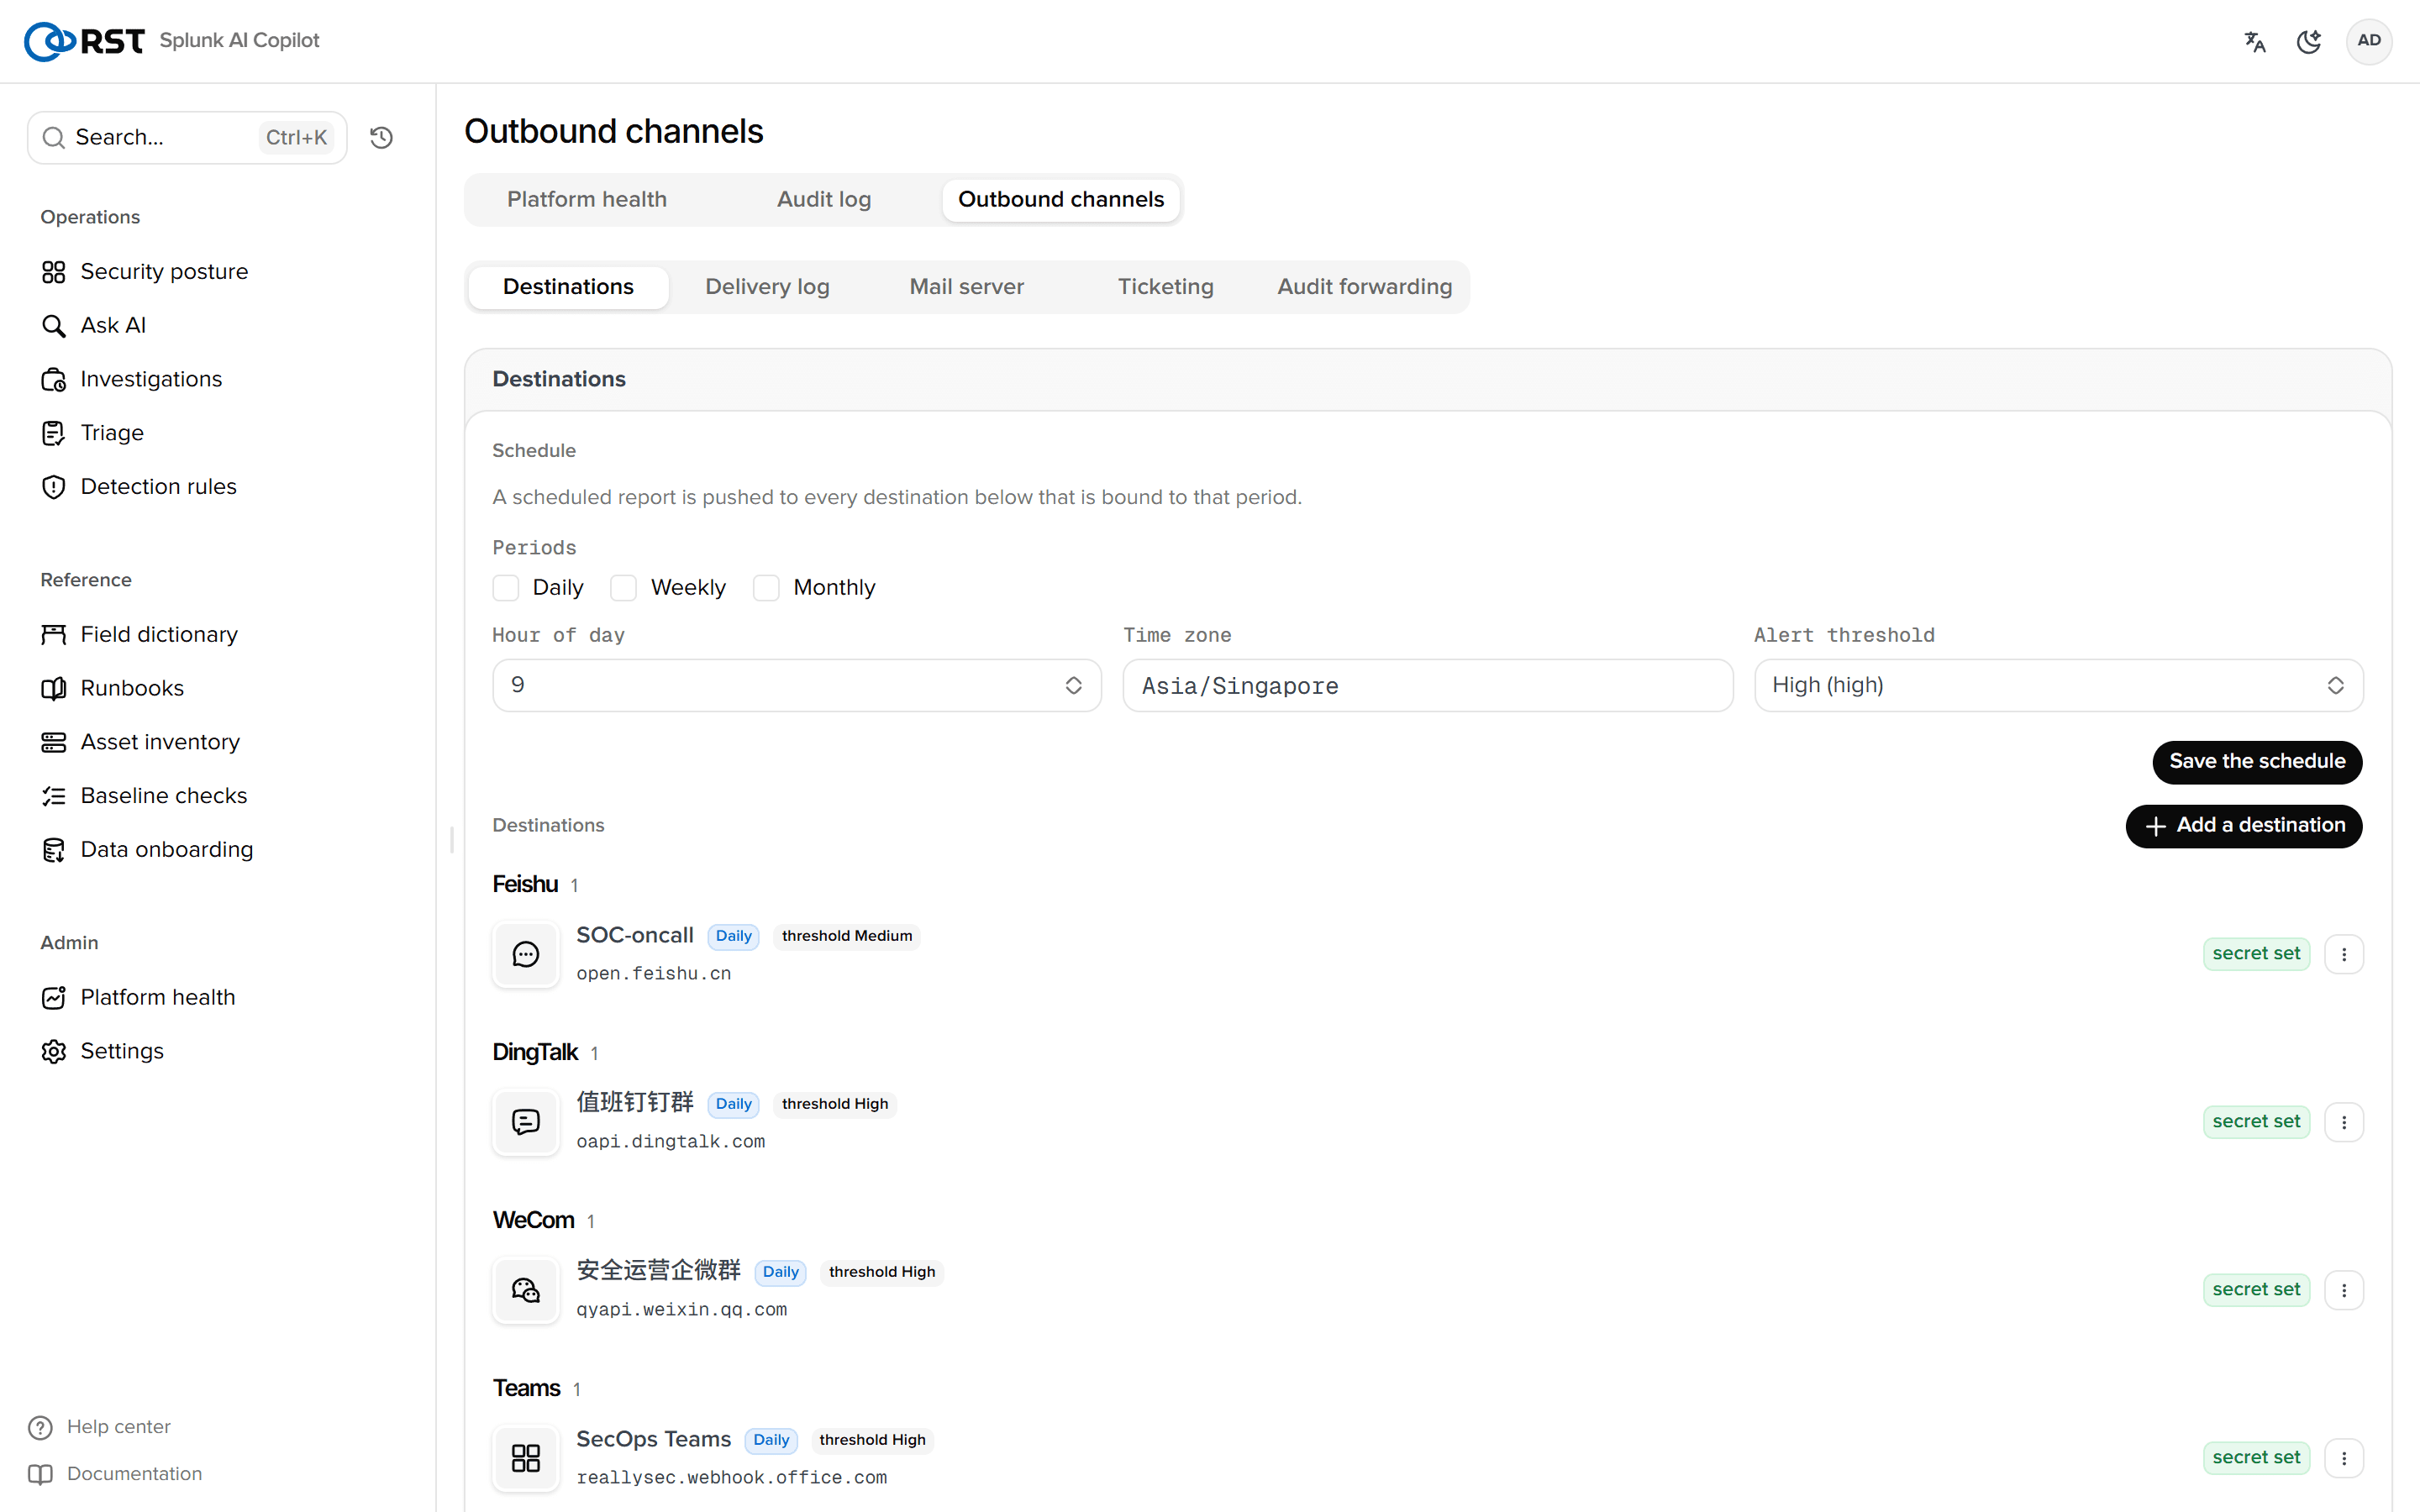
Targets
| Channel | Form | Notes |
|---|---|---|
| Feishu | Bot webhook + signature | Interactive card |
| DingTalk | Bot webhook + HMAC signature | oapi.dingtalk.com |
| WeCom | Bot webhook | qyapi.weixin.qq.com |
| Slack | Incoming Webhook | Block Kit card: title, severity bar, summary, "Open in Copilot" button; hooks.slack.com |
| Microsoft Teams | Workflows / Incoming Webhook | Adaptive Card 1.4; *.logic.azure.com / *.webhook.office.com |
| Recipient list | Global SMTP below | |
| Generic webhook | JSON POST | Custom SOAR / SIEM |
Each target has a severity threshold (only ≥ that level). Webhook URLs live in storage/passwords; the list shows only the host, and an empty field on edit keeps the stored value. "Test send" posts a fake alert and shows the channel's own error inline on failure (e.g. Feishu code=19001).
Domain allow-lists are fixed per channel; the generic webhook is unrestricted.
SMTP
One global configuration: host, port, encryption (starttls / ssl / none), user, password (storage/passwords), sender. Email targets carry only recipients.
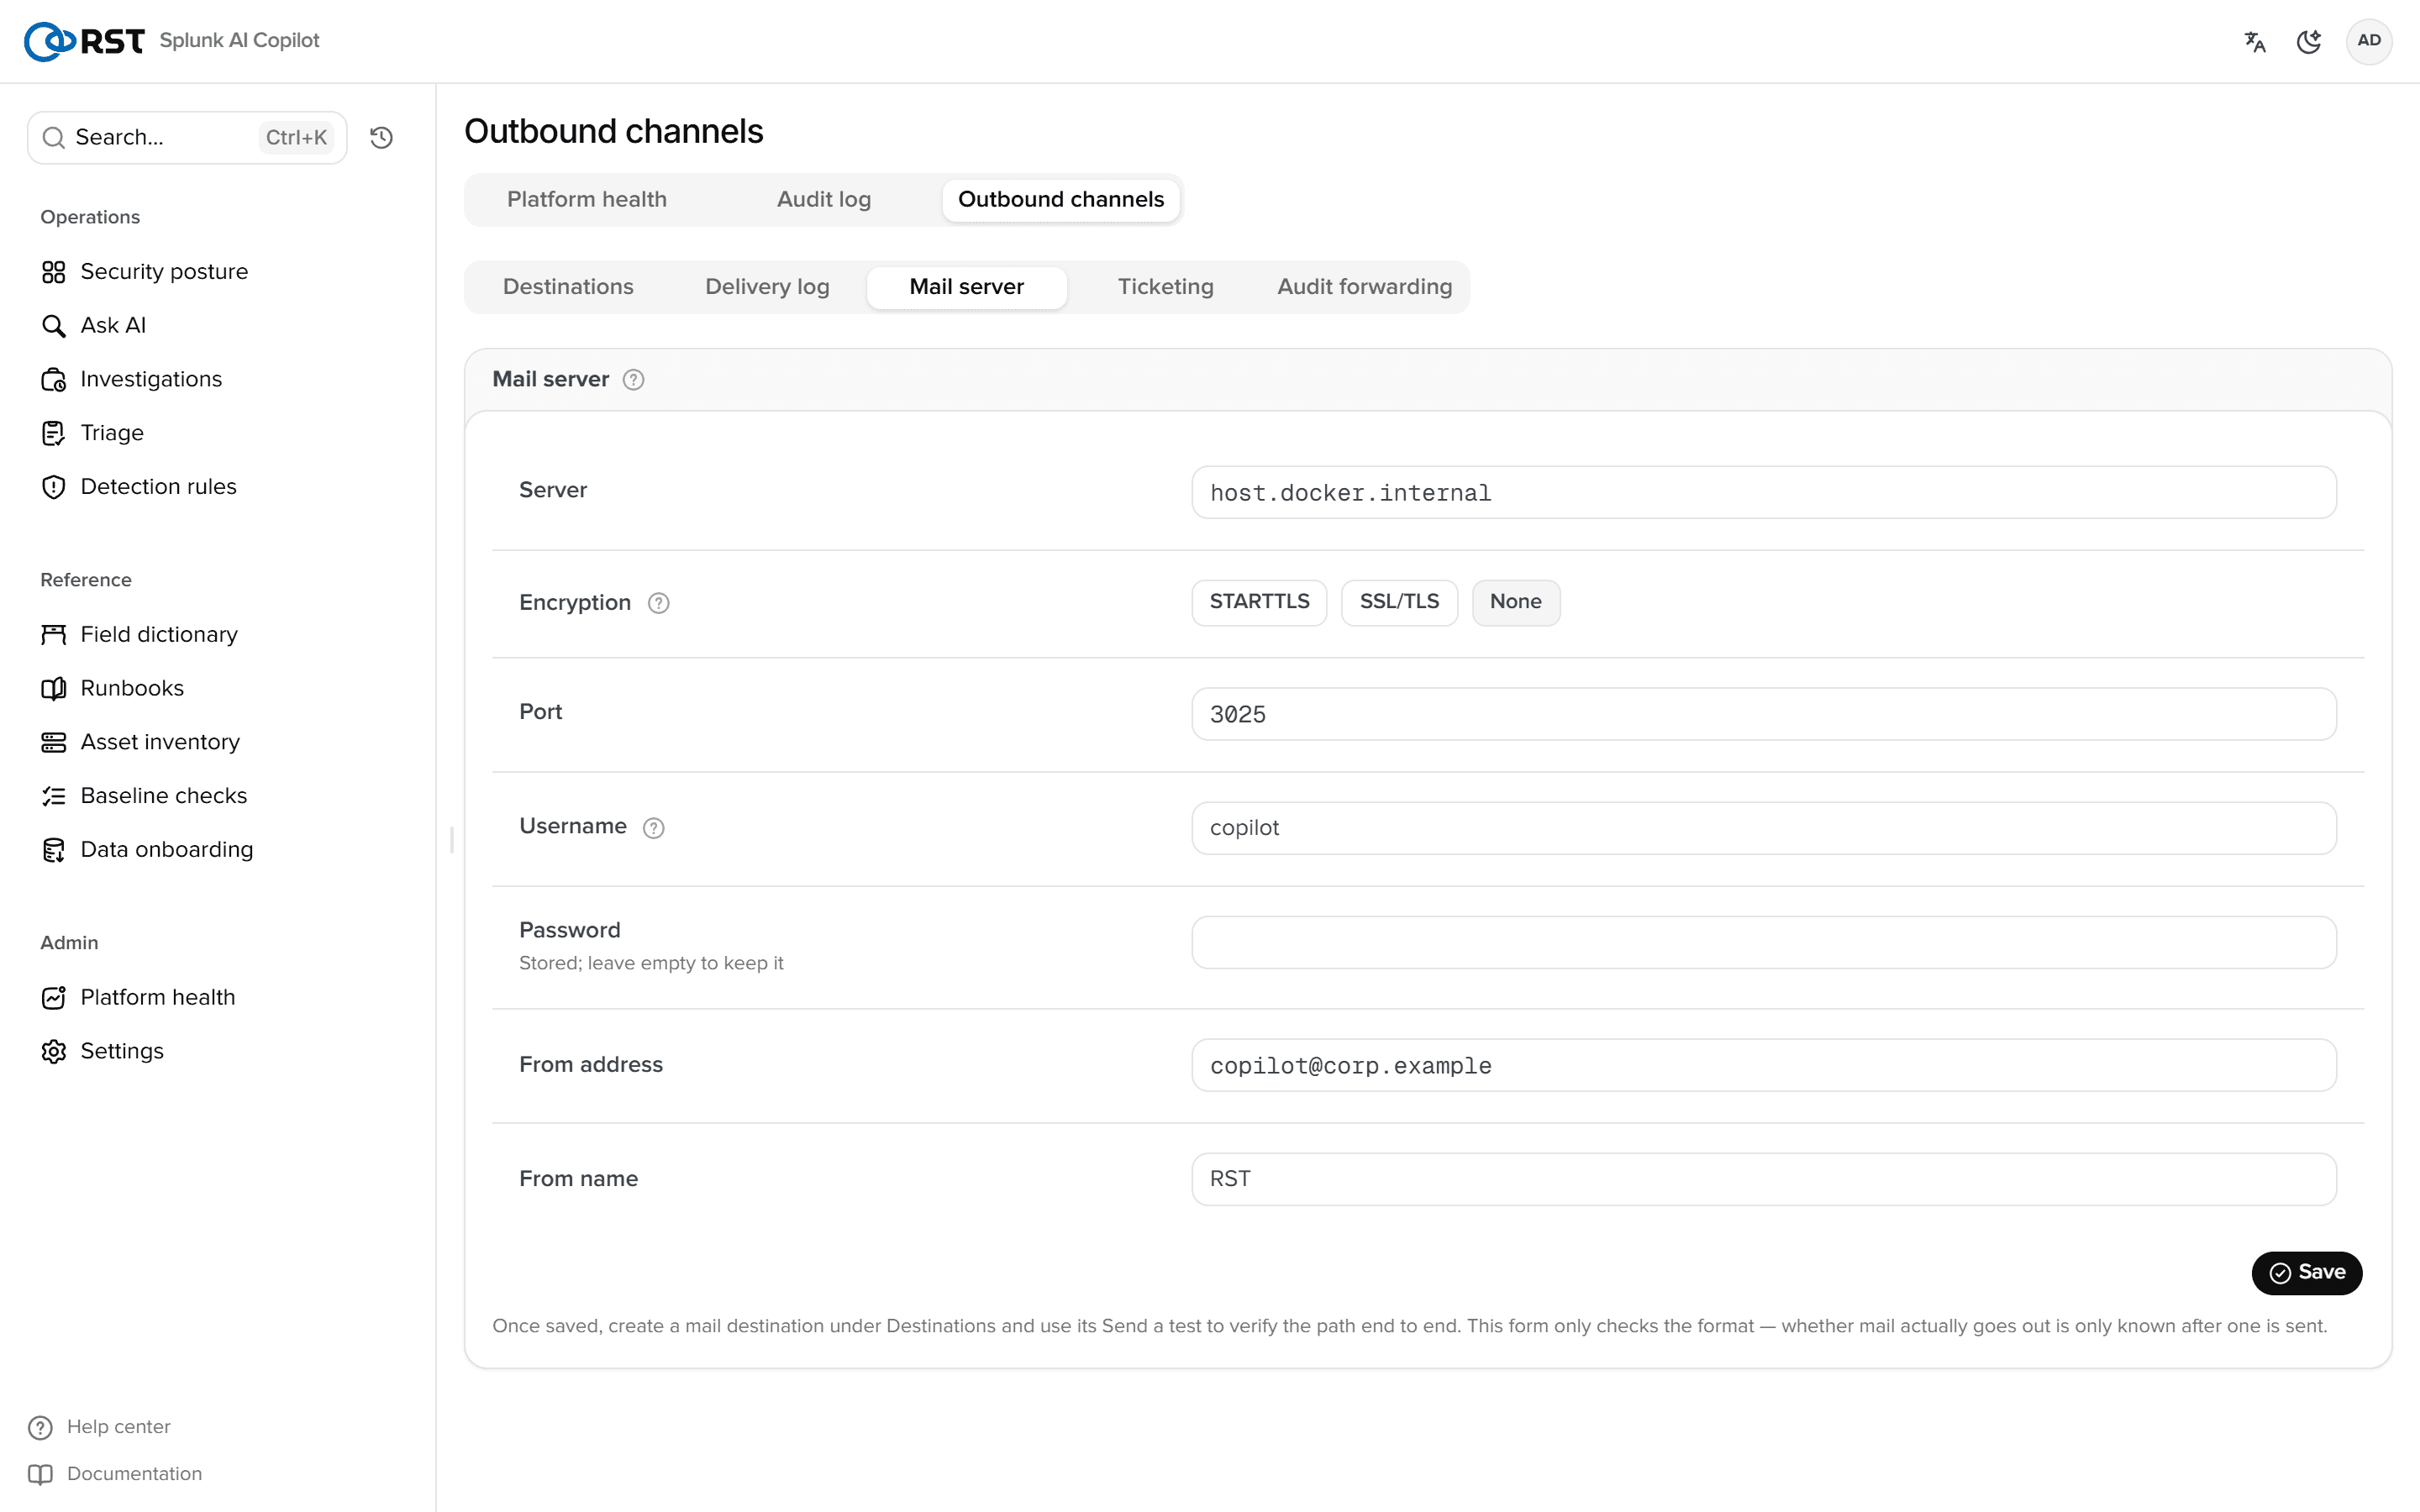
Deliveries
One record per delivery (KV copilot_notify_deliveries): target, content type, state (sent / retrying / dead), attempts, last error. Retryable errors (DingTalk 130101 / 45009, Slack / Teams 5xx, network) back off and retry automatically; dead ones can be resent by hand.
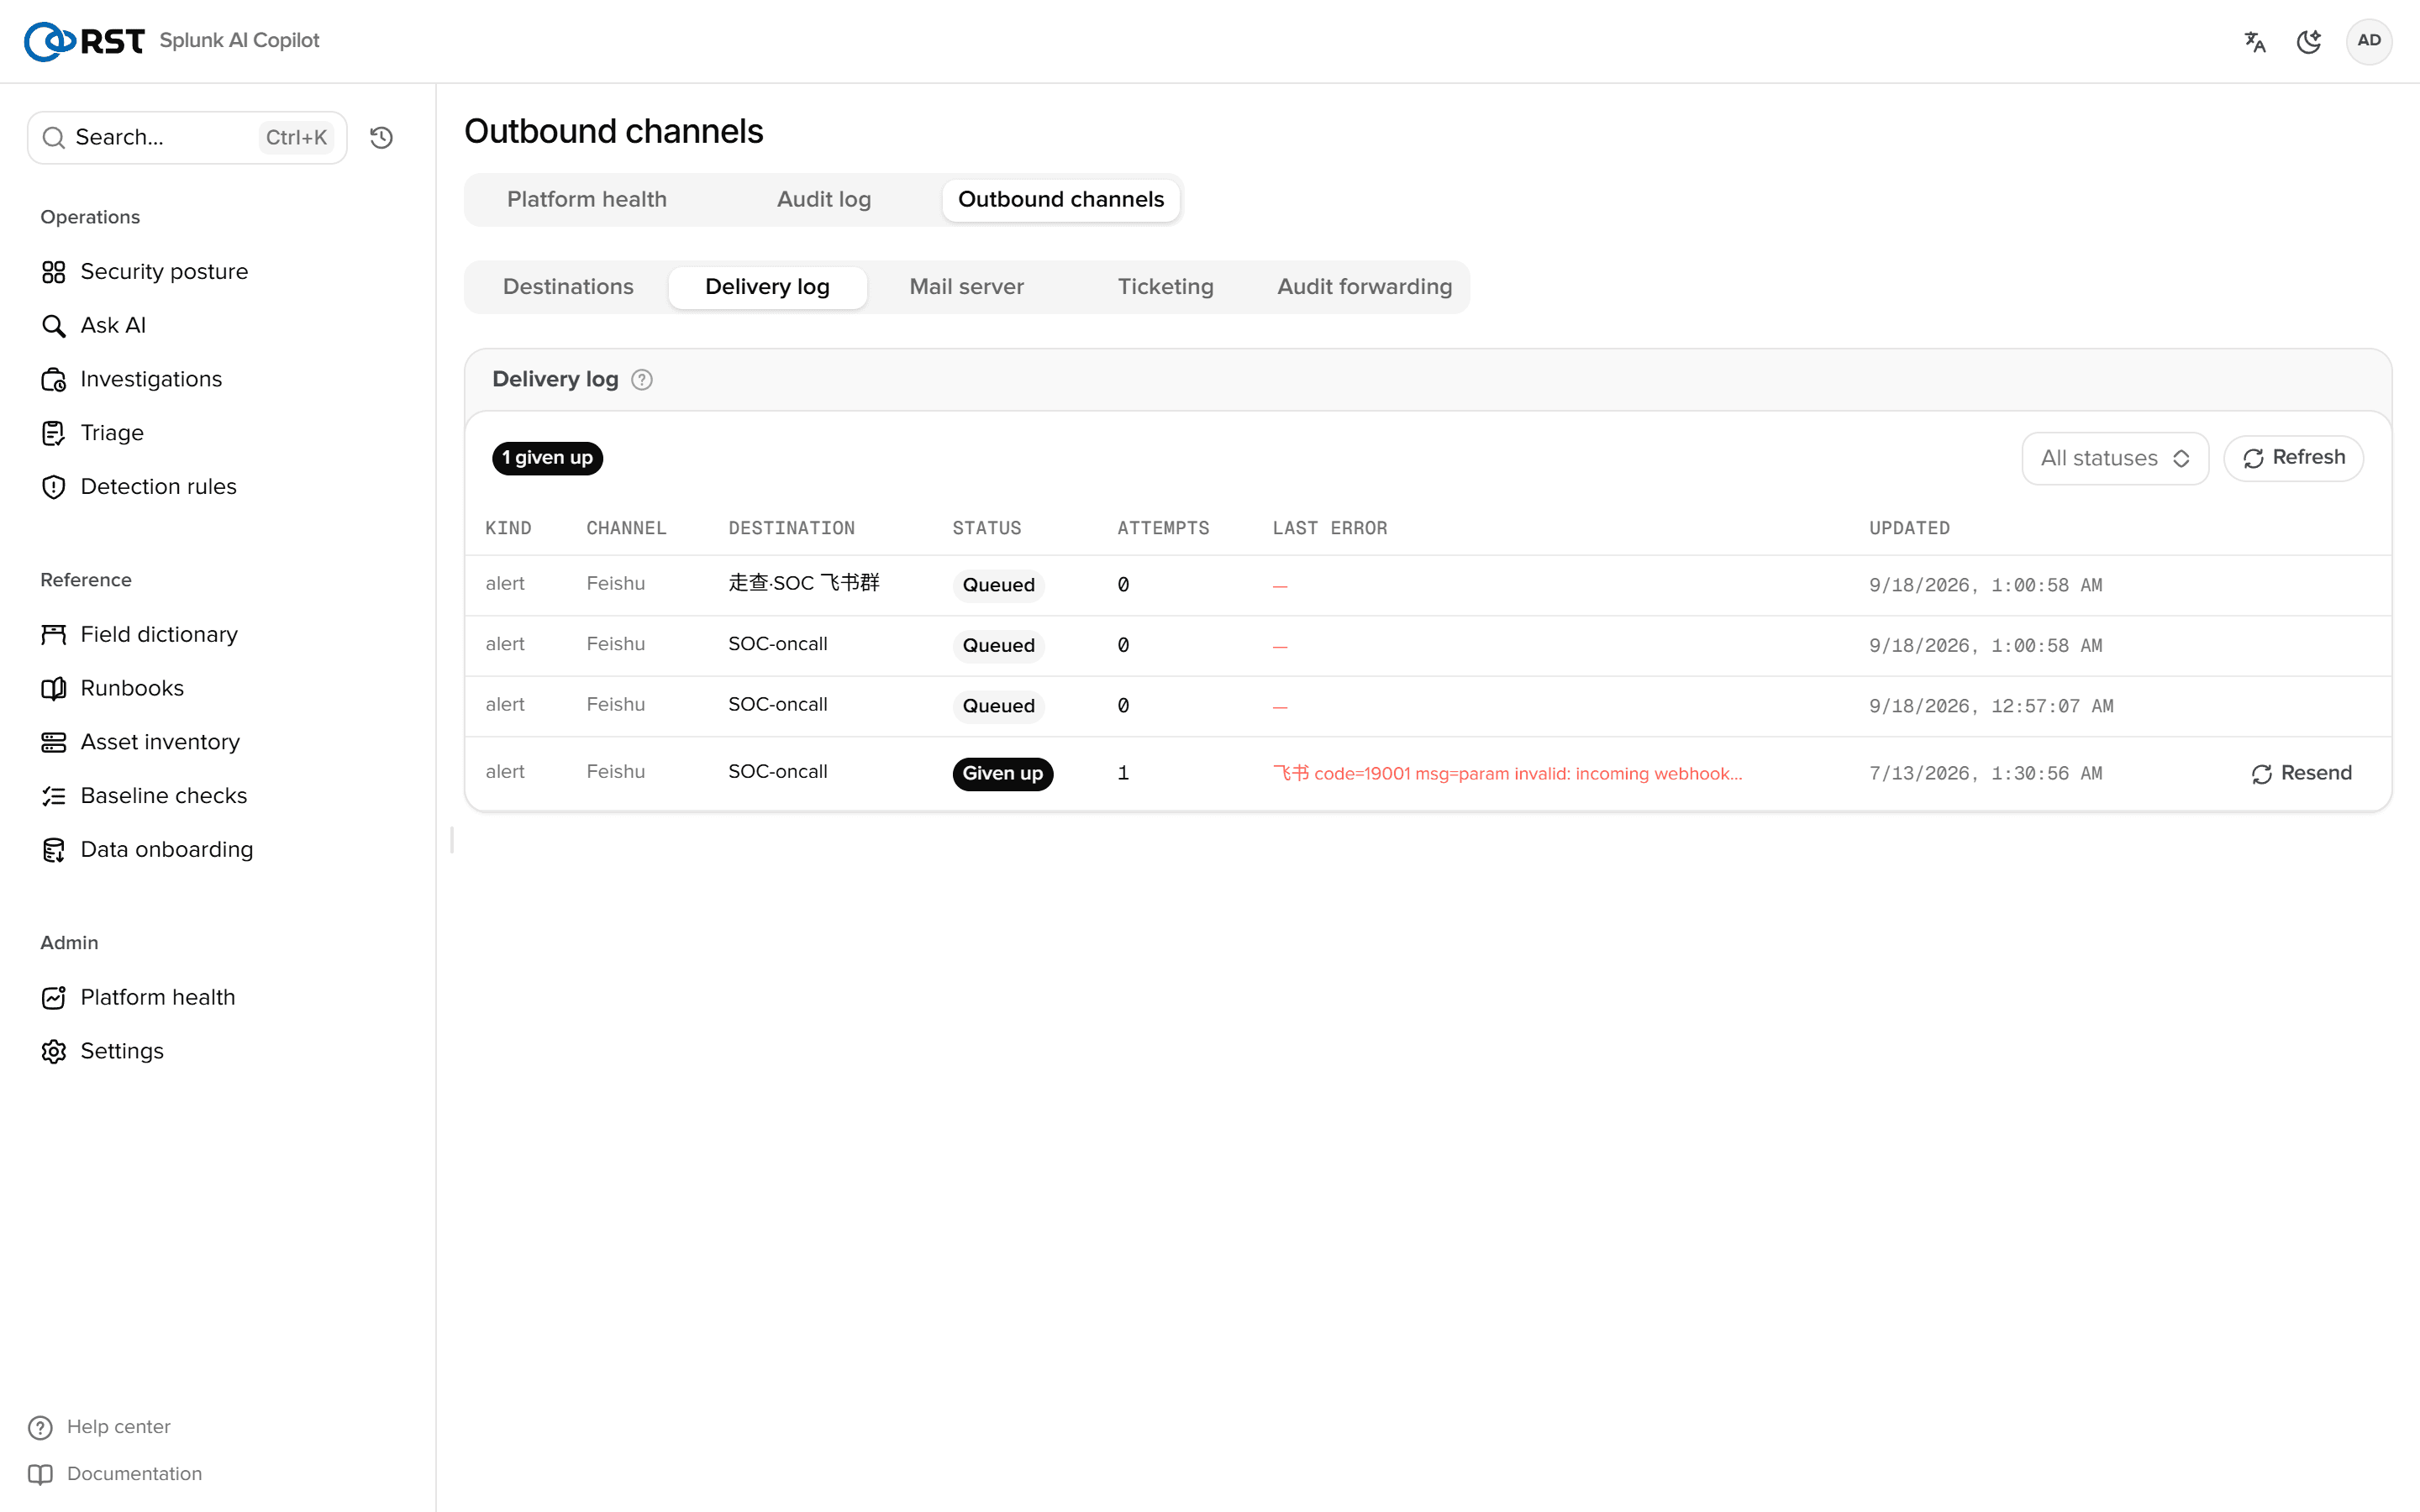
Schedule
Scheduled generation and push of operations reports: hour and time zone (stored only; reports run in the splunkd zone).
Ticketing (1.9.0+)
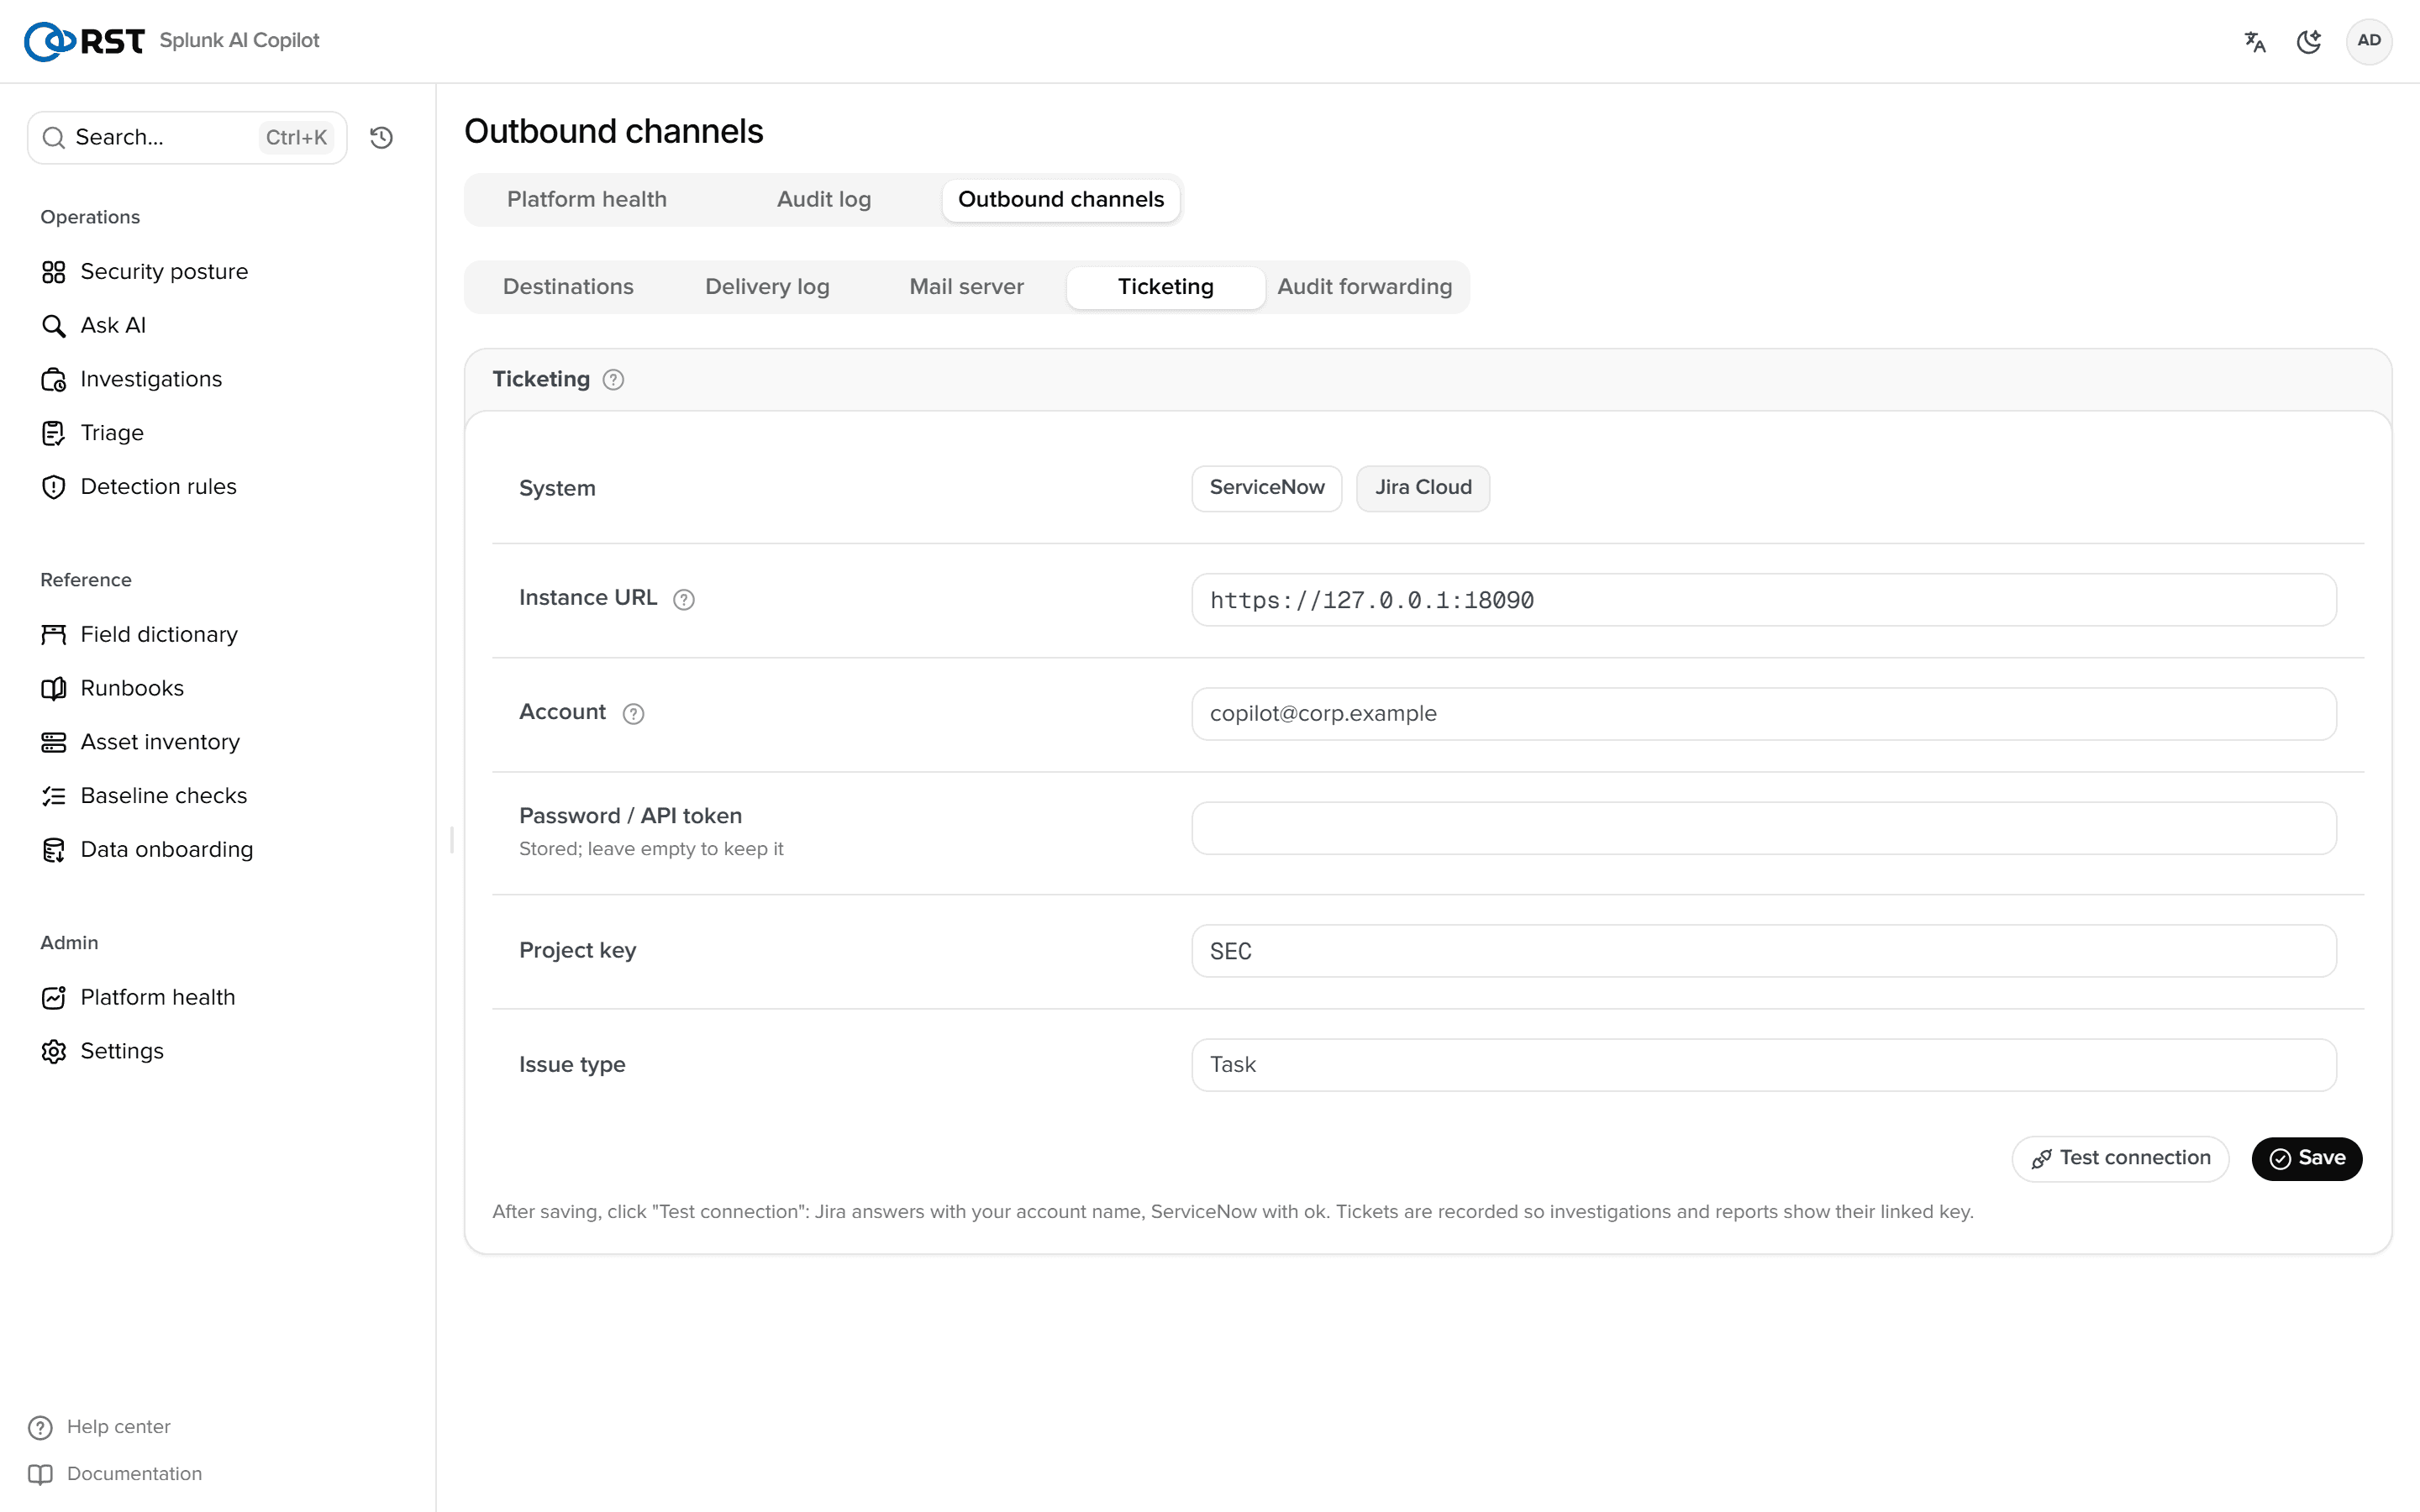
The "Ticketing" tab configures ServiceNow or Jira:
| Item | ServiceNow | Jira Cloud |
|---|---|---|
| URL | https://<instance>.service-now.com | https://<site>.atlassian.net |
| Auth | Basic (user + password) or OAuth token | Email + API token (Basic) |
| Target | incident table | Project key + issue type |
| Mapping | Severity → urgency / impact | Severity → priority |
Credentials go to storage/passwords; "Test connection" shows the account name the other side returns. Tickets are opened from the investigation dialog and the reports page: body = the incident report (ADF for Jira); the returned key and link are stored on the investigation record. Egress policy is [tickets]: SaaS domains are allowed by default, on-prem hosts must be listed in allowed_hosts, private CAs use verify_tls = 0.
Audit log
One metadata event per AI call: who, which action, which index, how long, outcome, tokens. A server-aggregated dashboard, thumbs-down review, usage and budget.
Settings
Index allow-list, the three masking modes, audit forwarding, version. There is no Elasticsearch-connection block: the Splunk connection is implicit inside the app.