

Triage and investigation
Cluster and rank a batch of alerts, investigate the root cause of one alert, export an incident report and push the conclusion. Needs a Professional license.
Alert triage and alert investigation need a Professional or Enterprise license. Without one you can open the pages, and running them offers the upgrade.
Batch triage
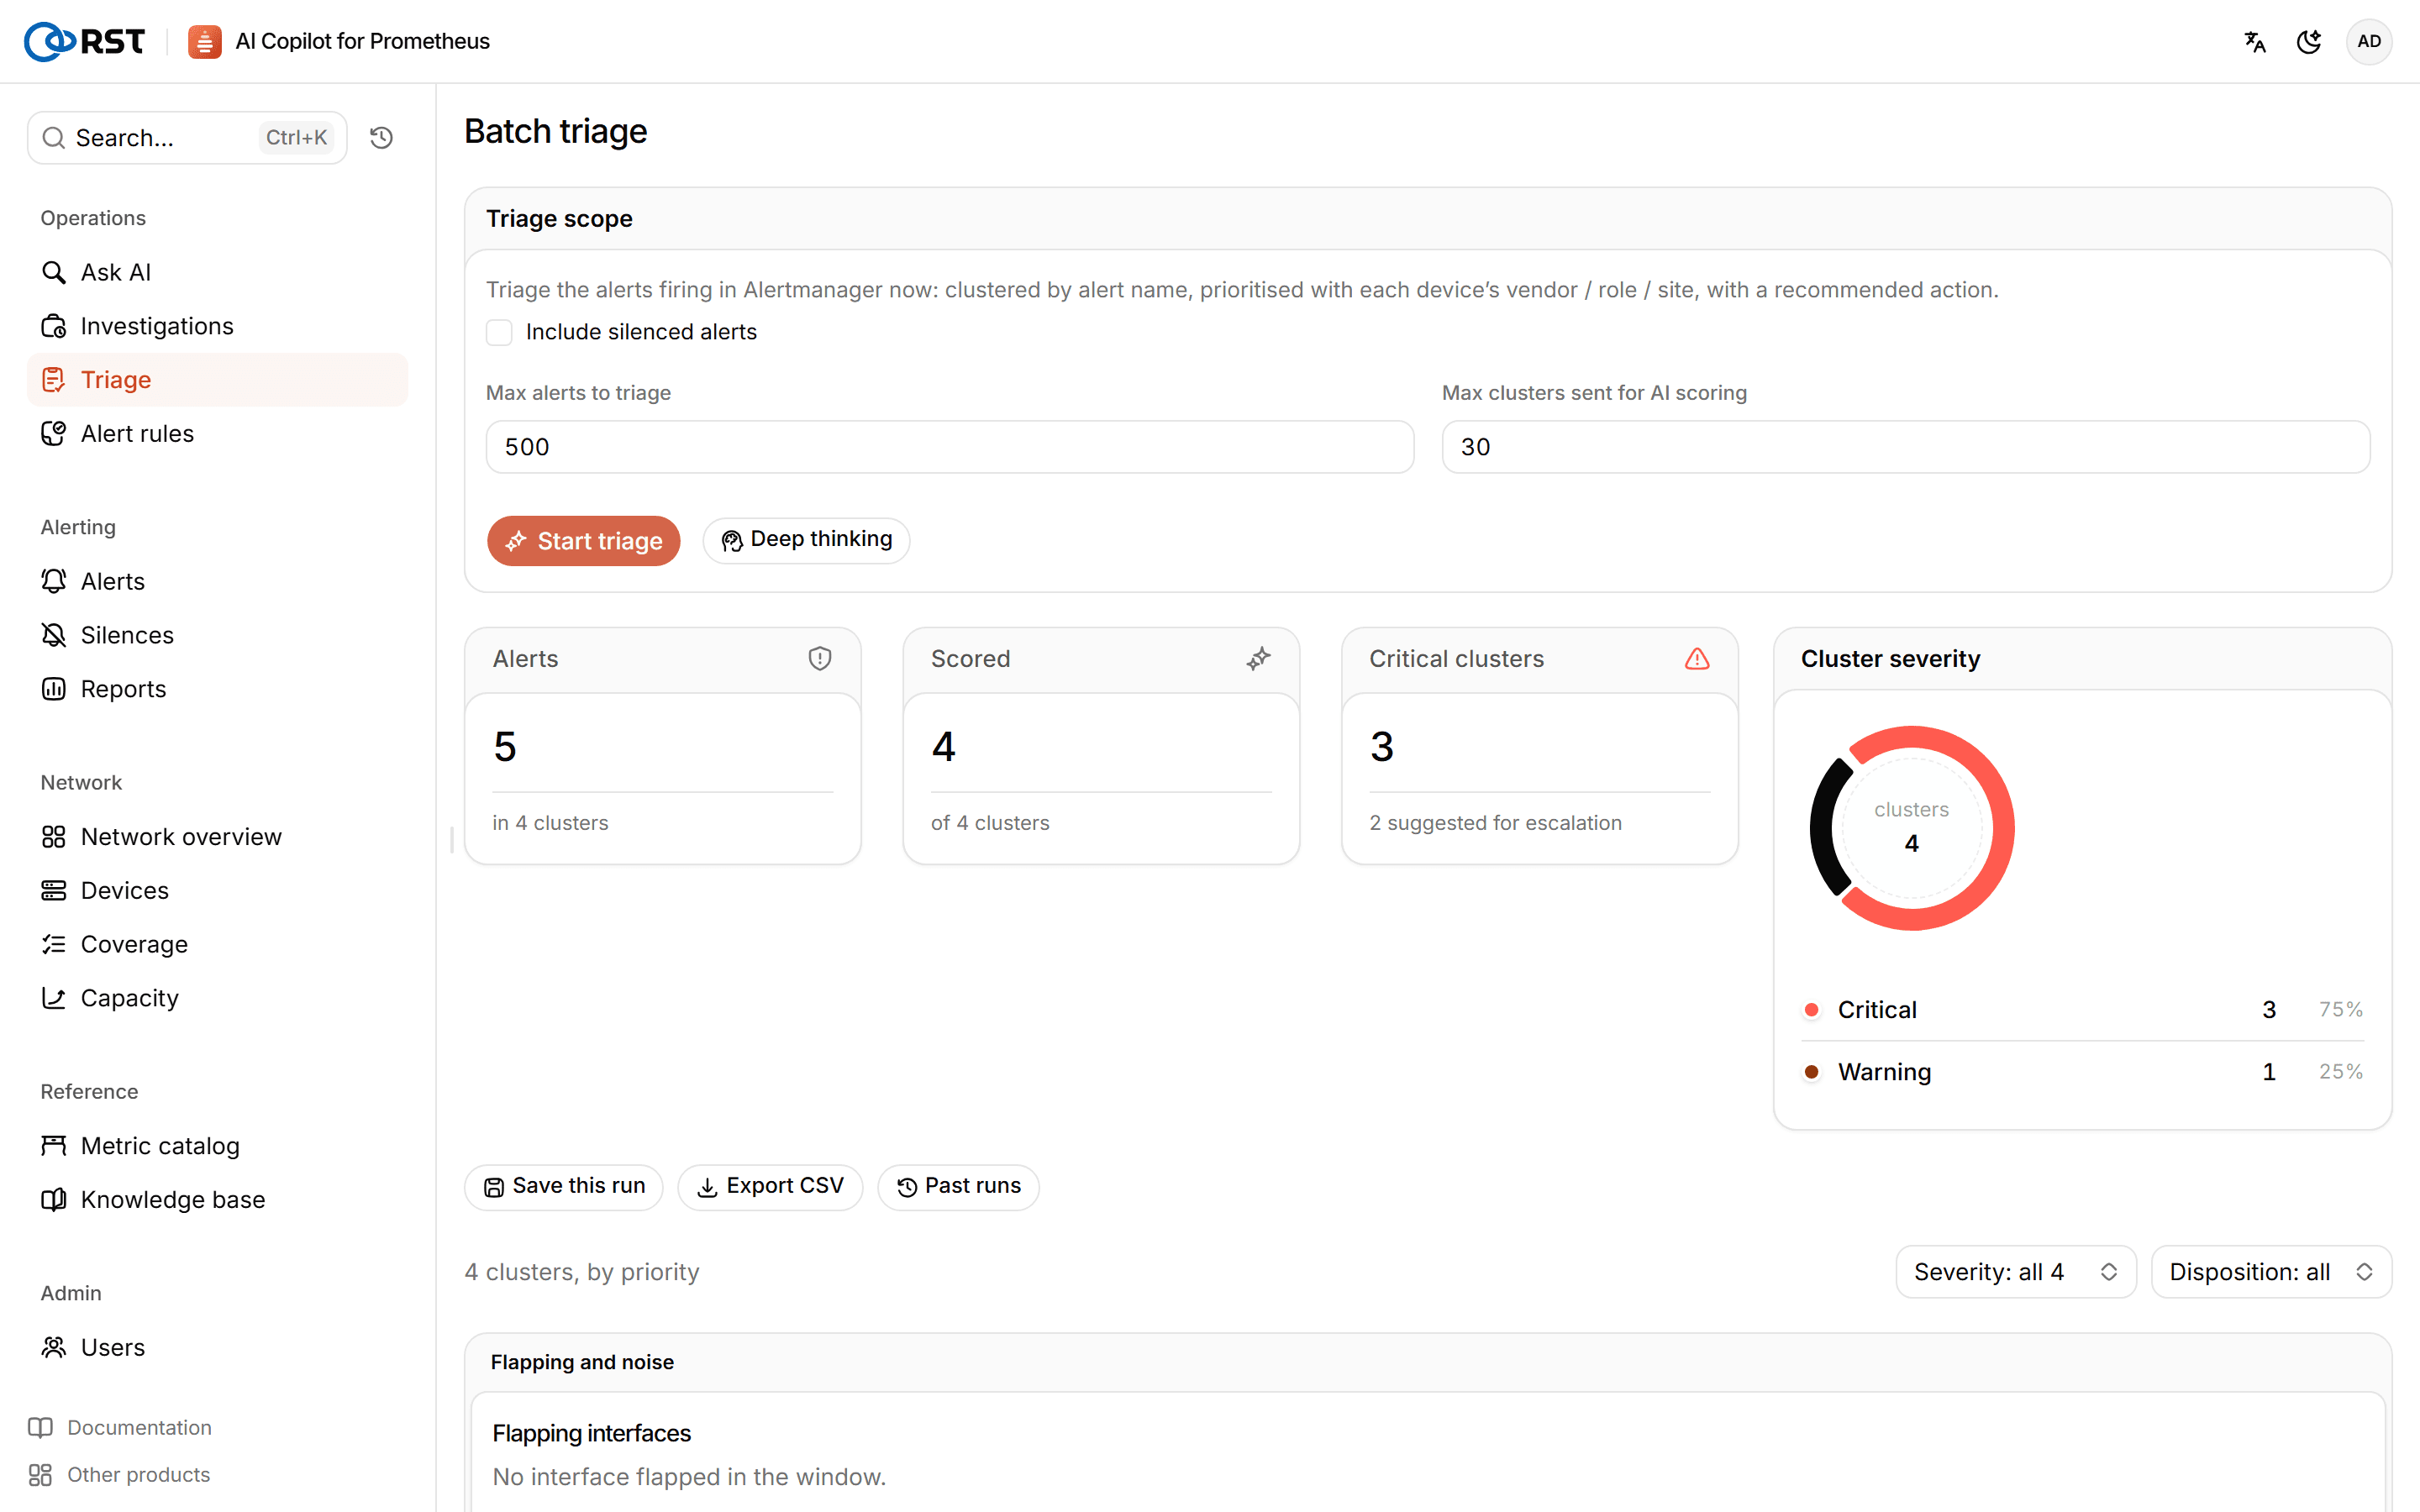
Triage works on the alerts currently firing in Alertmanager: it clusters them by alert name, ranks the clusters by device vendor, role and site, has the model score each cluster's severity and judge whether it is noise, and suggests what to do.
Steps
- Set the scope: whether to include silenced alerts, the maximum number of alerts, and how many clusters go to the model for scoring. You can also send selected alerts from Alerts with Send to triage.
- Click Start triage.
- The result is a triage queue in priority order. The summary at the top shows the number of alerts, clusters, clusters to escalate, critical clusters and likely false positives.
Click a row to see the affected devices, the recommendation, the runbook, the alert summary and the flapping and noise picture for that device. For each cluster you can:
| Action | What it does |
|---|---|
| Escalate | Marks the cluster as escalated and pushes it to notification destinations that receive escalations; see Notifications |
| Investigate | Investigates the root cause on the first device in the cluster |
| Silence | Creates a silence for the devices in the cluster |
| Compare | Adds the cluster to the side-by-side comparison at the bottom |
Select several clusters to change their handling state at once. Save this run makes it visible to the whole team, with an optional note; Export CSV exports the queue. Past runs lists saved runs.
If model scoring fails, clusters are ordered by severity and number of affected devices without AI recommendations; you can try again later.
Alert investigation
Click Investigate in an alert's details or in the triage queue to open the alert investigation. The model investigates on its own: it queries live metrics for the device and related links over several rounds, cites runbooks from the knowledge base, and returns a conclusion. This usually takes 30 to 60 seconds.
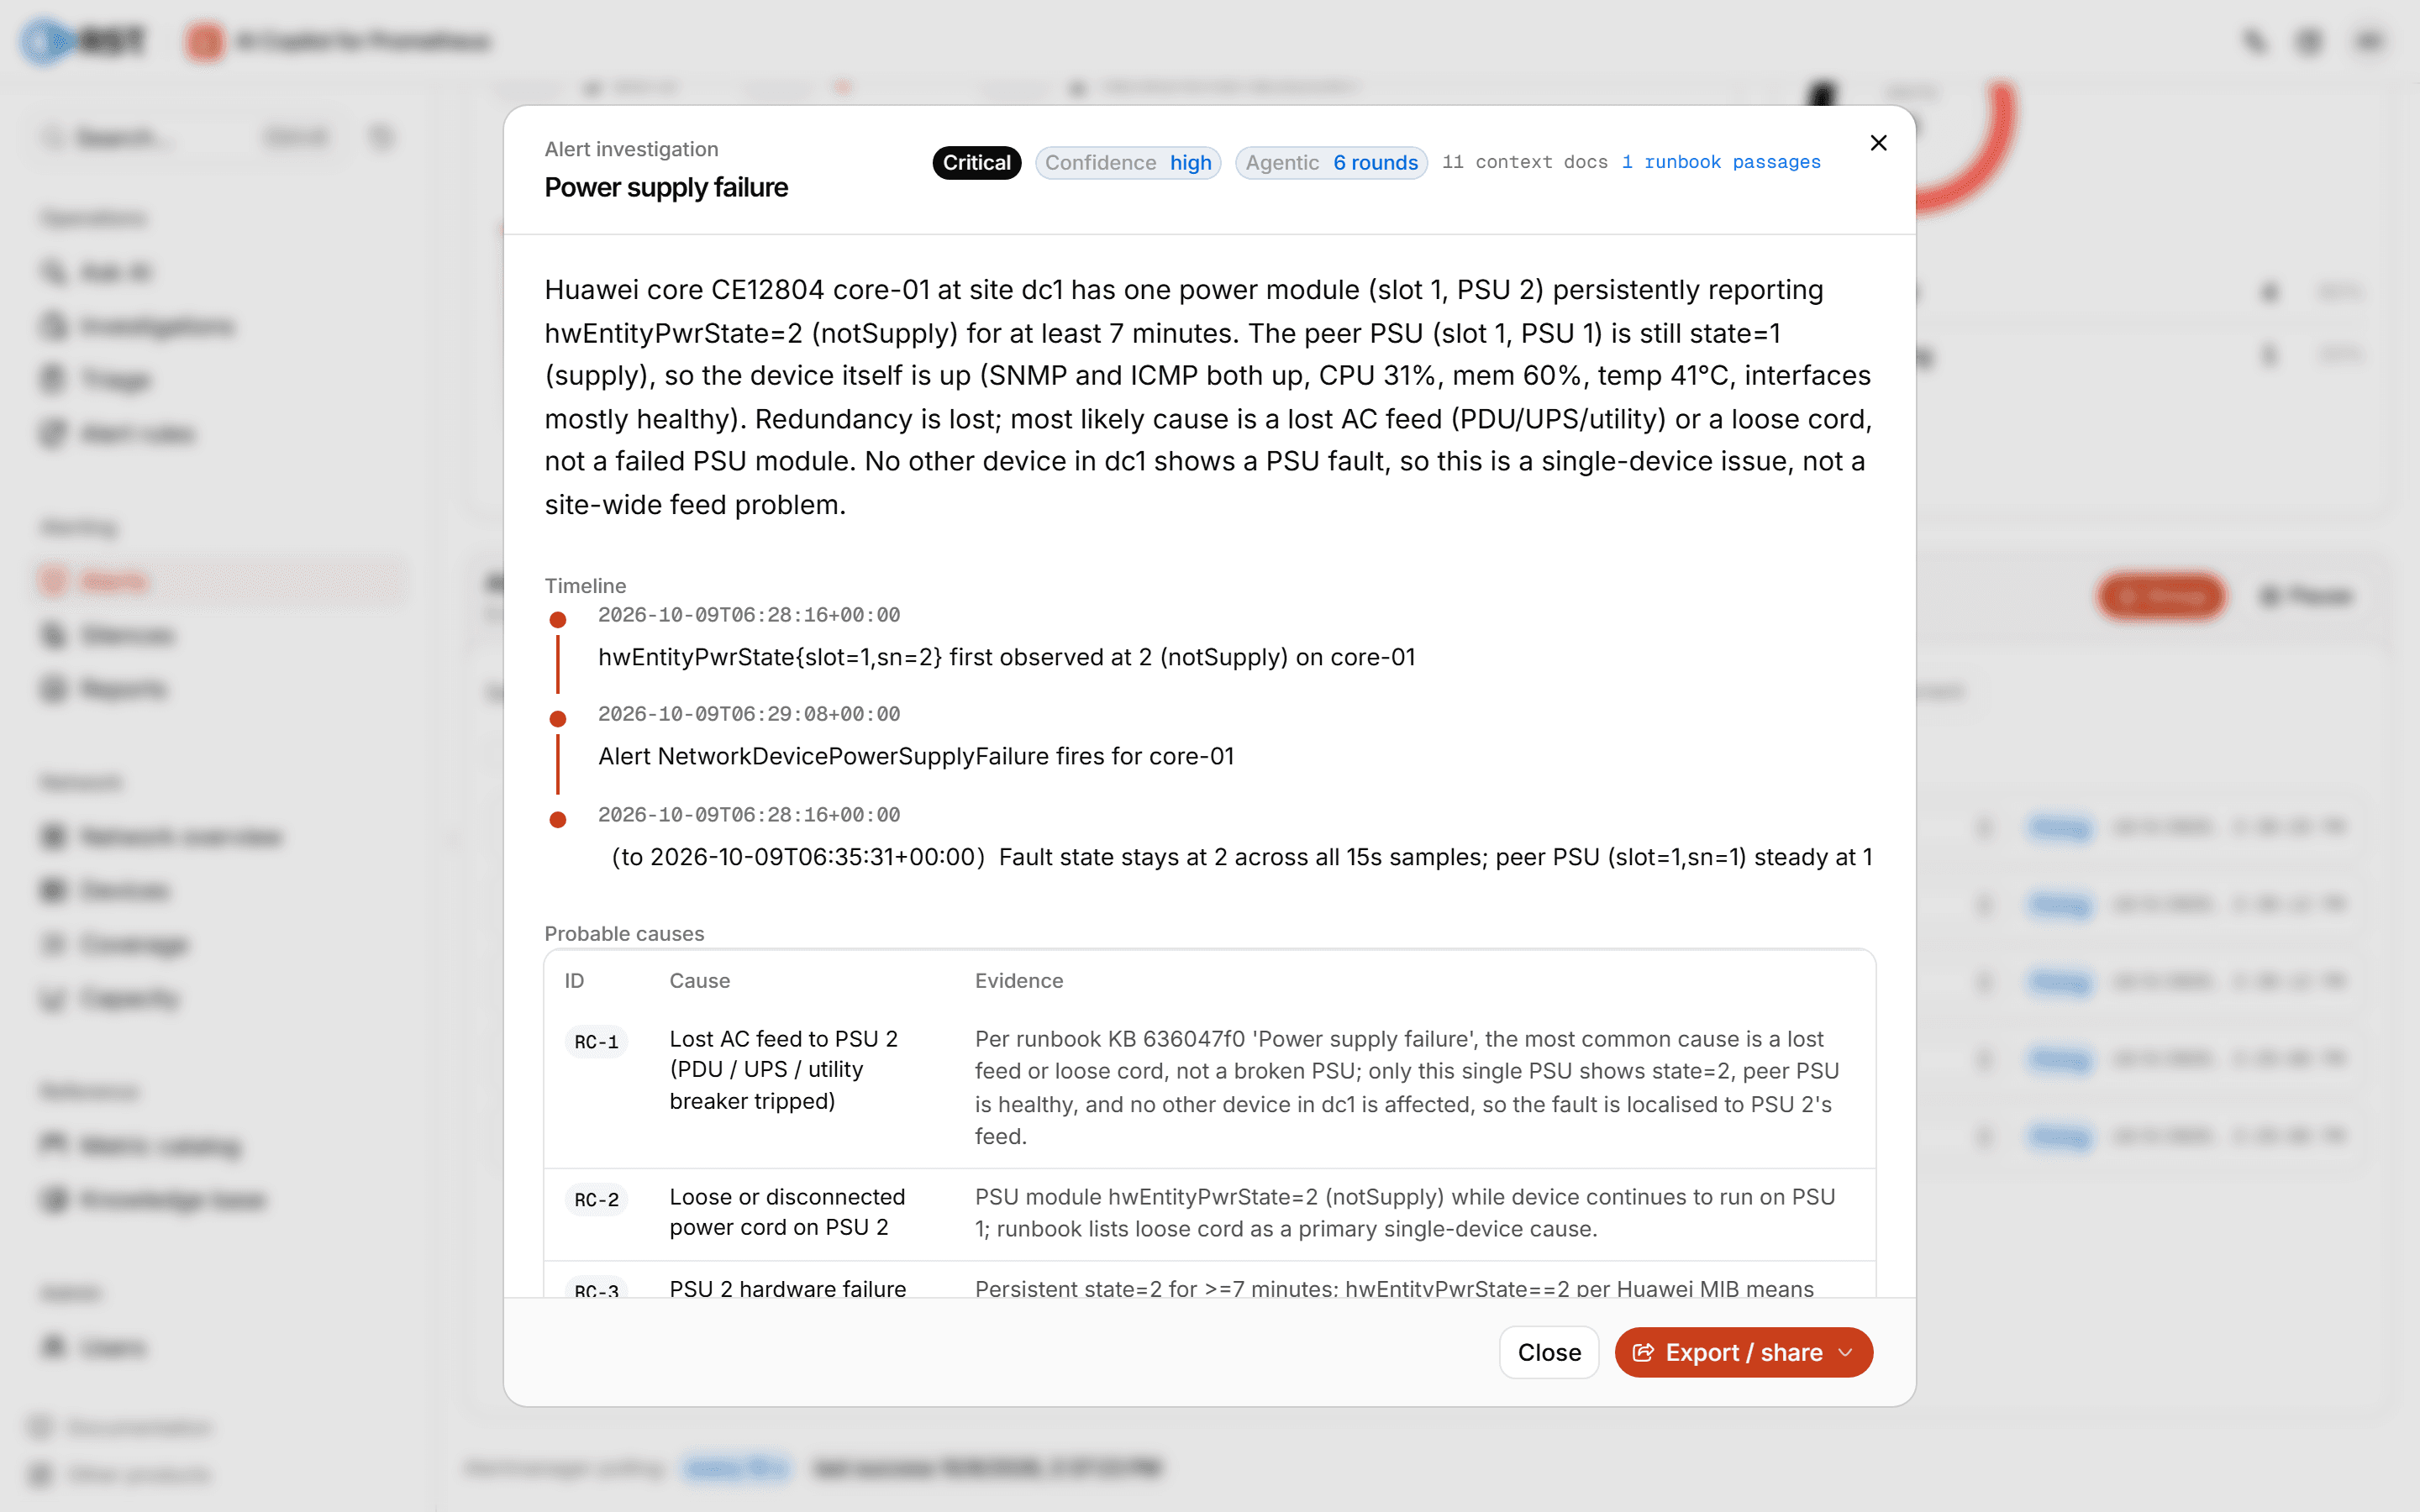
The conclusion includes:
- a false-positive verdict, a timeline, likely causes and related signals;
- live metric evidence: the PromQL that ran and the series it returned;
- runbooks cited, affected objects and recommended actions;
- the query trail: each step, what it called and whether it succeeded.
After an investigation you can:
| Action | What it does |
|---|---|
| Export the incident report (Markdown) | Produces an incident report |
| Push the conclusion | Sends it to destinations subscribed to AI findings |
| Make an alert rule | Turns the confirmed fault into a Prometheus alert rule; see Alert rules |
Without a model, the investigation makes no root-cause assessment and only gathers live metrics and runbooks as evidence.
Investigations and triage runs are kept in Investigations.
Alerts and silences
Read alerts from Alertmanager with live updates, track how they were handled, and silence them.
Alert rules
Generate alert rules from plain language, validate and submit them for approval, write them back to Prometheus with a hot reload, roll back by version, and install the built-in network rule pack.