

Monitoring health
Check the health of Prometheus and Alertmanager themselves, with a verdict and advice for each check and an AI readout that ties them together. Needs a Professional license.
Monitoring health is in the Admin group at the bottom of the sidebar and opens as a page tab. It needs a Professional or Enterprise license; without one you can open the page, and running it offers the upgrade.
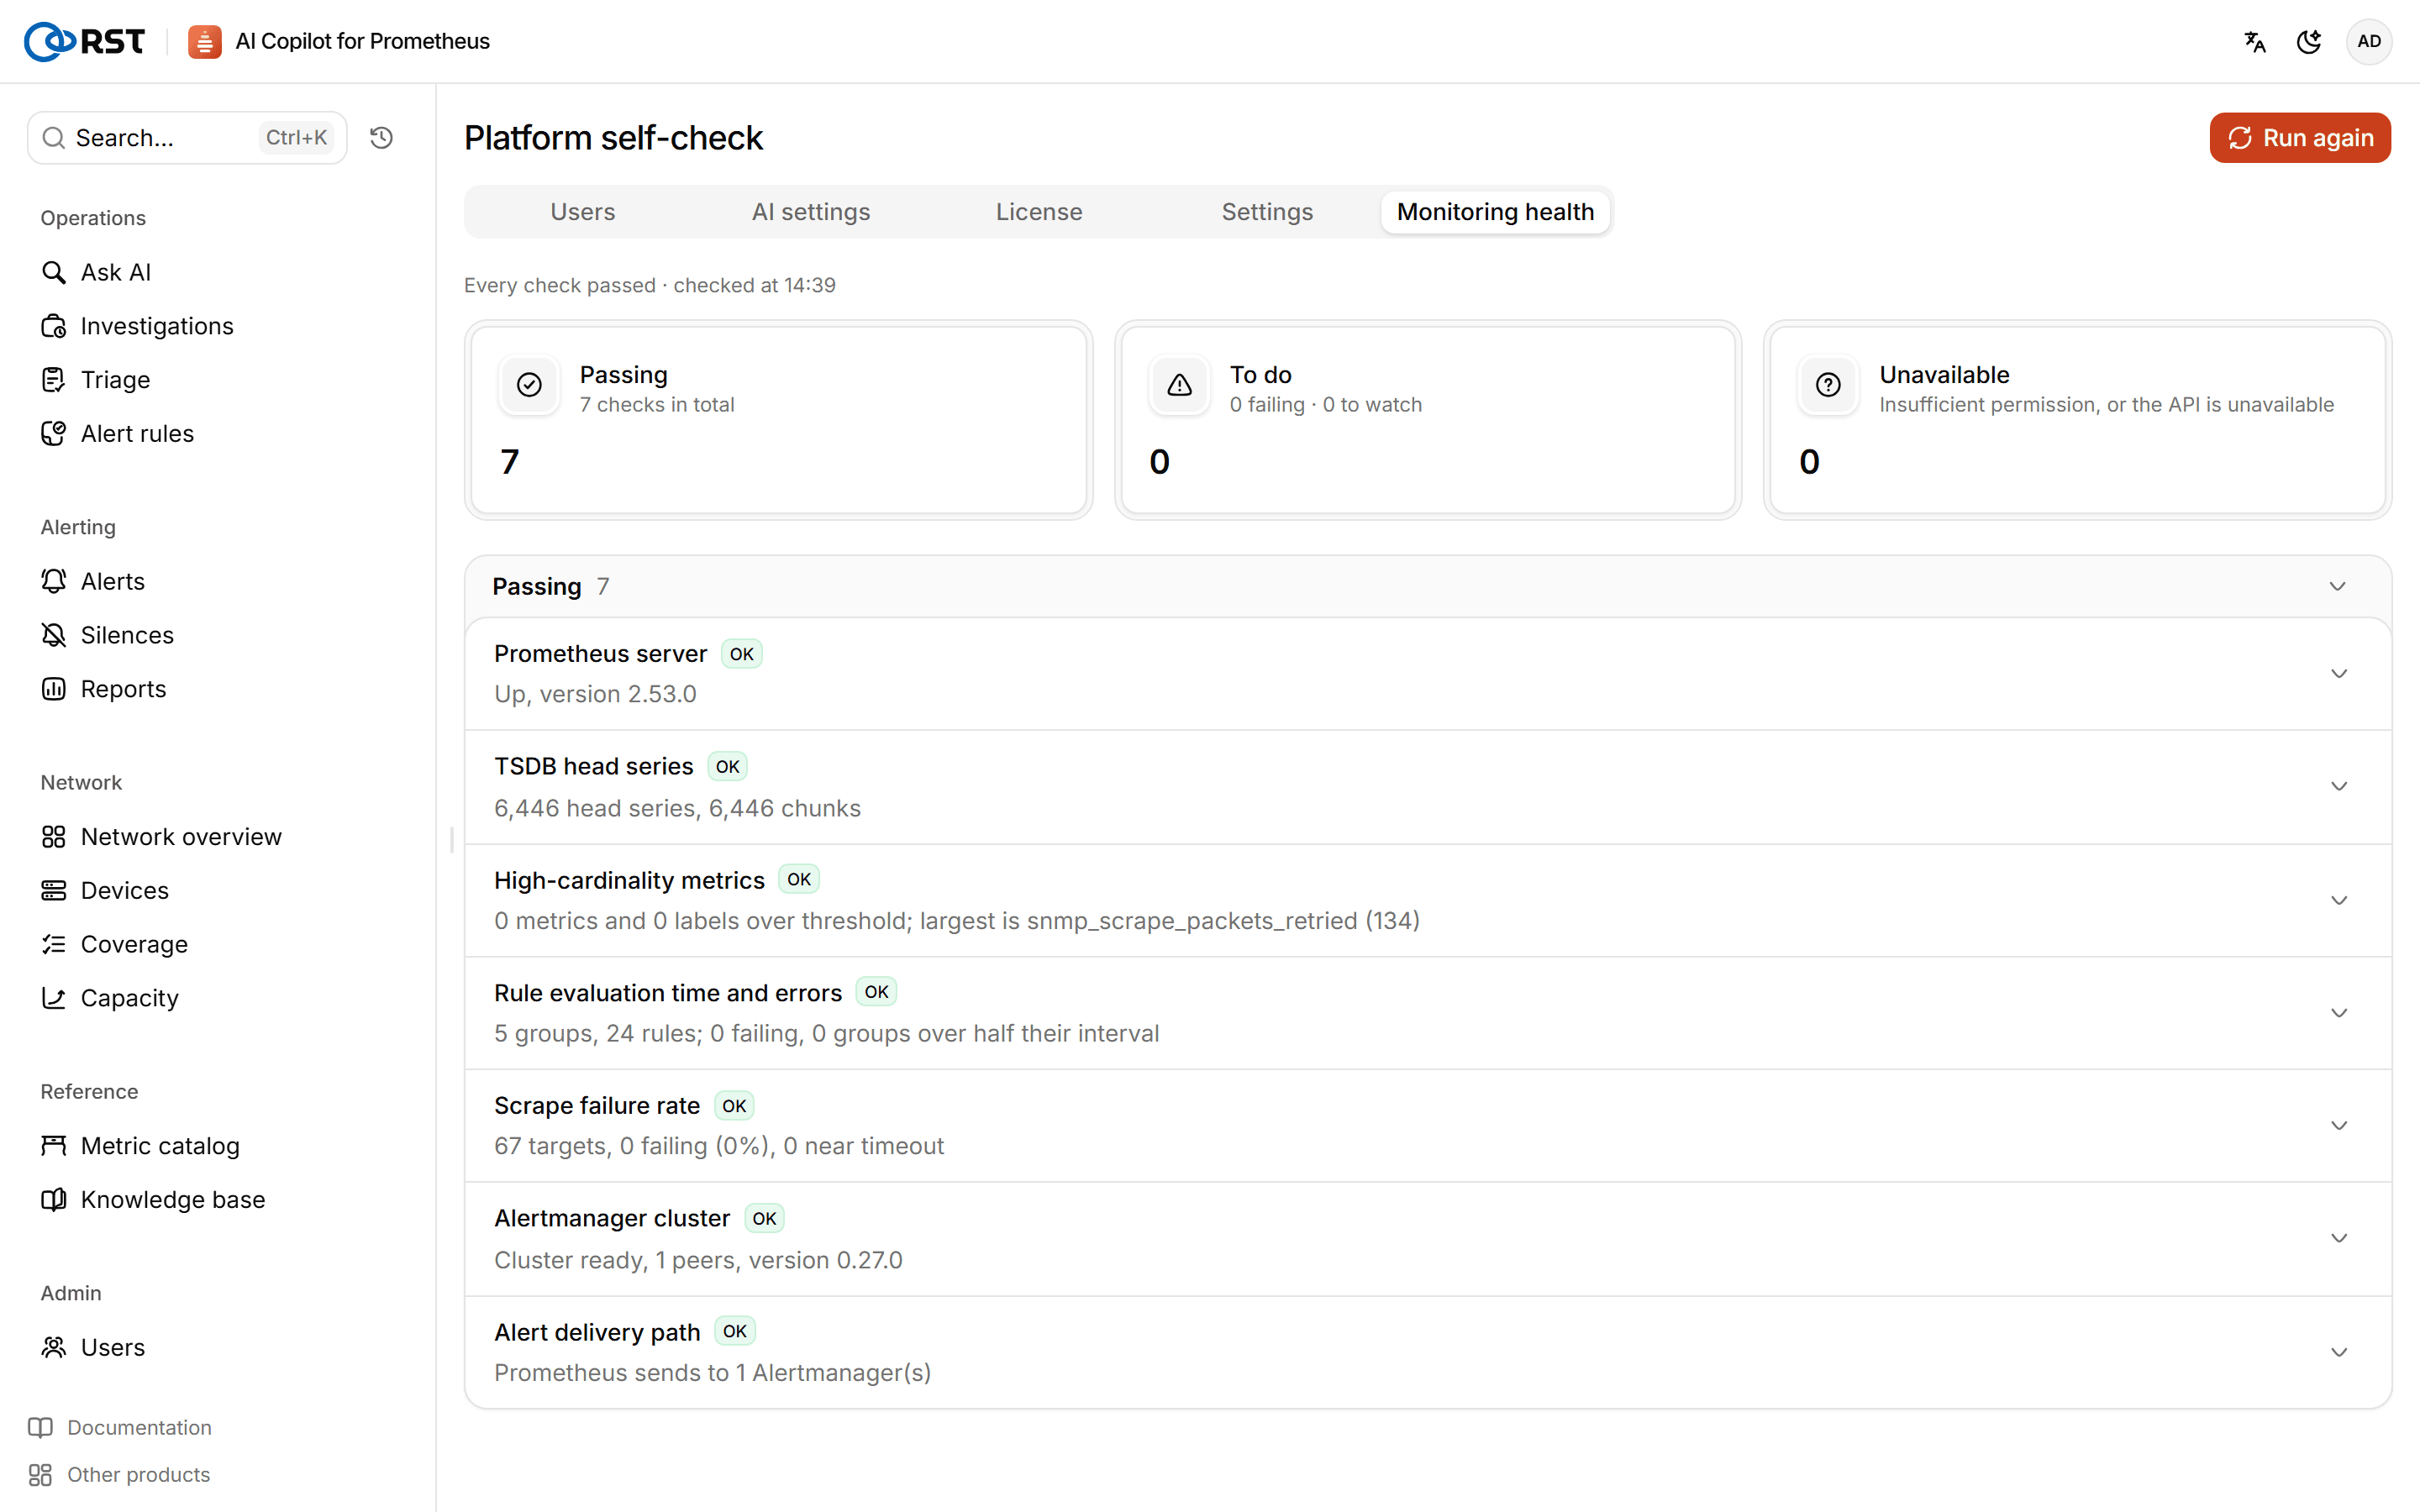
The check is read-only: the gateway calls the read-only APIs of Prometheus and Alertmanager, and each check returns a verdict with advice you apply by hand. It never changes your monitoring stack.
Checks
| Check | What it looks at |
|---|---|
| Prometheus | Whether it is up, and its version |
| TSDB series | Head series and chunk counts; too many series drive up memory |
| High cardinality | Metrics and labels whose series count exceeds the threshold, ranked |
| Rule evaluation | Rule groups and rules, rules failing to evaluate, groups taking more than half their interval |
| Scrape targets | Share of failing targets, targets close to their timeout |
| Alertmanager | Cluster status, number of peers, version |
| Alert delivery | How many Alertmanagers Prometheus is connected to, and whether notifications are being dropped |
Each verdict is OK, attention or action needed; if permissions or the API do not allow the check, it is marked as unavailable. Run again reruns every check.
AI readout
Click AI read and the model looks at the results together, says which items to handle first and why, and cites runbooks from the knowledge base. If the model returns nothing usable, items are ordered by their own severity.
Capacity
Predict from history when link bandwidth, CPU, memory, temperature and firewall sessions will reach their thresholds. Needs a Professional license.
Metric catalog and knowledge base
Descriptions of each MIB's and vendor's metrics from the content pack, and the runbooks that investigations and queries cite.