

Network
The network overview, the device inventory with per-interface alert policy, the monitoring-coverage baseline, and interface flapping and alert noise reduction.
The Network group in the sidebar has four pages: Network overview, Devices, Coverage and Capacity.
Network overview
Network overview shows the current state of the network on one screen.
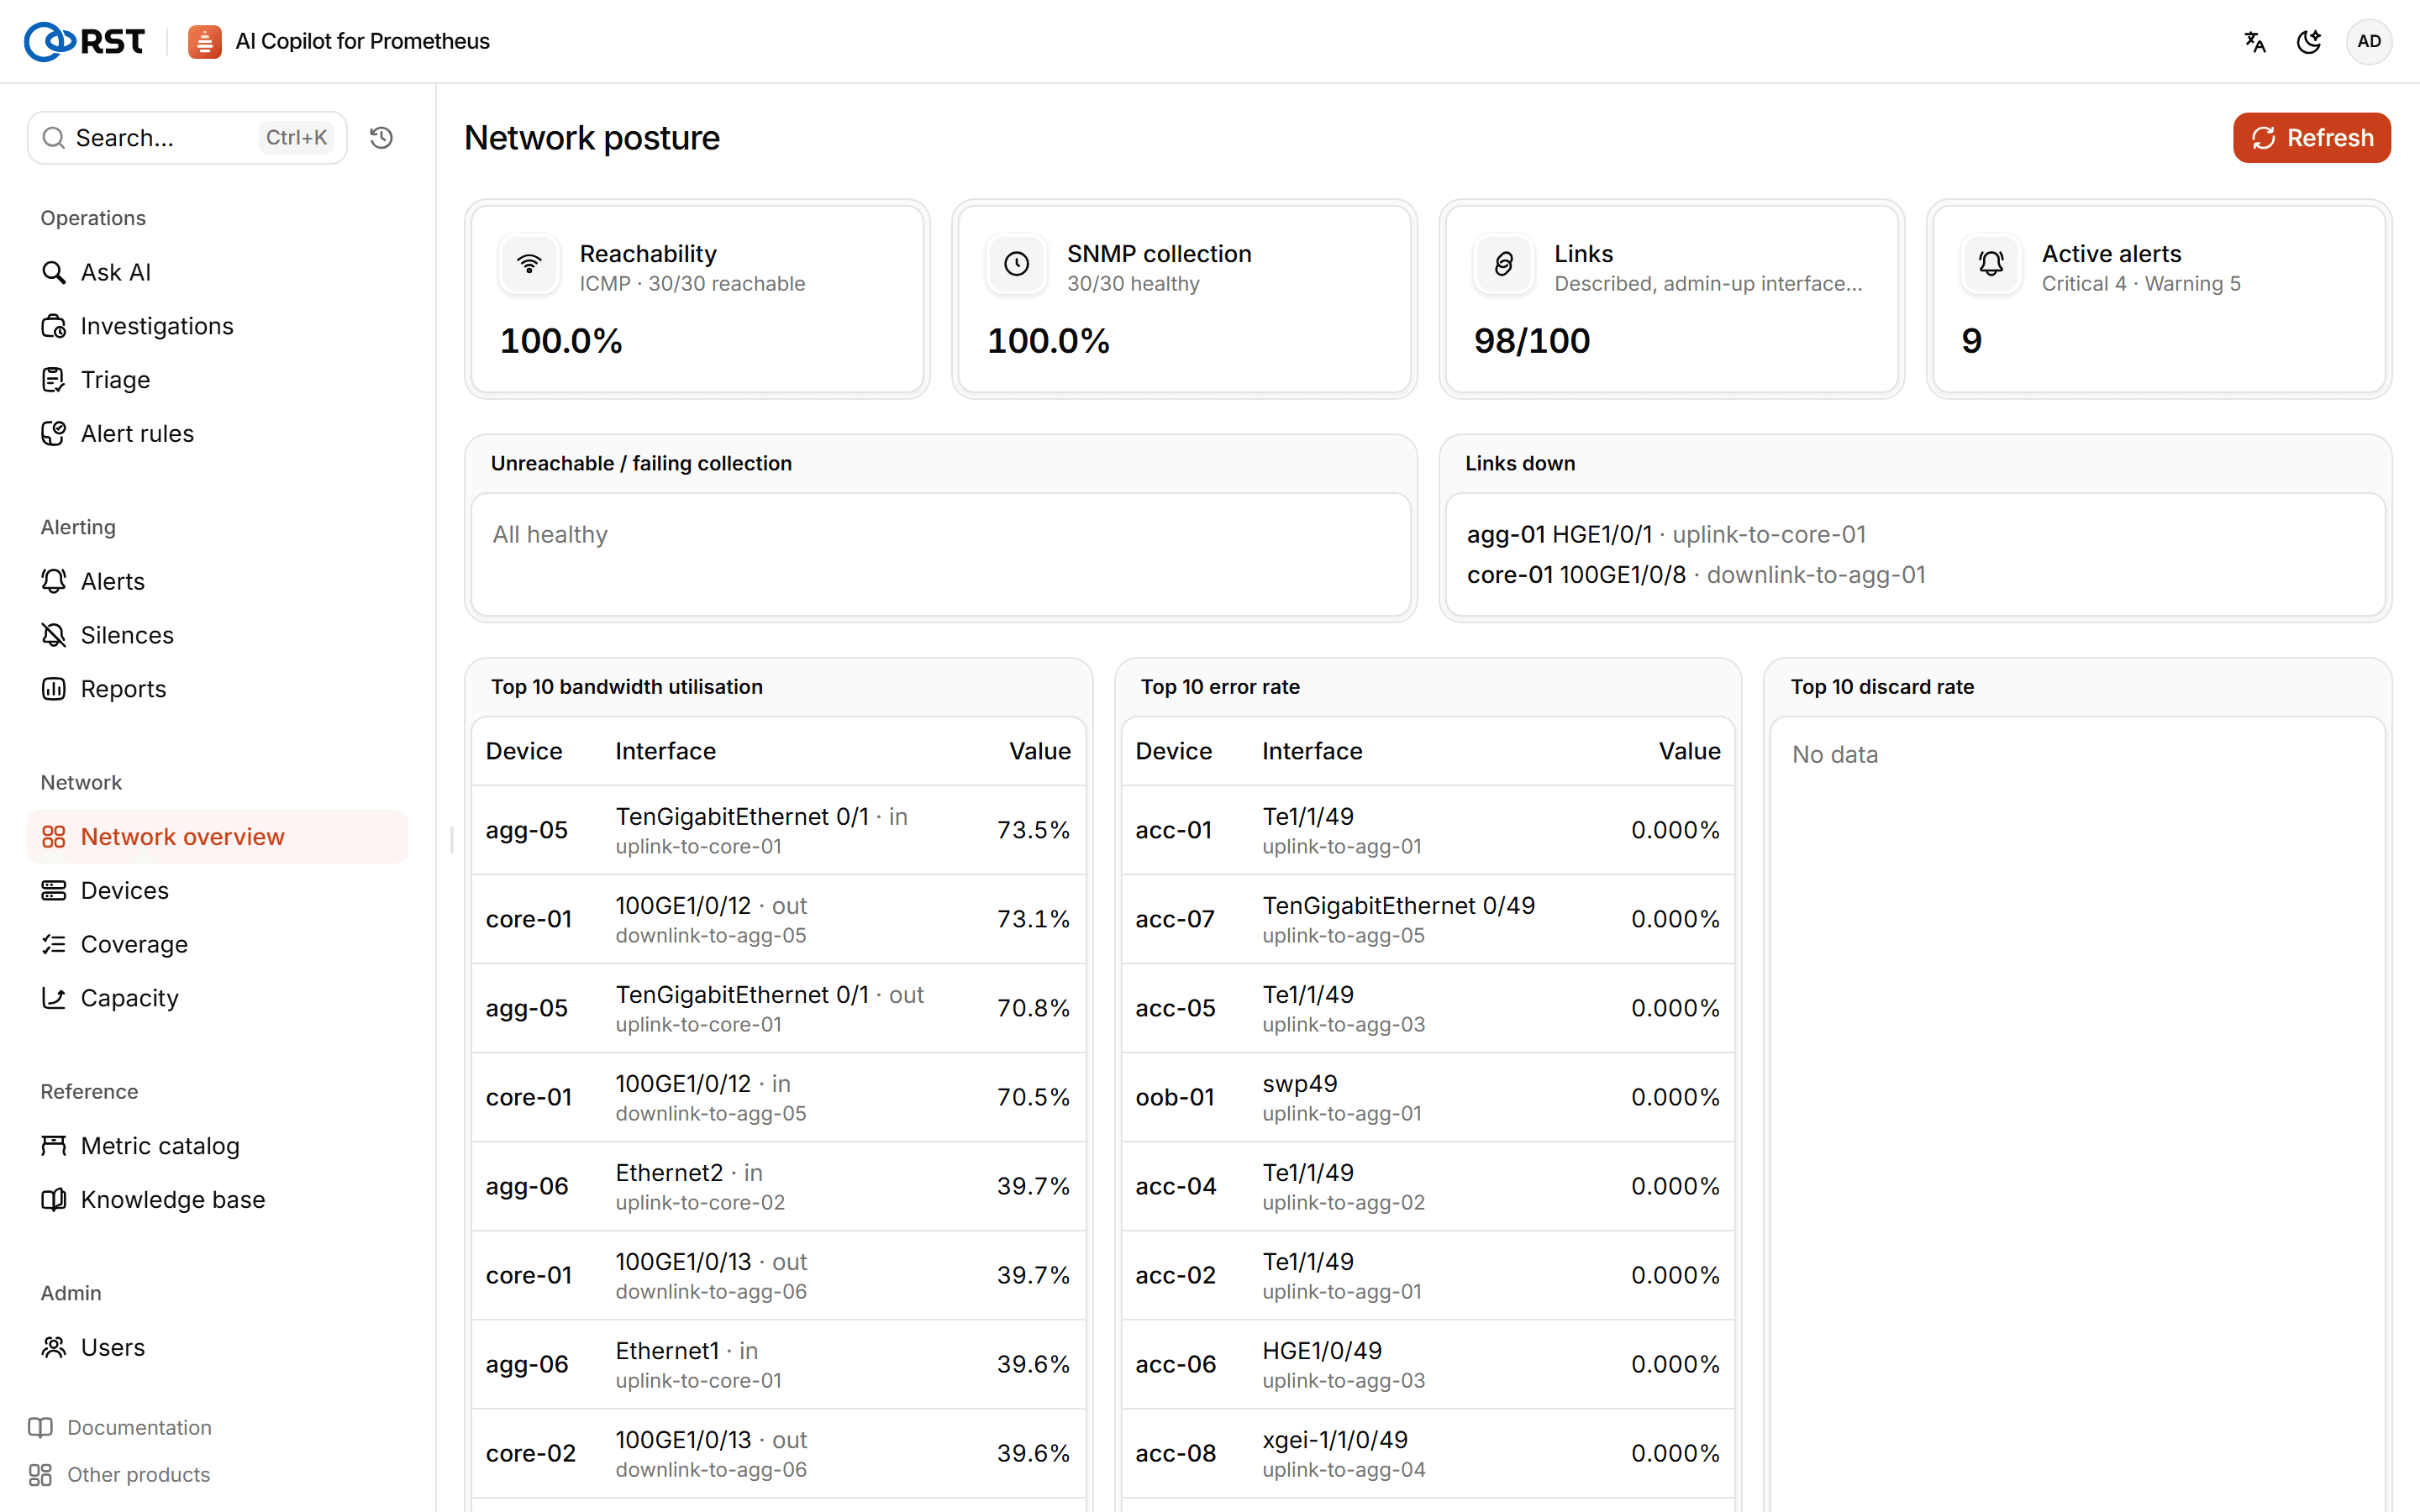
| Panel | Contents |
|---|---|
| Device reachability | Devices reachable by ICMP probes |
| SNMP collection | Devices being collected normally |
| Link status | Interfaces with a description and admin up that are down |
| Current alerts | Critical and warning alerts |
| MTTA, MTTR | Mean time to acknowledge and to resolve in the selected window |
| Top 10 | Interfaces with the highest bandwidth utilization and the highest loss |
| Problems | Links that are down, devices that are unreachable or not being collected, rules with the most alerts |
Flapping and noise
Needs a Professional license. Detects interface flapping (number of state changes and the peer) and makes two kinds of suggestions:
- Merging duplicate alerts: when the same alert fires many times on one device, or on several devices at once (possibly one upstream cause), it suggests an Alertmanager
group_by. - Inhibit rules: for example, inhibit the other alerts on a device while it is unreachable, or the flapping, error and loss alerts on an interface while it is down. The suggestions can be pasted into the Alertmanager configuration; the page shows whether each is already configured and how many current alerts it would inhibit.
Device inventory
Devices lists devices and interfaces. The network rule pack uses it to decide which interfaces should alert.
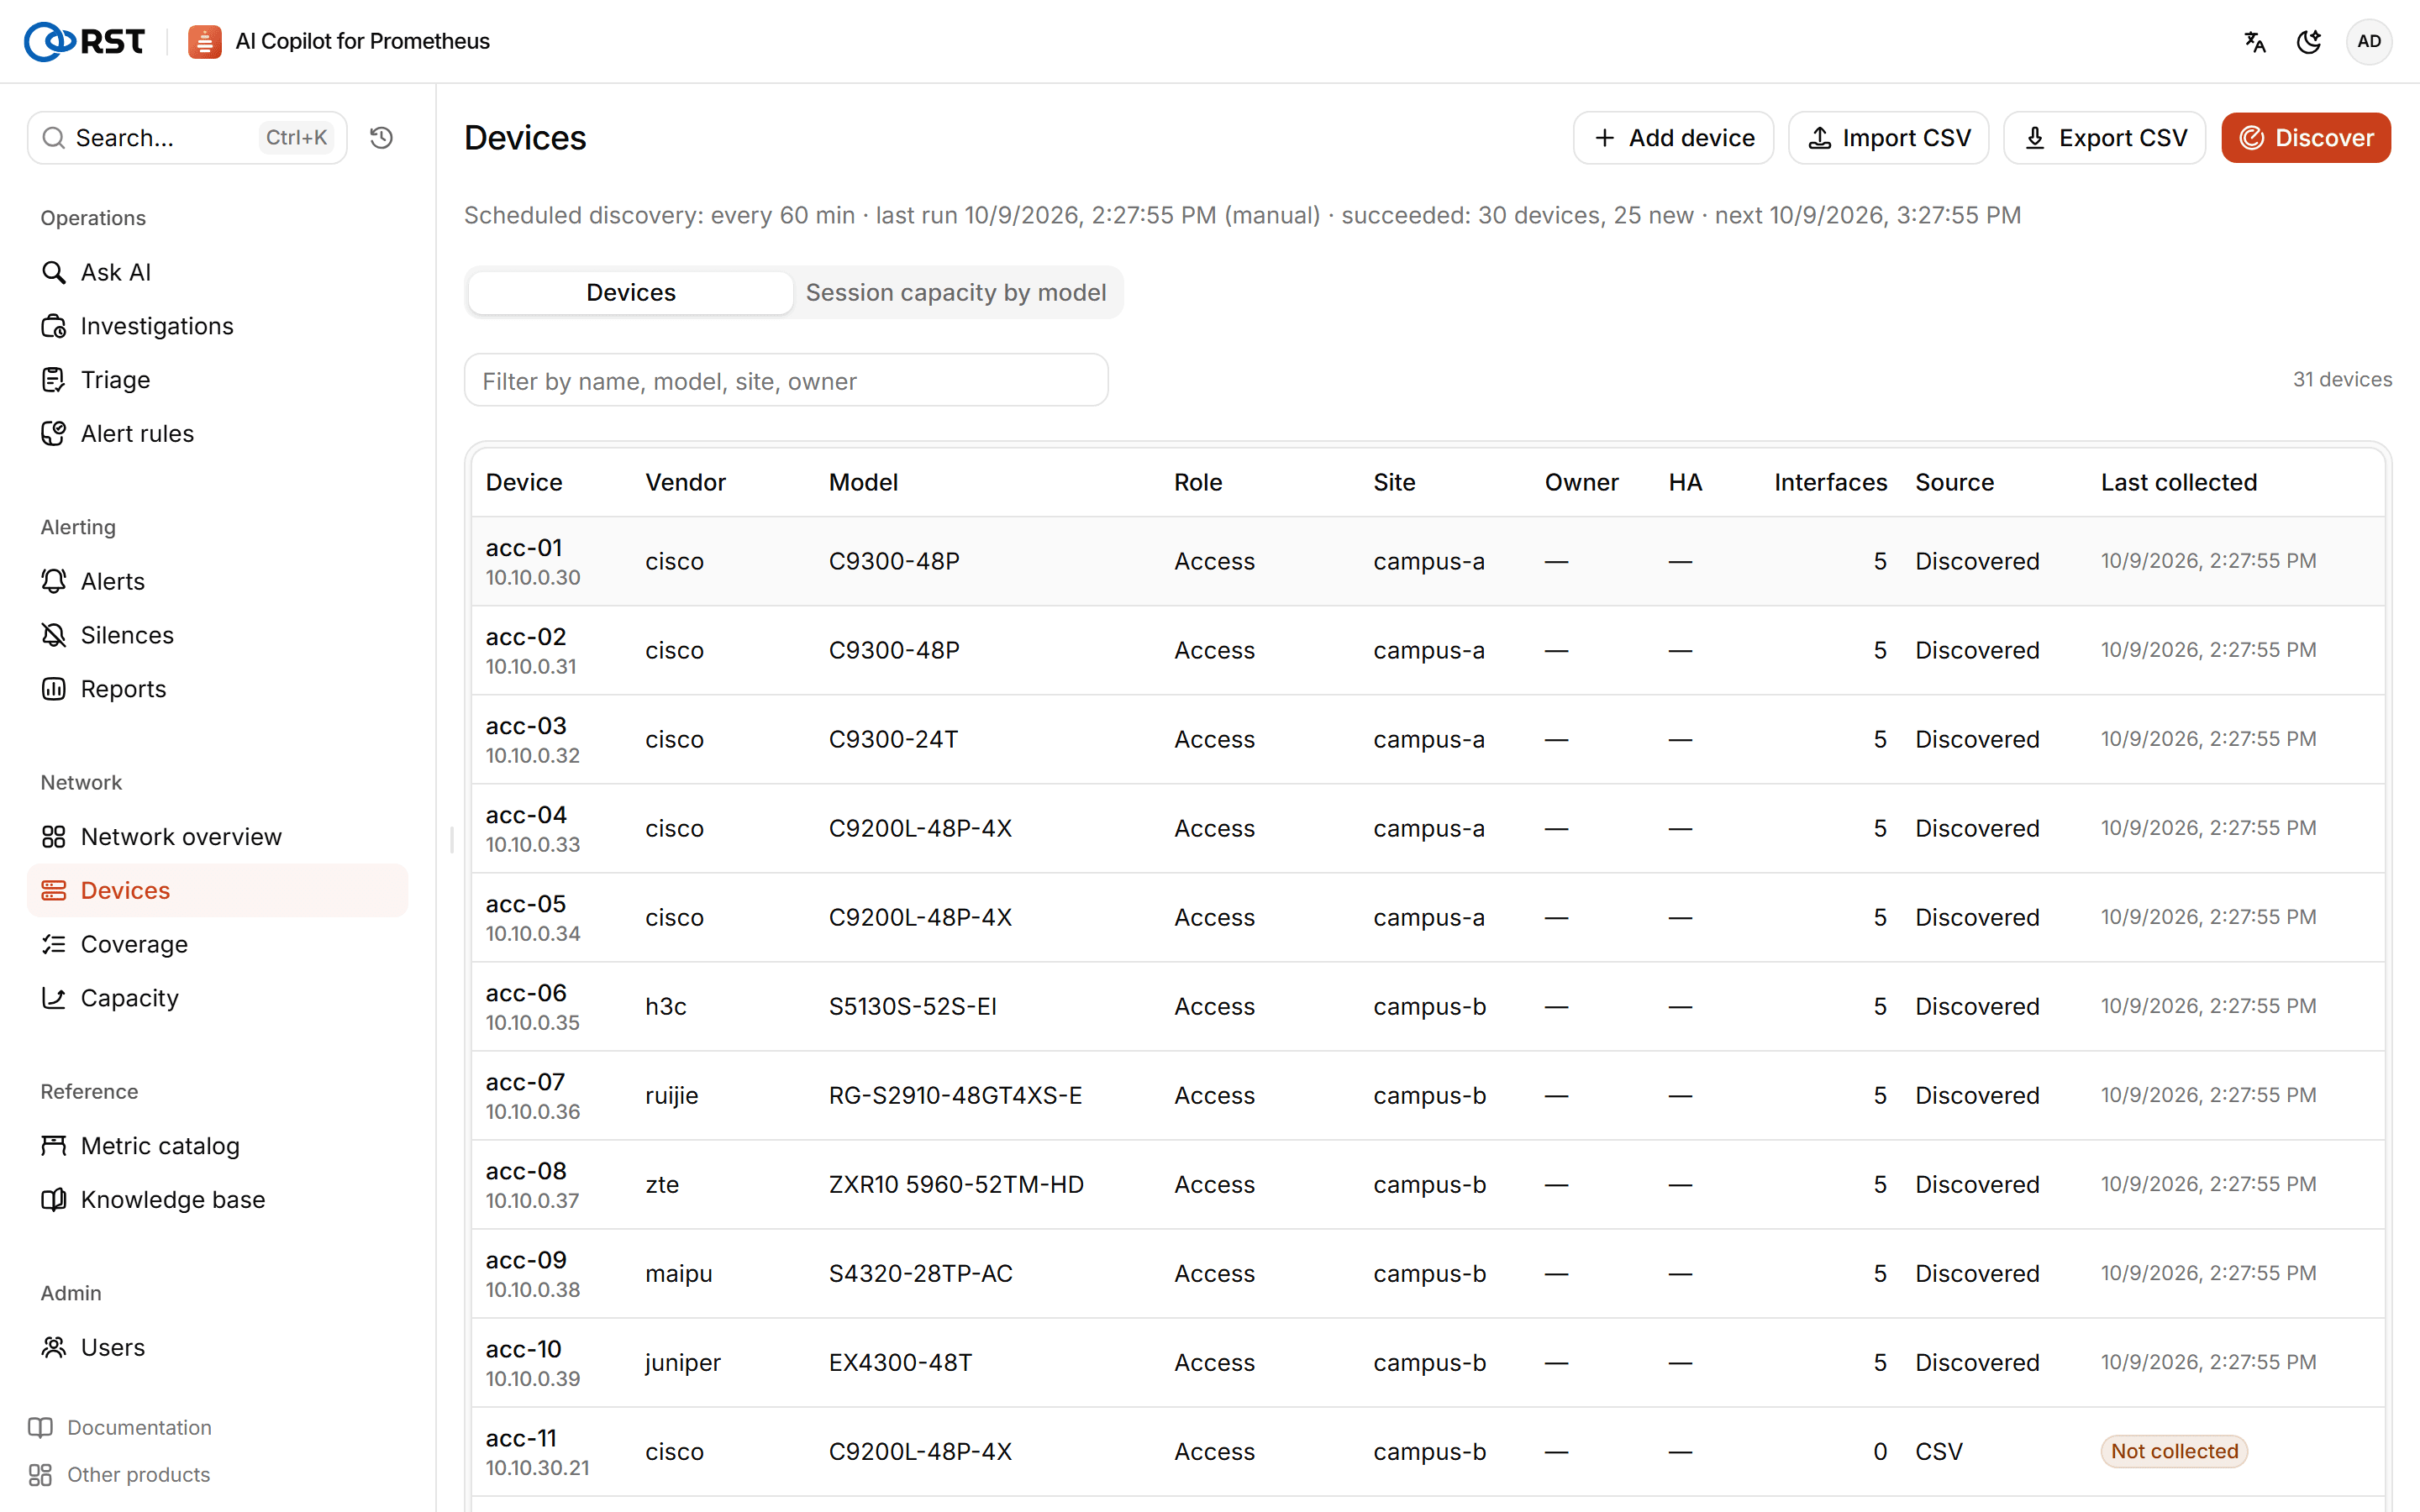
- Discover: finds devices and interfaces from Prometheus scrape targets and SNMP metrics and recognises vendors by
sysObjectID. It runs hourly by default and can be run by hand. Devices whose recognised vendor disagrees with their scrape labels, or that return nosysObjectID, are listed separately. - Import CSV, Export CSV and adding devices: maintain the device name, management IP, vendor, model, role, site, rack, owner and whether HA is configured. Fields you edit by hand are not overwritten by discovery.
- Interface alert policy: each interface is default, key or ignored. Default: only interfaces with a description alert when they go down. Key: alerts even without a description. Ignored: no down, flapping, bandwidth or error alerts for the interface.
- Session capacity by model: the session limit for each firewall model. The preset values come from vendor specifications; check them.
- HA unit problems are only reported for devices marked as having HA configured.
The inventory is exported to Prometheus at /metrics/inventory, and the rule pack relies on it; see Data sources.
Monitoring coverage
Coverage compares the inventory, the scrape targets and the loaded alert rules to find gaps in monitoring. Check again refreshes it.
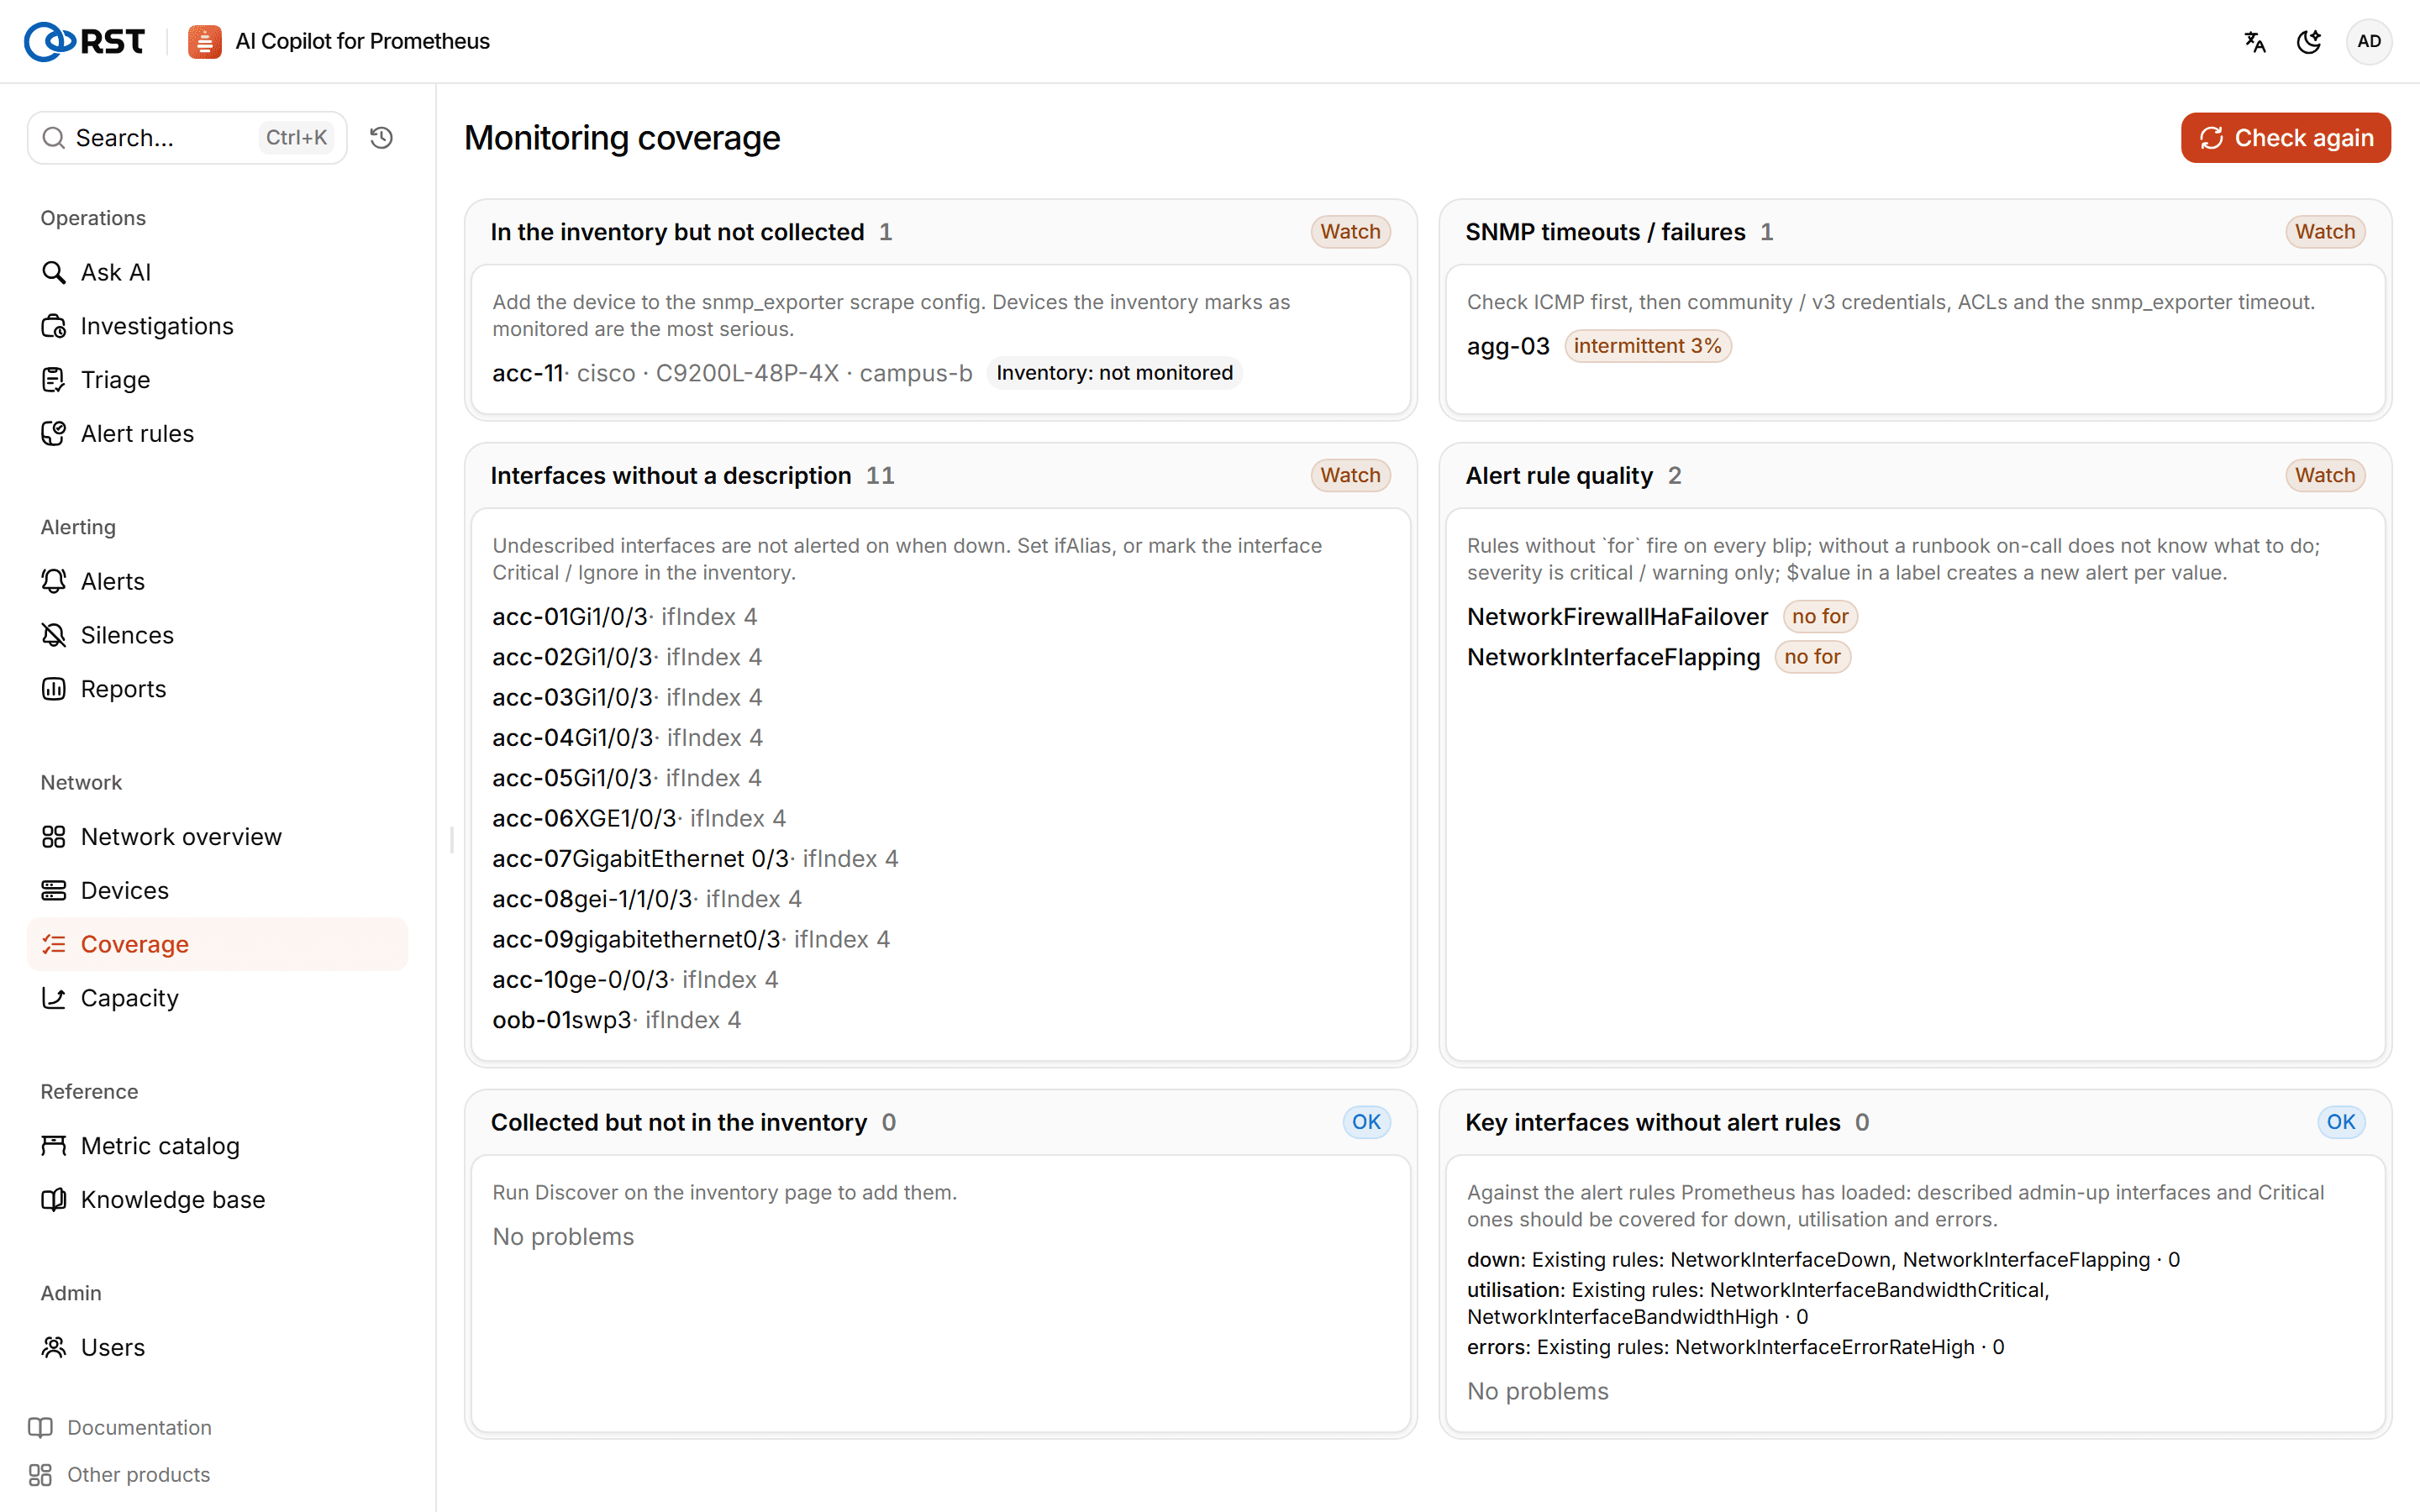
| Check | What to do |
|---|---|
| In the inventory but not collected | Add the device to the snmp_exporter scrape configuration. Devices marked as managed but not collected are the most serious |
| Collected but not in the inventory | Run discovery on the Devices page |
| Interfaces without a description | Undescribed interfaces do not alert when they go down by default. Add an ifAlias, or set the interface to key or ignored in the inventory |
| Key interfaces without alert rules | Interfaces with a description and admin up, and key interfaces, should all have down and utilization rules |
| Alert rule quality | Rules without for fire on every blip; rules without a runbook leave on-call guessing; severities other than critical or warning; labels containing $value cause high cardinality |
Alert rules
Generate alert rules from plain language, validate and submit them for approval, write them back to Prometheus with a hot reload, roll back by version, and install the built-in network rule pack.
Capacity
Predict from history when link bandwidth, CPU, memory, temperature and firewall sessions will reach their thresholds. Needs a Professional license.