

Capacity
Predict from history when link bandwidth, CPU, memory, temperature and firewall sessions will reach their thresholds. Needs a Professional license.
Capacity needs a Professional or Enterprise license. Without one you can open the page, and running it offers the upgrade.
How it works
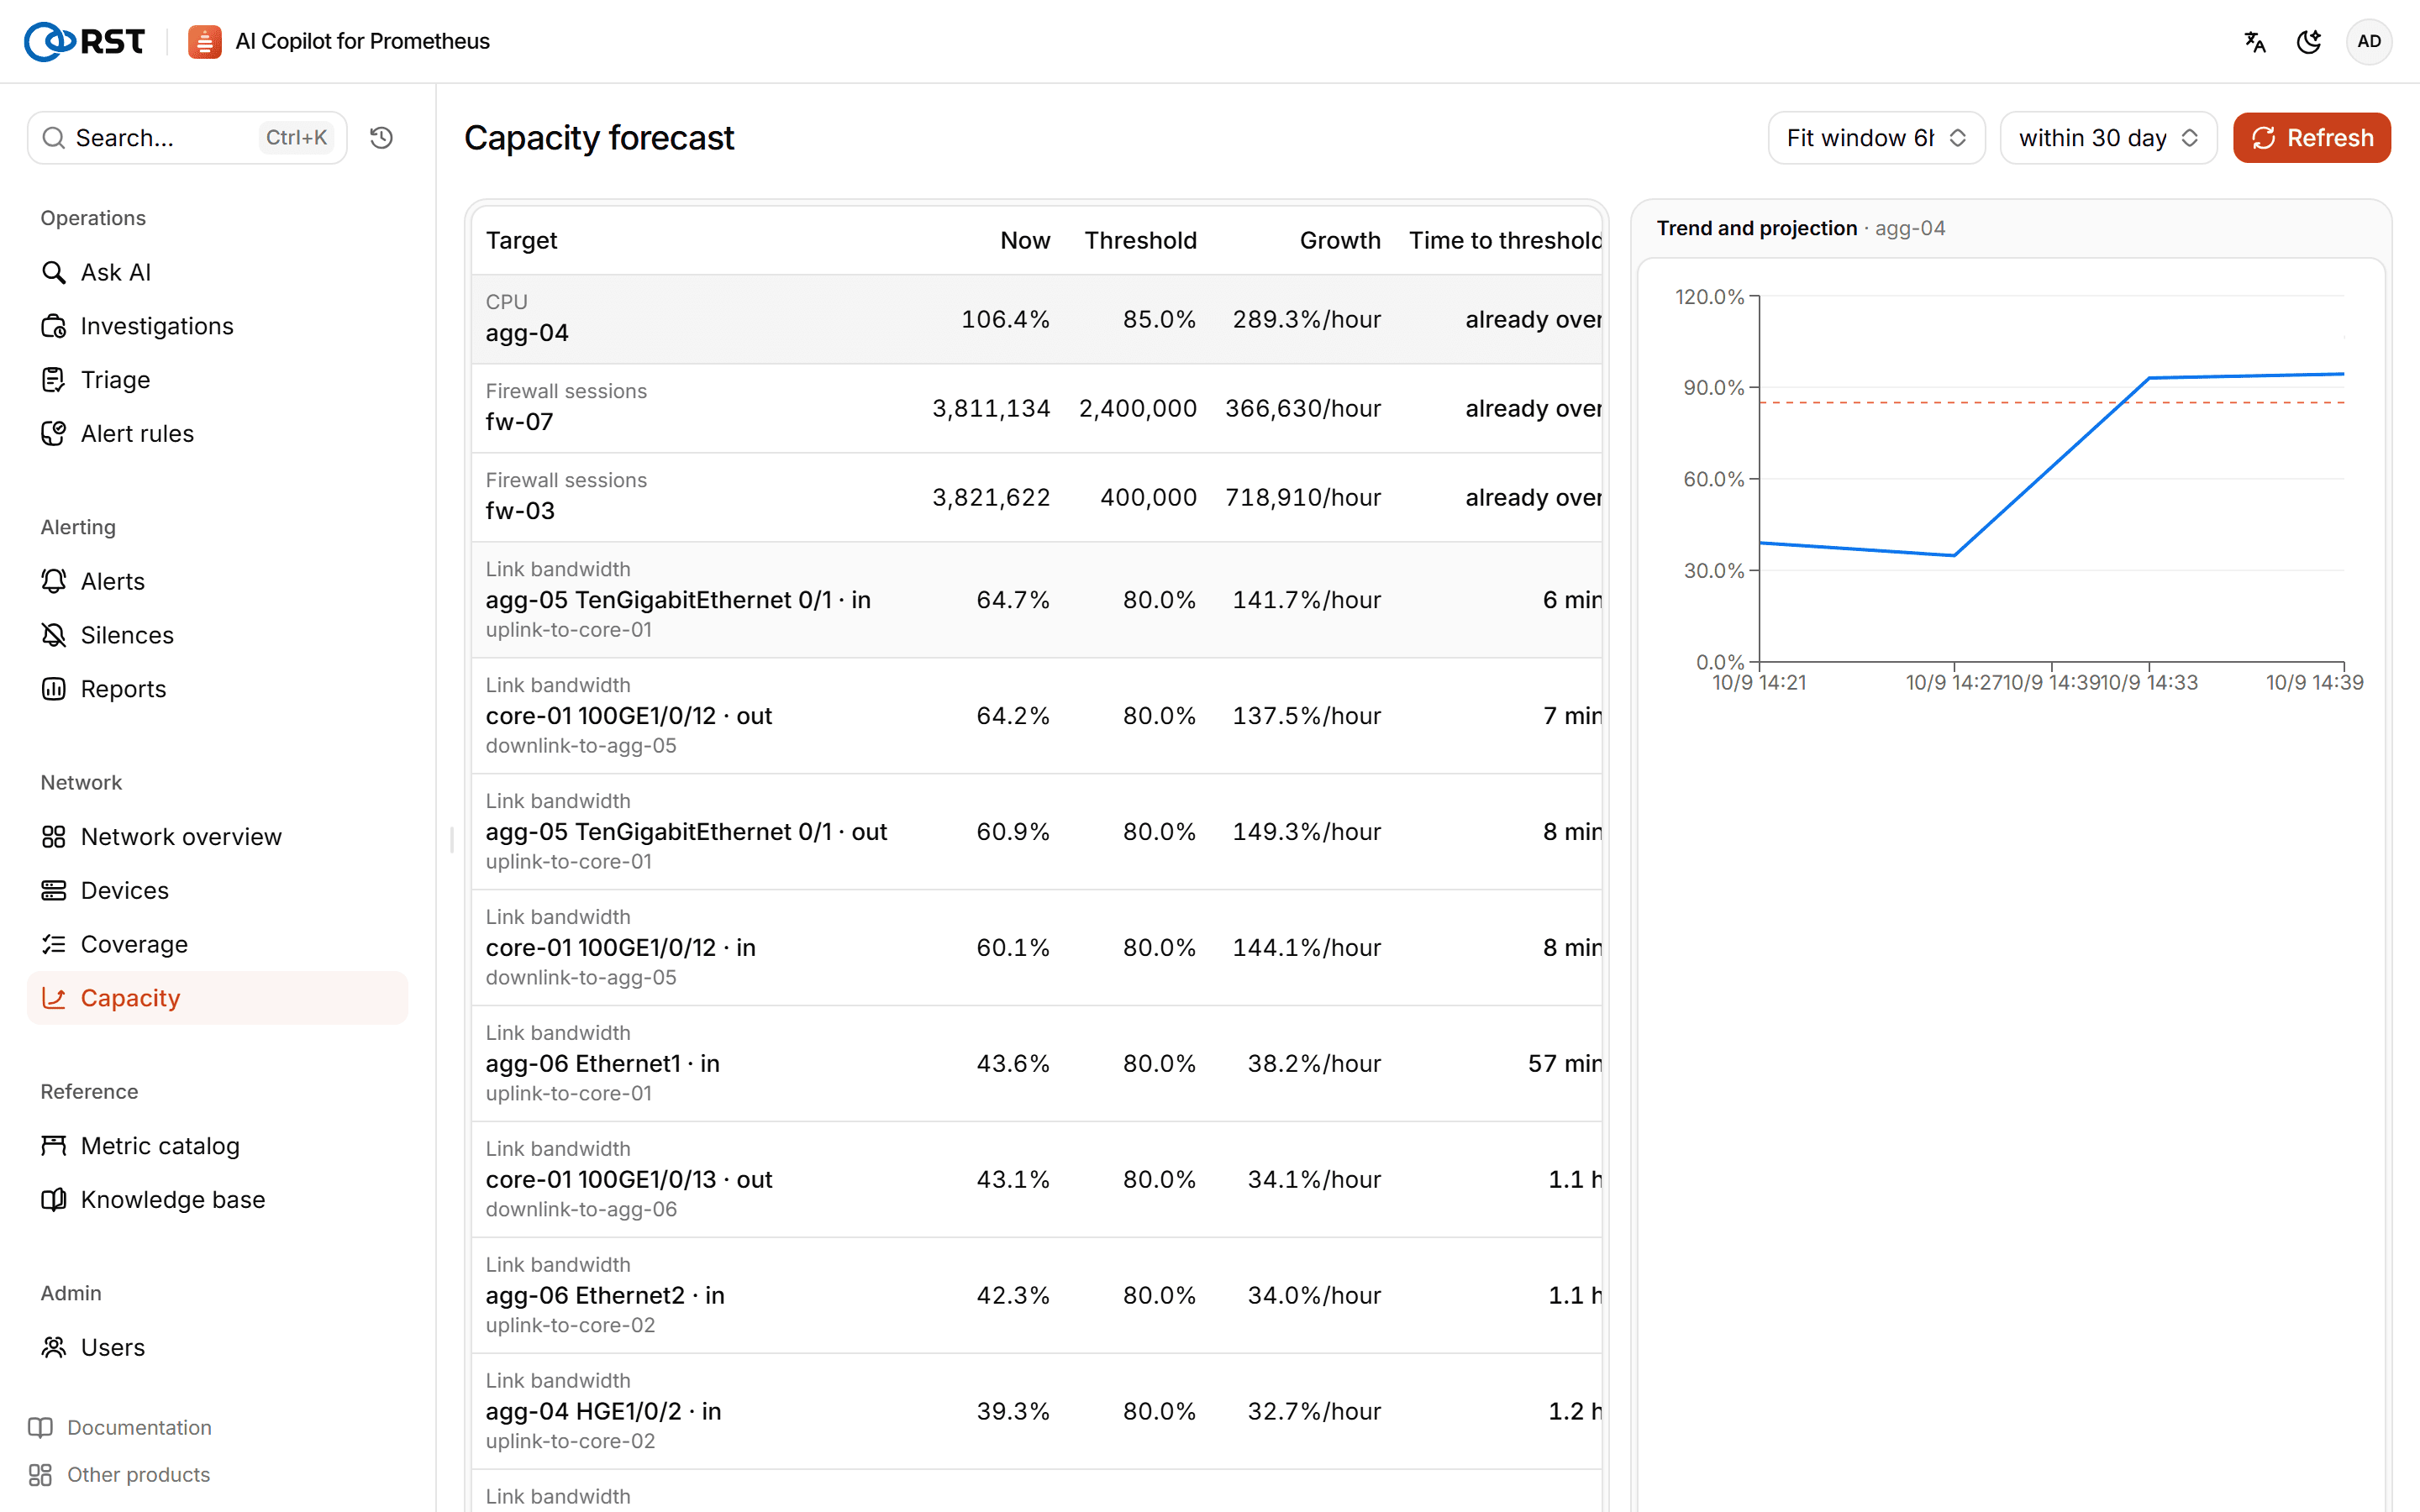
For each series, a linear fit is made over the fit window (Prometheus's predict_linear and deriv) and extrapolated to the threshold at the current slope. Only objects that are growing and will reach the threshold within the horizon are listed, soonest first.
| Option | Values |
|---|---|
| Fit window | 1 hour, 6 hours, 1 day, 7 days |
| Horizon | 30 days by default |
| Object | Threshold |
|---|---|
| Link bandwidth | 80% utilization |
| CPU | 85% |
| Memory | 90% |
| Temperature | 75 °C |
| Firewall sessions | 80% of the session limit |
The firewall session limit comes from the session capacity by model table in the device inventory first, then from the maximum the device reports. Firewalls with neither are not forecast; the page lists them so you can add the model's limit on Devices.
Results
The list shows the object, its current value, the threshold, the growth rate and when the threshold will be reached. Click a row for its trend: the solid line is the actual value, the dashed line extrapolates the fitted slope to the threshold.
The longer the history, the steadier the forecast. A fit window longer than the history you have mostly reflects short-term swings.
The capacity-risk section of daily, weekly and monthly reports uses the same method, fitted over the report period; see Reports.
Network
The network overview, the device inventory with per-interface alert policy, the monitoring-coverage baseline, and interface flapping and alert noise reduction.
Monitoring health
Check the health of Prometheus and Alertmanager themselves, with a verdict and advice for each check and an AI readout that ties them together. Needs a Professional license.