

Settings
Data source connections, masking before data reaches the model, and versions and online updates.
Settings is in the Admin group at the bottom of the sidebar and opens as a page tab. Admins and operators can change it.
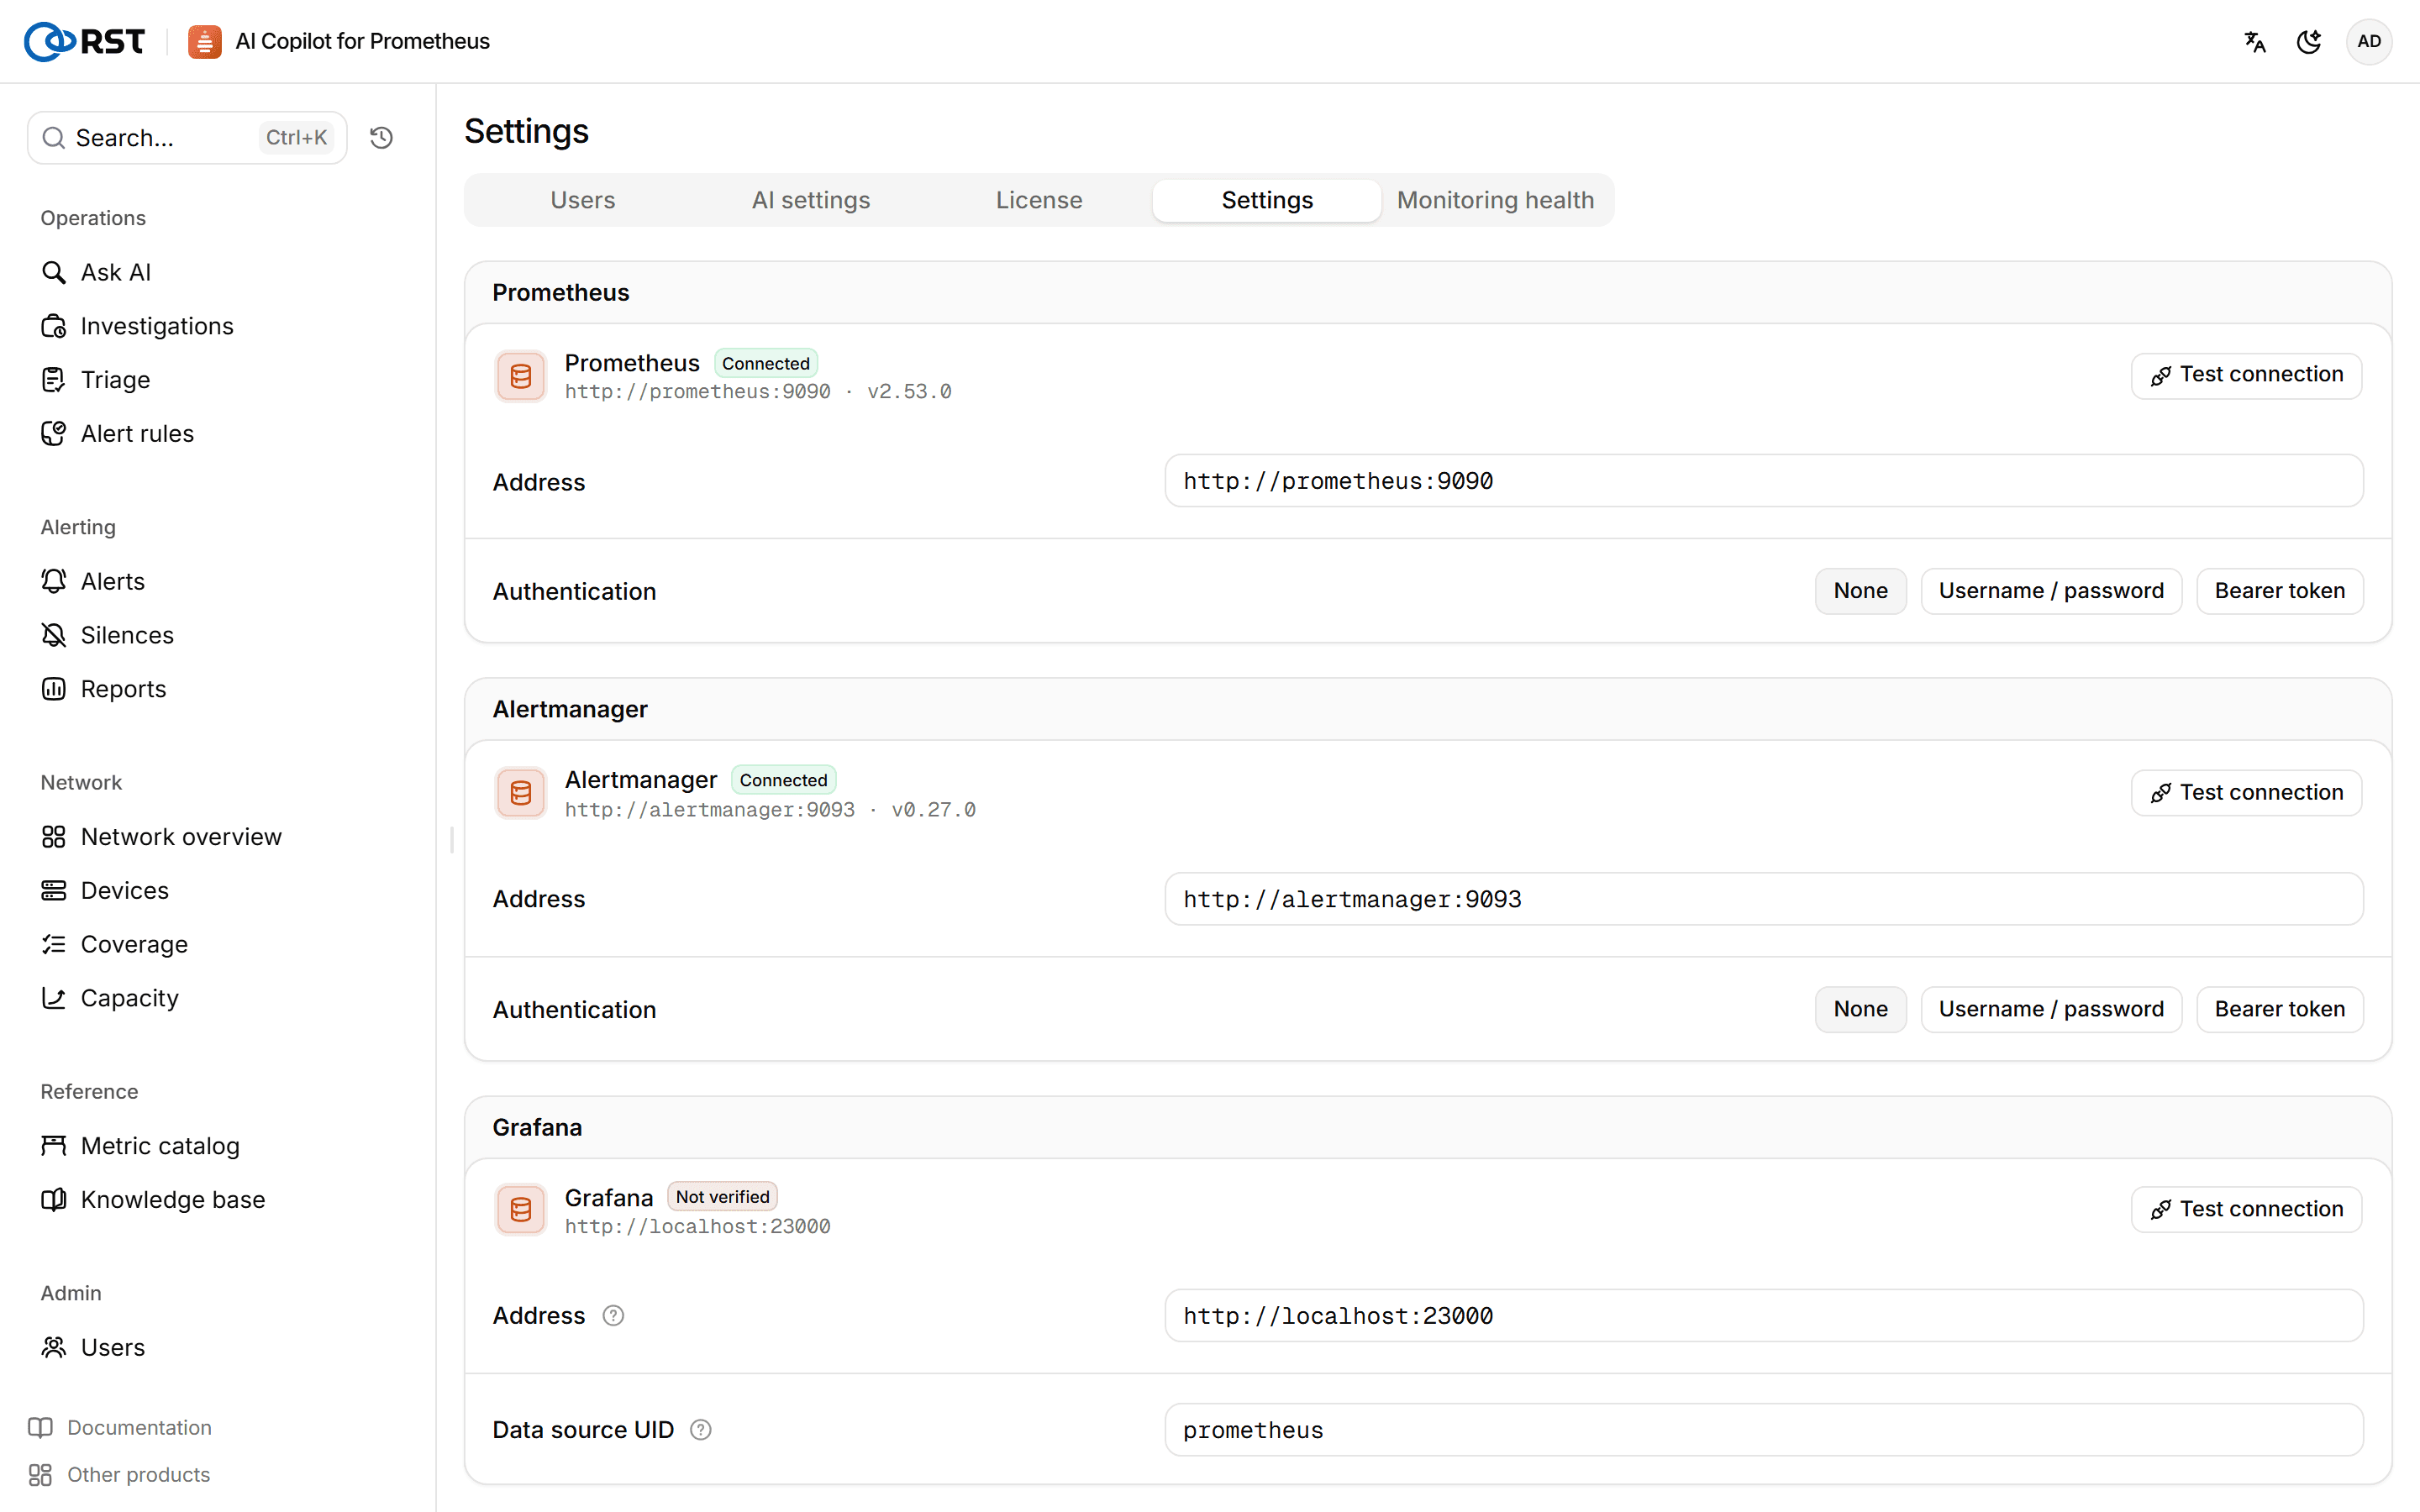
Data sources
One card each for Prometheus, Alertmanager and Grafana.
- Prometheus and Alertmanager: address, authentication (none, user name and password, or a Bearer token), and whether to verify the server certificate. You can turn verification off for self-signed certificates, but keep it on in production; for a private CA see Configuration.
- Grafana: the address the operators' browsers use, and the UID of the Prometheus data source (blank means
prometheus), for links from results to Grafana Explore.
After changing connection settings, click Test connection; you can only save once it passes. Prometheus is the only data source required before use: metrics come from it, alerts from Alertmanager.
Data masking
The masking level applied before data reaches the model. All three levels are available in every edition:
| Level | For | Effect |
|---|---|---|
| Cloud | Public model services | Default and strongest; IPs are masked to /16 |
| Private | Self-hosted models (vLLM, Ollama and so on) | Moderate; IPs are masked to /24 |
| Air-gapped | Fully offline sites with a local model | No masking |
Version and updates
Shows the current version, the product identifier and the update source. The gateway checks for a new version once a day, or click Check now. When there is one, click Download and stage: the gateway verifies the signature and every file before staging, and an operator then runs the update script on the host; see Upgrades, rollback and backups.
Offline sites do not reach the update source and upgrade with a new bundle.