

Reports
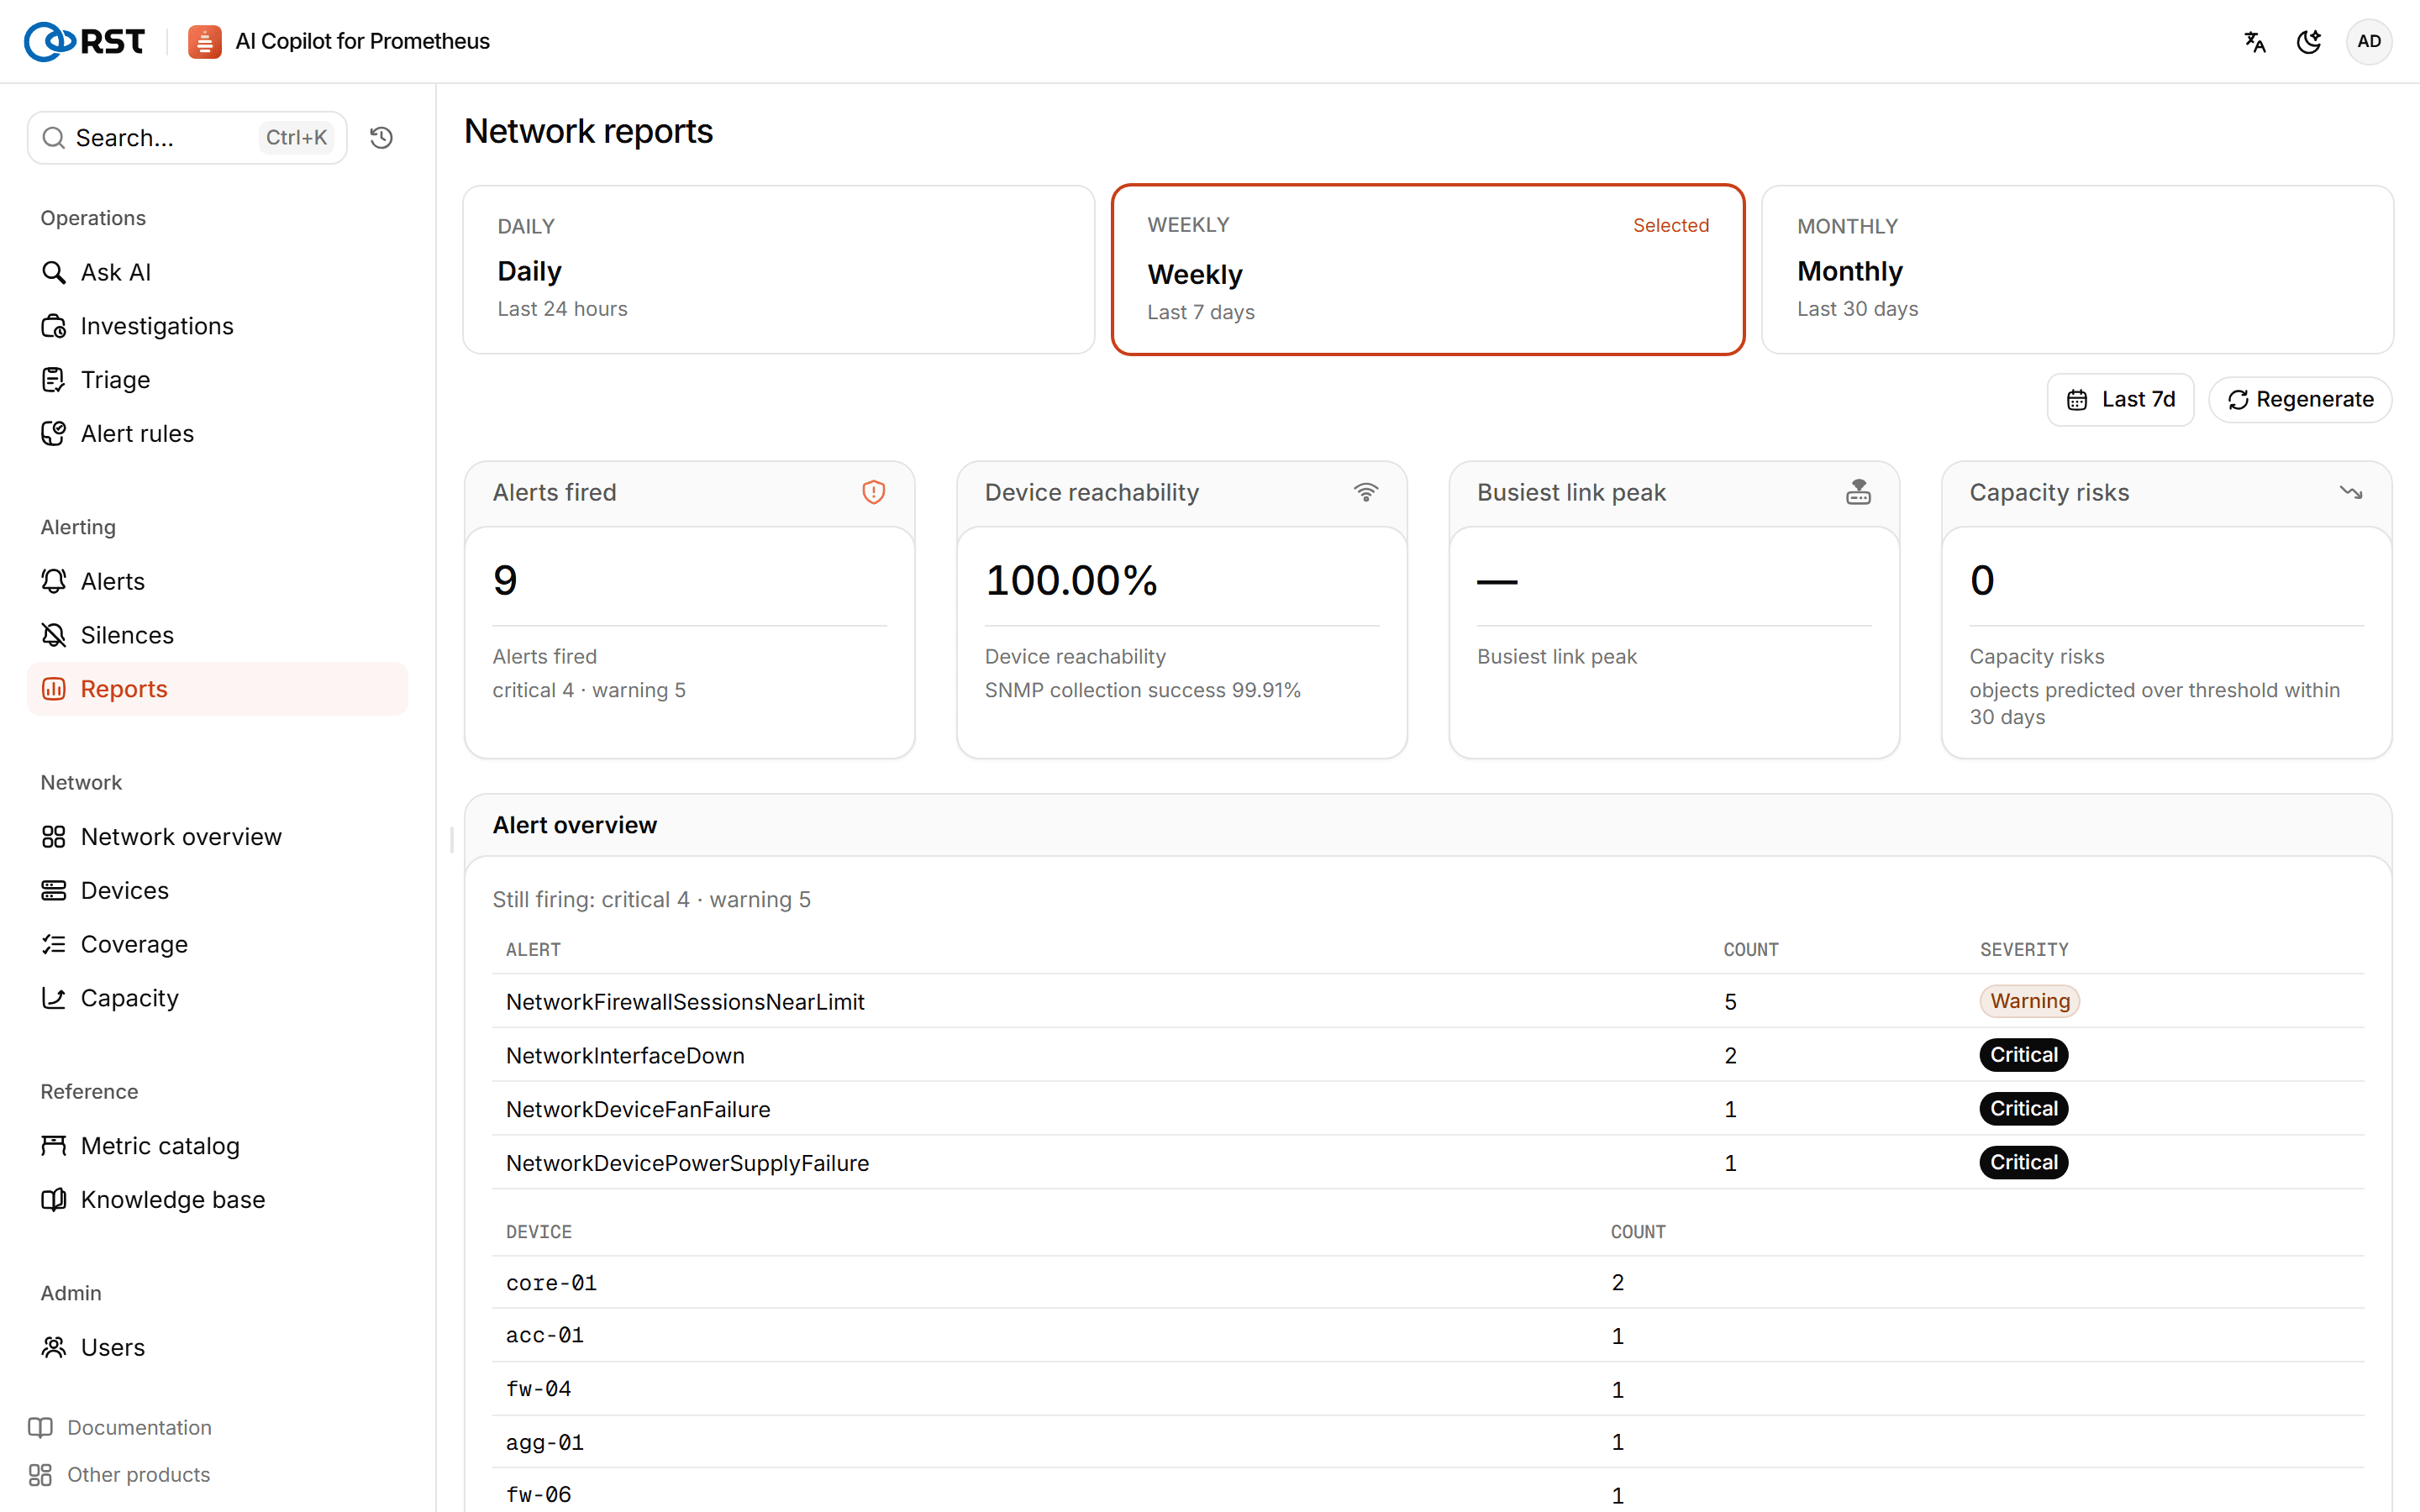
Daily, weekly and monthly network reports: alerts, the most utilized links, errors and discards, device availability, capacity risk and AI investigation findings. Needs a Professional license.
Reports needs a Professional or Enterprise license. Without one you can open the page, and running it offers the upgrade.
Generating
Pick a period: Daily (last 24 hours), Weekly (last 7 days) or Monthly (last 30 days). The gateway summarizes Prometheus and the alert history. You can regenerate at any time. If a data source fails, the top of the report lists what is missing.
Contents
| Section | Contents |
|---|---|
| Summary | Alerts fired (critical, warning), device reachability and SNMP collection success, highest link peak, number of capacity risks |
| Alerts | Alerts still open, alerts by count, the devices and interfaces involved |
| Top utilized links | Links with the highest peak and average utilization |
| Errors and discards | Interfaces with the most errors and discards |
| Device availability | Devices below 100% reachability or collection success |
| Capacity risk | Fits the trend over the report period (1 day daily, 7 days weekly, 30 days monthly) and extrapolates; links, firewall sessions and device resources that will reach their thresholds come first. Objects with less history than the fit window are marked as insufficient data and get no forecast |
| AI investigation findings | Investigation conclusions from the period |
Download Markdown or Download JSON exports the full report.
Schedules and history
- Scheduled generation: reports are generated and archived on schedule and delivered to destinations that subscribe to that period under Notifications. The send time and time zone are set in the schedule on the Notifications page.
- Report history: manual and scheduled reports are archived in the database and can be viewed and exported at any time. Periods missed while the gateway was down are generated after it starts.
Metric catalog and knowledge base
Descriptions of each MIB's and vendor's metrics from the content pack, and the runbooks that investigations and queries cite.
Notifications
Deliver AI investigation findings, alert escalations and reports to Feishu, DingTalk, WeCom, email and webhooks; the delivery log and resending; audit forwarding.