

Alert rules
Generate alert rules from plain language, validate and submit them for approval, write them back to Prometheus with a hot reload, roll back by version, and install the built-in network rule pack.
Alert rules manages the rules the gateway writes into Prometheus: approved rules and the built-in network rule pack. Your existing rule files are not touched. The page has four tabs: New rule, Rules & approval, Versions & rollback and Network rule pack.
Generating rules with AI needs a Professional or Enterprise license. Writing rules by hand, approval, write-back and the rule pack work in every edition.
Write-back needs the rule directory RST_PROM_RULES_DIR, loaded by Prometheus, with --web.enable-lifecycle on; see Data sources. Without it, the page shows a notice: rules can be generated and submitted, but not written back after approval.
New rule
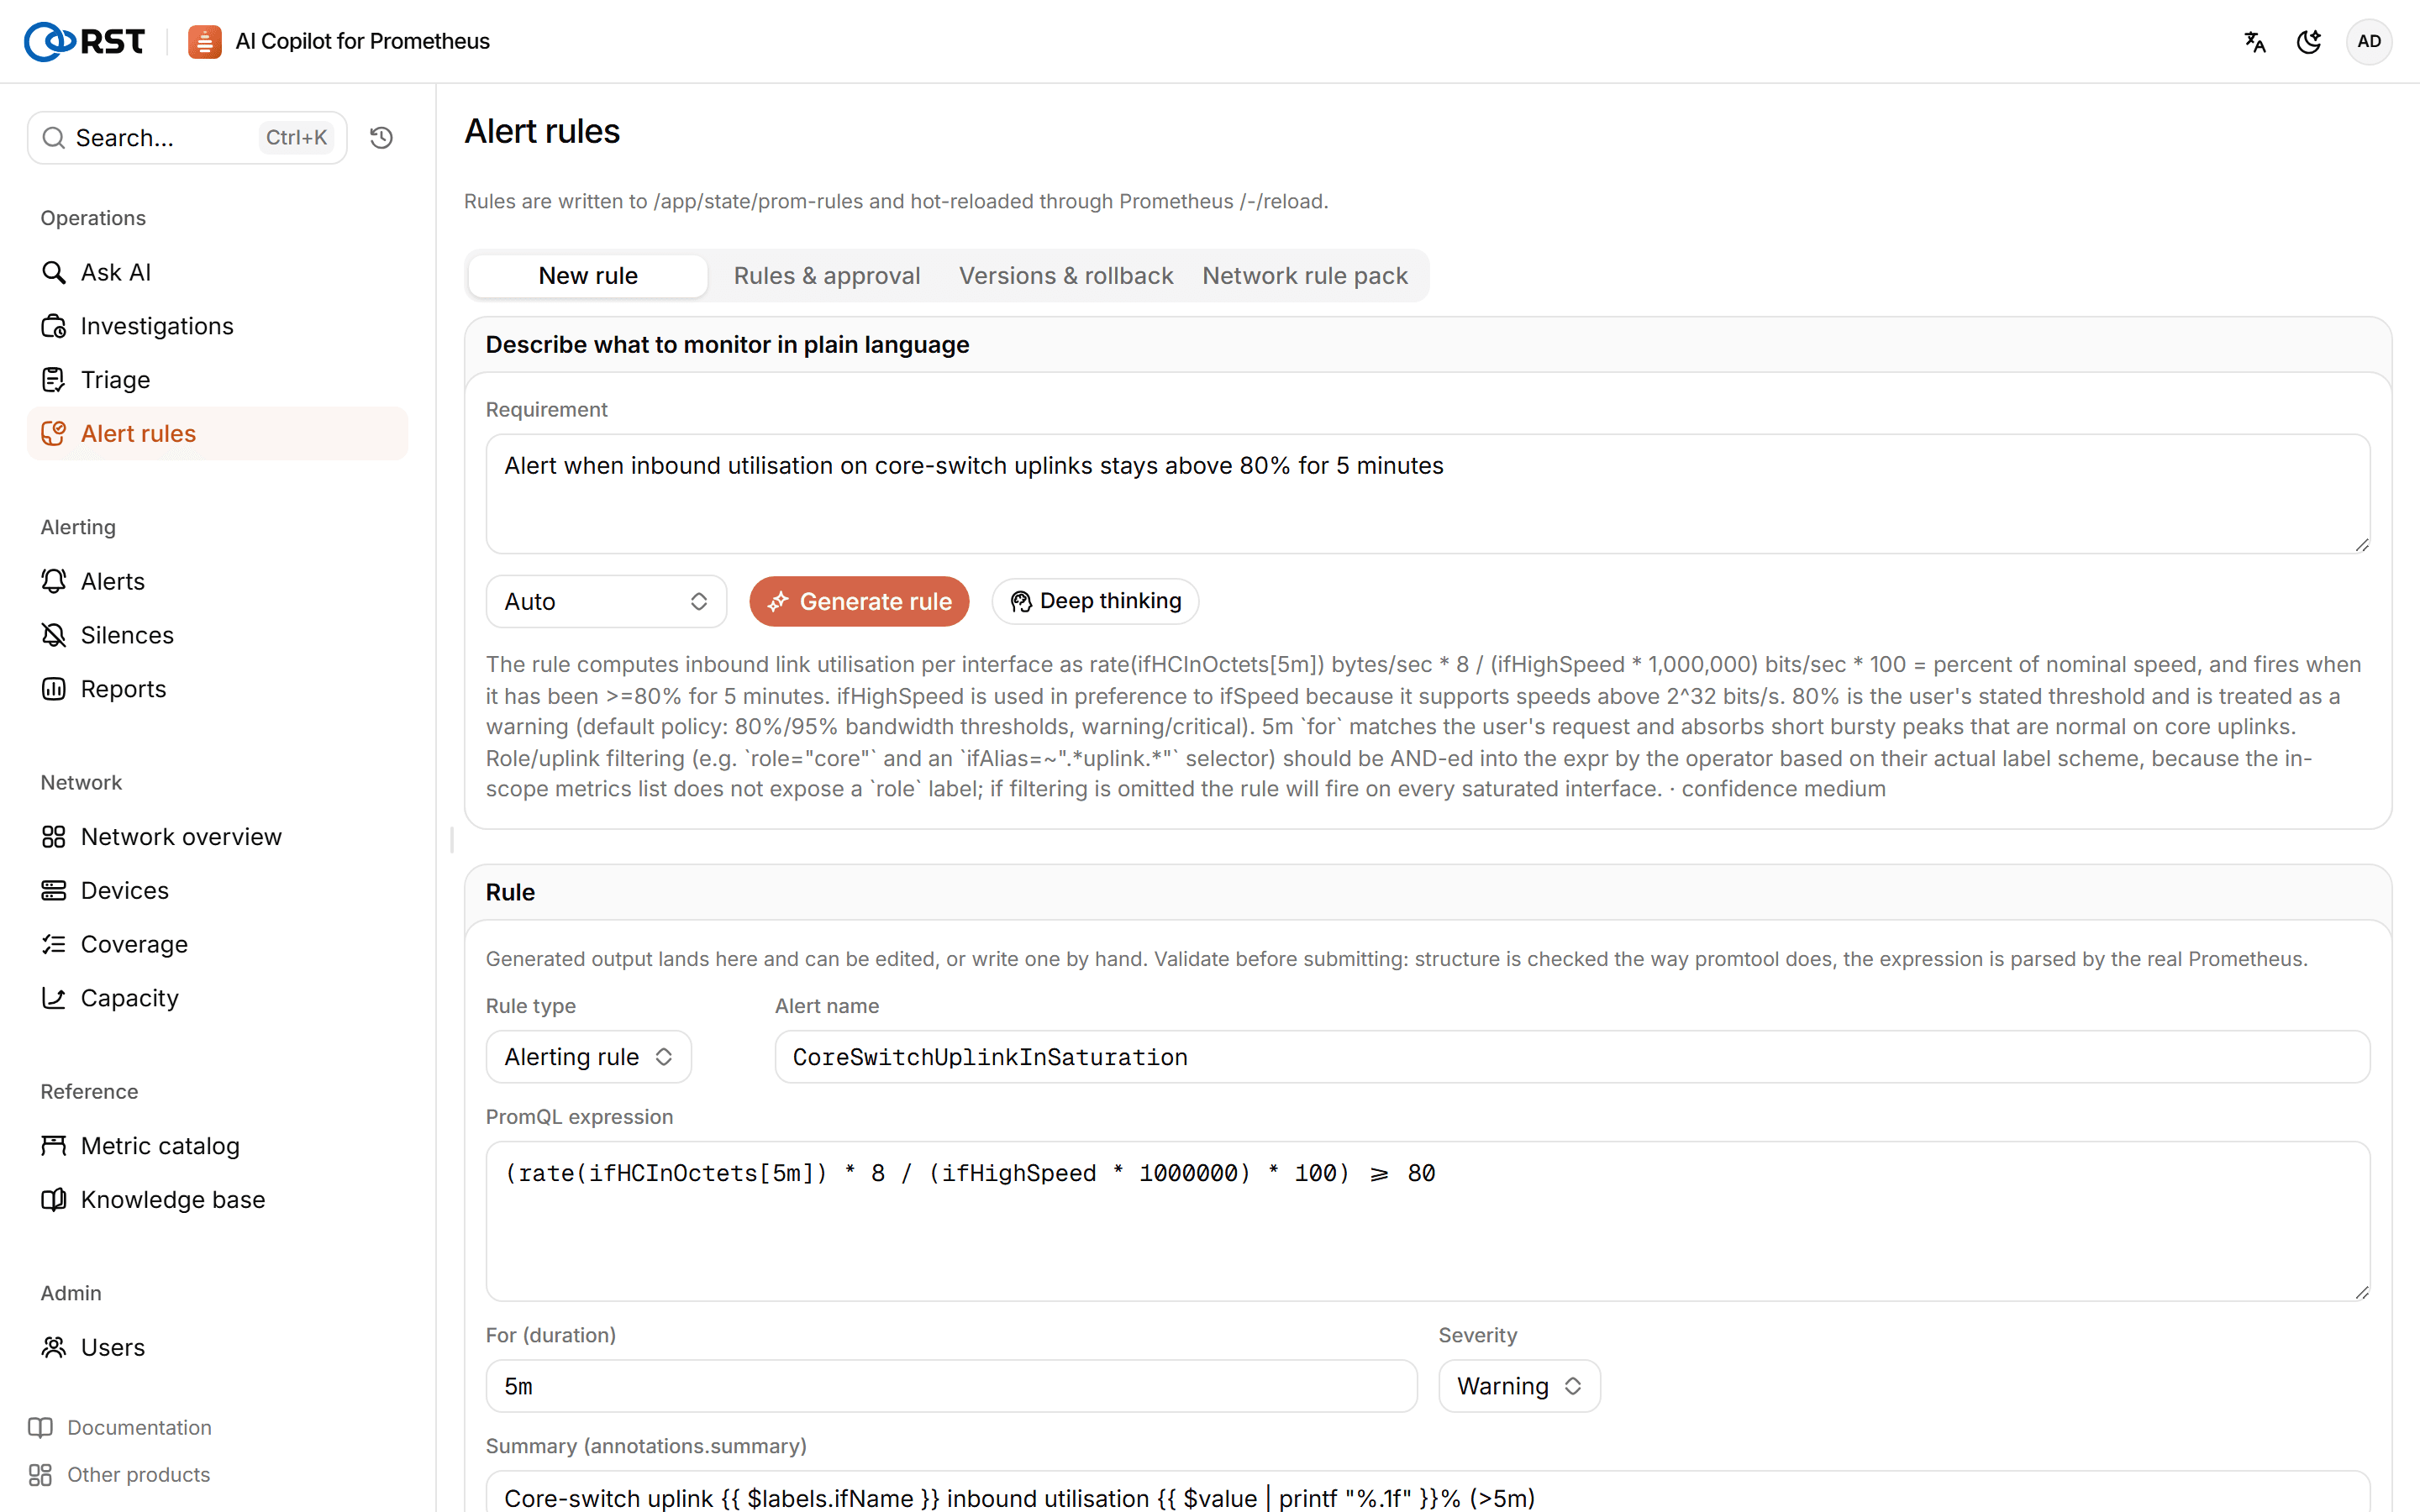
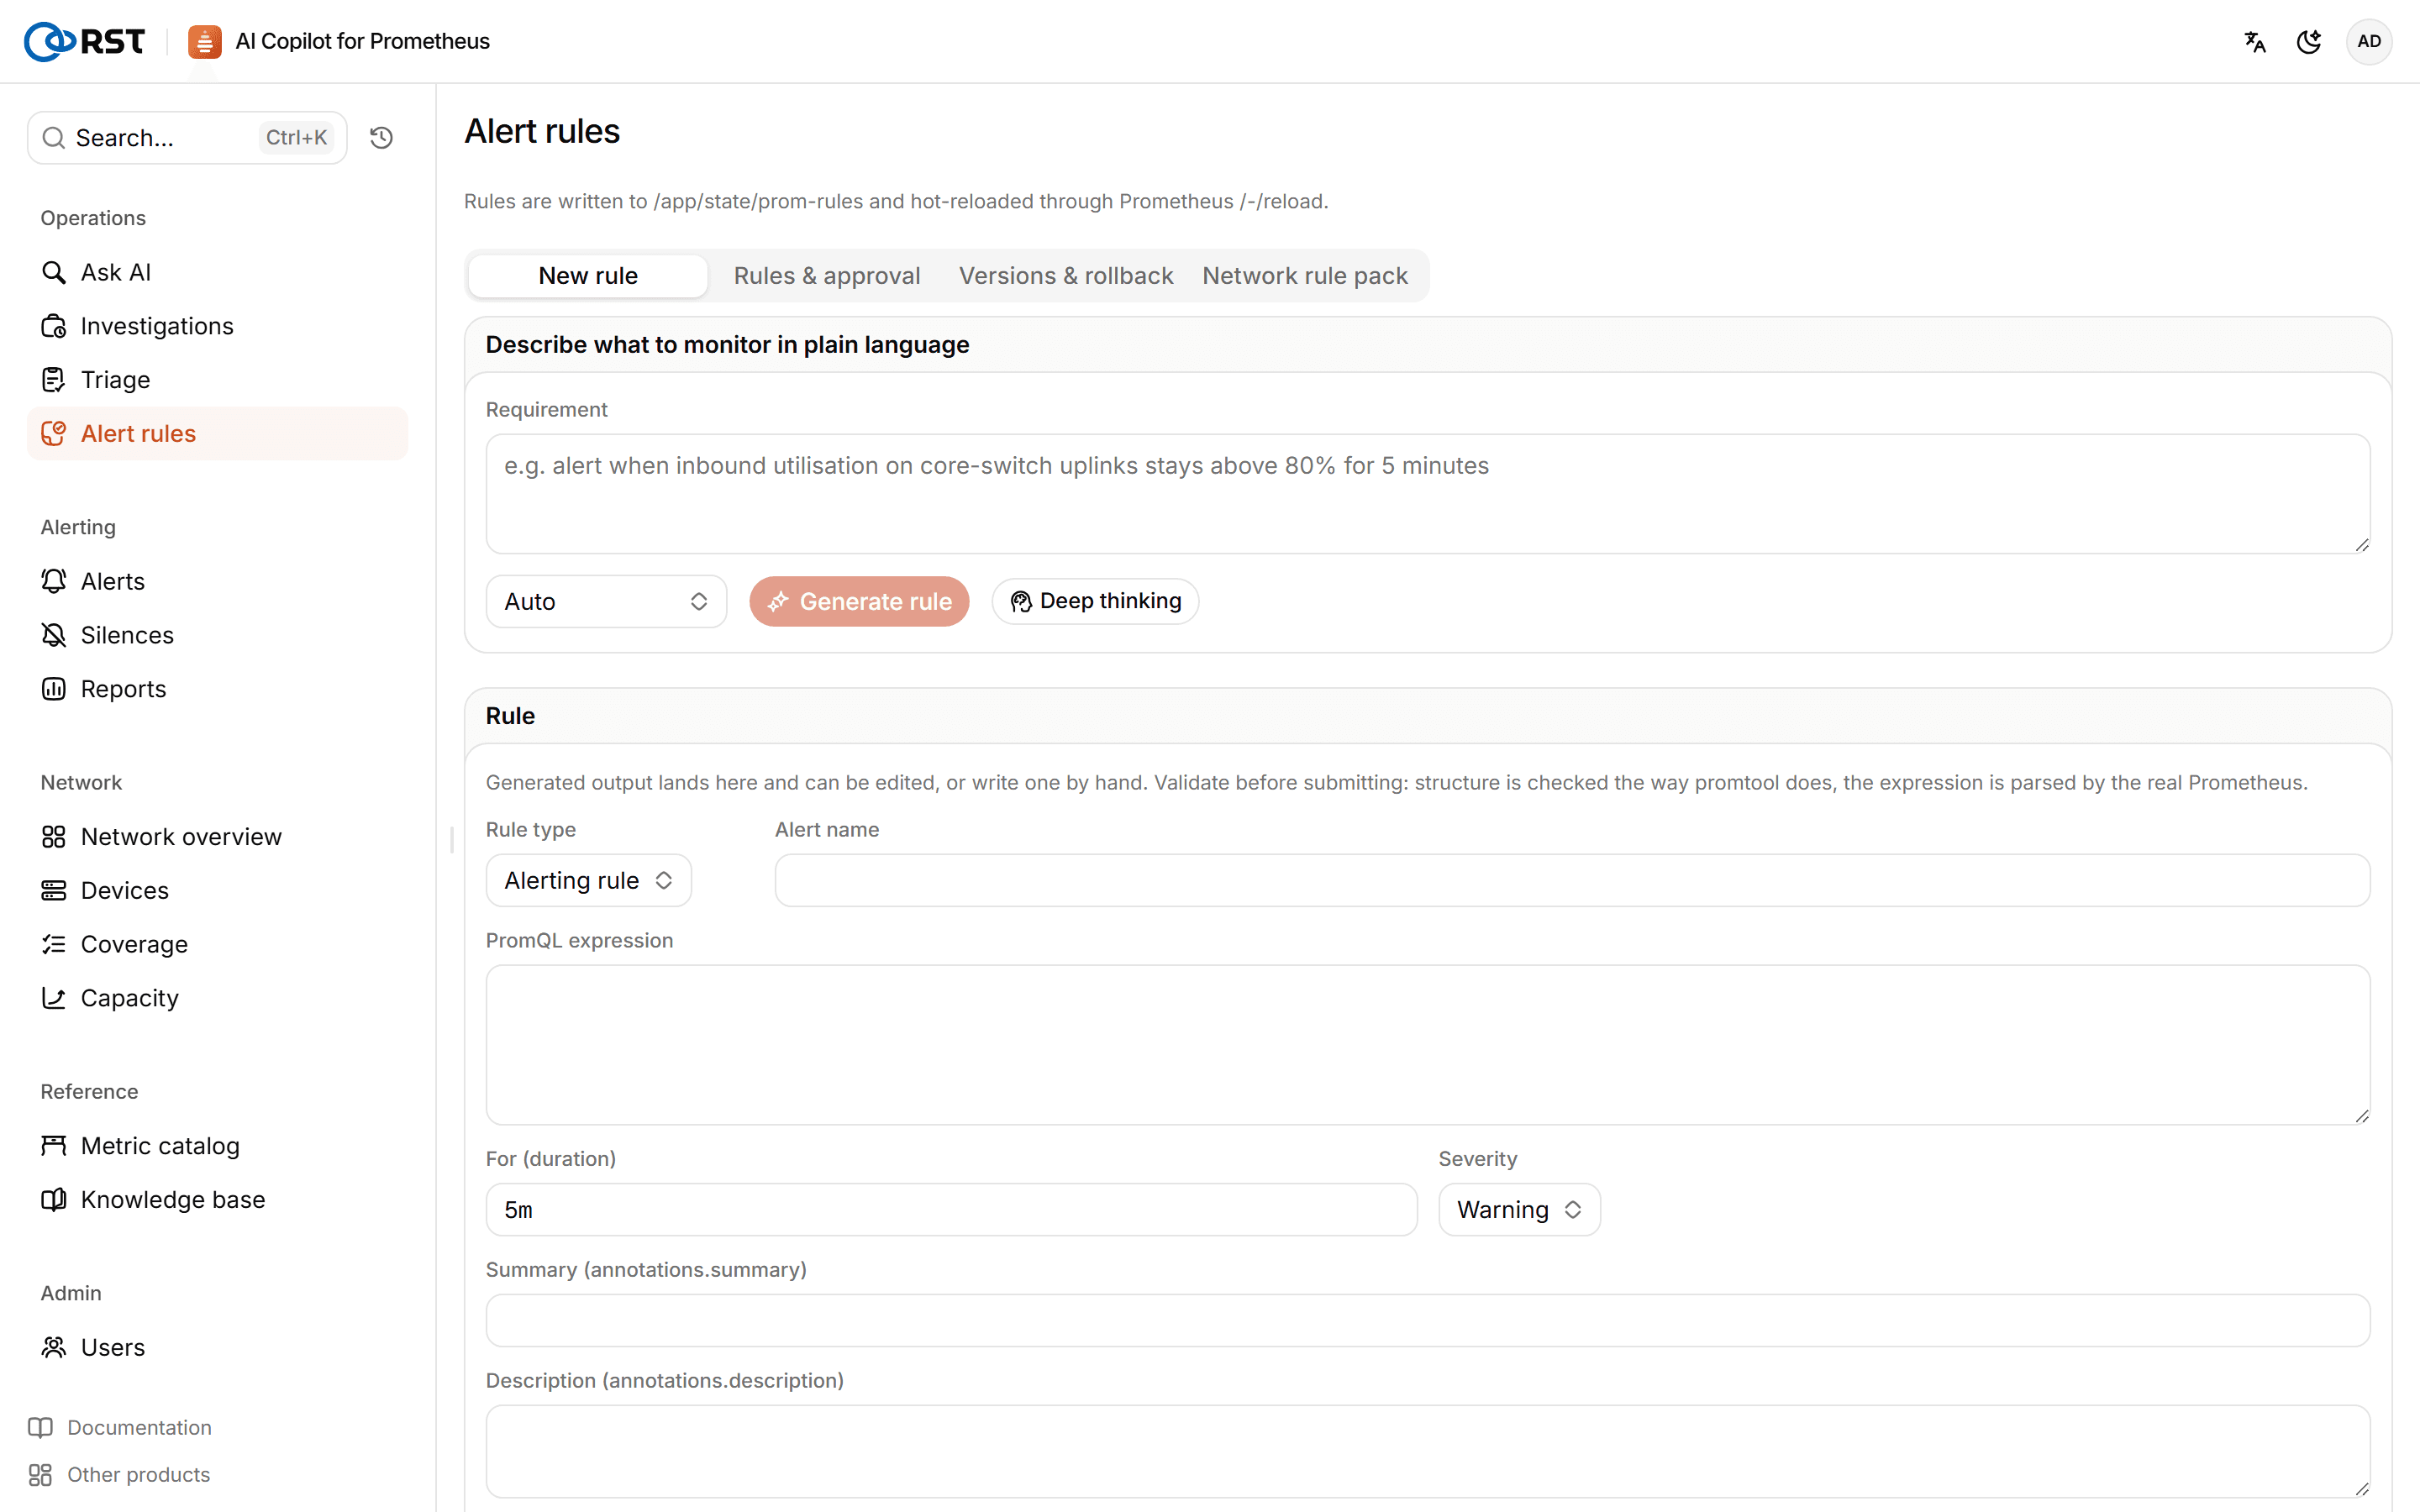
- Describe what to watch in plain language, for example "core switch uplinks above 80% inbound utilization for 10 minutes". Choose alerting rule, recording rule, or let it decide.
- Click Generate rule. The result fills the rule form: alert name or recorded metric name, PromQL expression, duration (
for), severity, summary, description and other labels. If the model decides the request cannot be expressed with the available metrics, it says why. You can edit the form or write a rule from scratch. - Click Validate: the structure is checked the way promtool checks rules, and the expression is parsed by your real Prometheus. If Prometheus is unreachable, only the structure is checked, and the expression is checked again on approval.
- Click Submit for approval.
Make an alert rule in an alert investigation opens this step with the investigation's conclusion.
Rules & approval
The list shows each rule's expression, state (pending, active, rejected, retired), submitter and approver.
- Approve & deploy: the rule is written to the rule directory, Prometheus hot-reloads, the rule becomes active and a new version is created.
- Reject: nothing is written.
- Retire: the rule is removed from the rule file and Prometheus reloads.
Operators and admins can approve; one approval is enough. Submitting, approving, rejecting and retiring are all audited.
Versions & rollback
Every write-back creates a version, with the action, the number of active rules and a note. Roll back to this version restores the rule file to that version and reloads; rules added since then are retired.
Network rule pack
The built-in network operations rule pack: alerts for interface down, link flapping, bandwidth, errors and discards, unreachable devices, CPU, memory, temperature, power, fans and SNMP collection, plus recording rules that normalise each vendor's private metrics.
- Install, Reinstall, Uninstall: writes or deletes the rule file and reloads. The pack is updated with the content pack; when a newer one is available, the page asks you to reinstall.
- Enable or disable rules one by one. Before you disable a recording rule, the page lists the alert rules that depend on it.
Some alerts in the pack rely on the rst_* metrics exported from the device inventory, so add the inventory scrape job to Prometheus; see Data sources.
Triage and investigation
Cluster and rank a batch of alerts, investigate the root cause of one alert, export an incident report and push the conclusion. Needs a Professional license.
Network
The network overview, the device inventory with per-interface alert policy, the monitoring-coverage baseline, and interface flapping and alert noise reduction.