

Smart query
Query logs in one sentence. The gateway turns it into Elasticsearch DSL, validates it read-only, dry-runs and executes it; when nothing matches it says why and offers a fix.
Smart query is the home page and is in every edition; unactivated gateways count it against the daily quota.
From question to result

- Understand: which index, which time range, what to aggregate on. The index defaults to "auto", where a router picks the most plausible one; it can be pinned on the left of the composer.
- Generate DSL: read-only validation rejects writes and scripts, then a
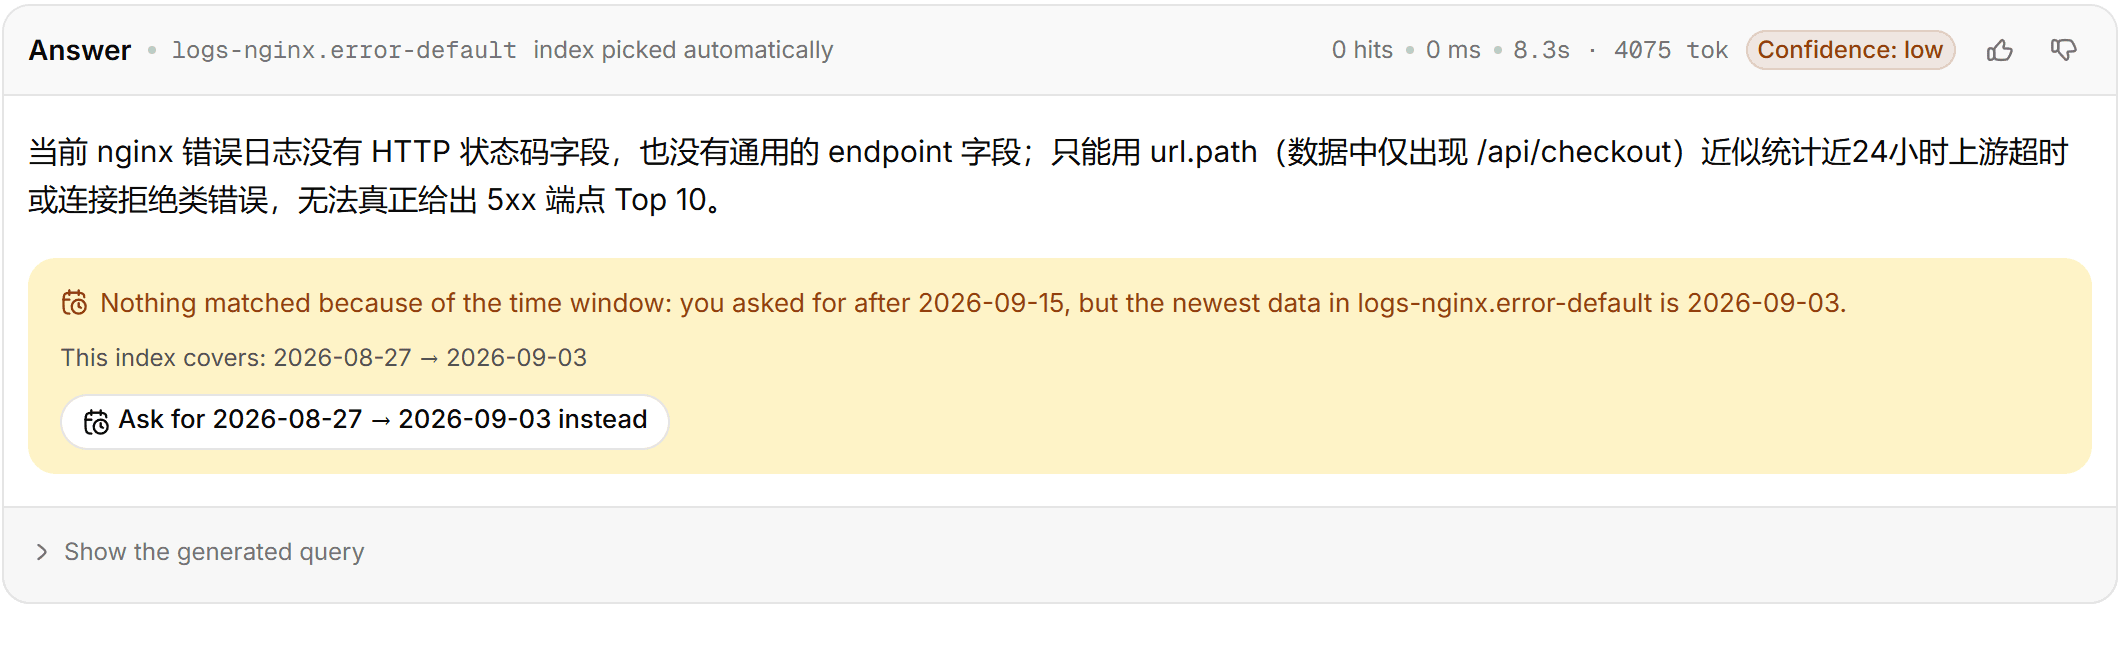
size=0dry run against the target index. A dry-run error is fed back to the model for one repair round. - Execute: a hits table or an aggregation table. The card header shows the index (auto-picked or pinned), hit count, latency, token use, and the model's confidence in its own query: high is safe to use, medium means open the DSL and check, low usually means rephrase.
While generating, a three-stage progress strip shows understand → write query → run; a thinking model's reasoning is folded behind "AI is thinking".
Input
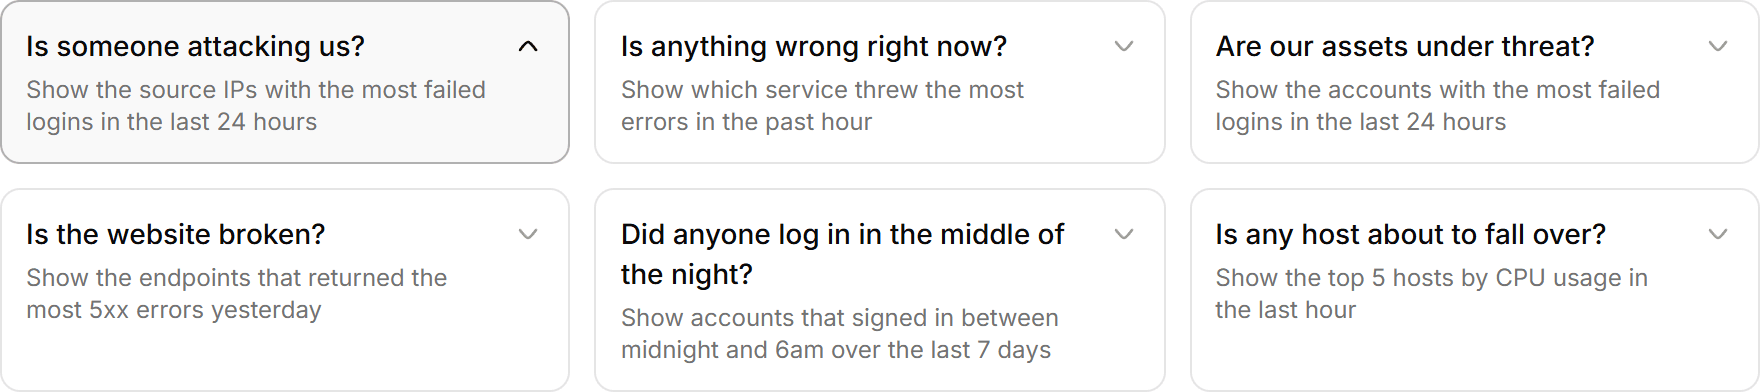
The home page offers six kinds of starter questions with four phrasings each; clicking a phrasing sends it. Saved queries appear under "My saved".
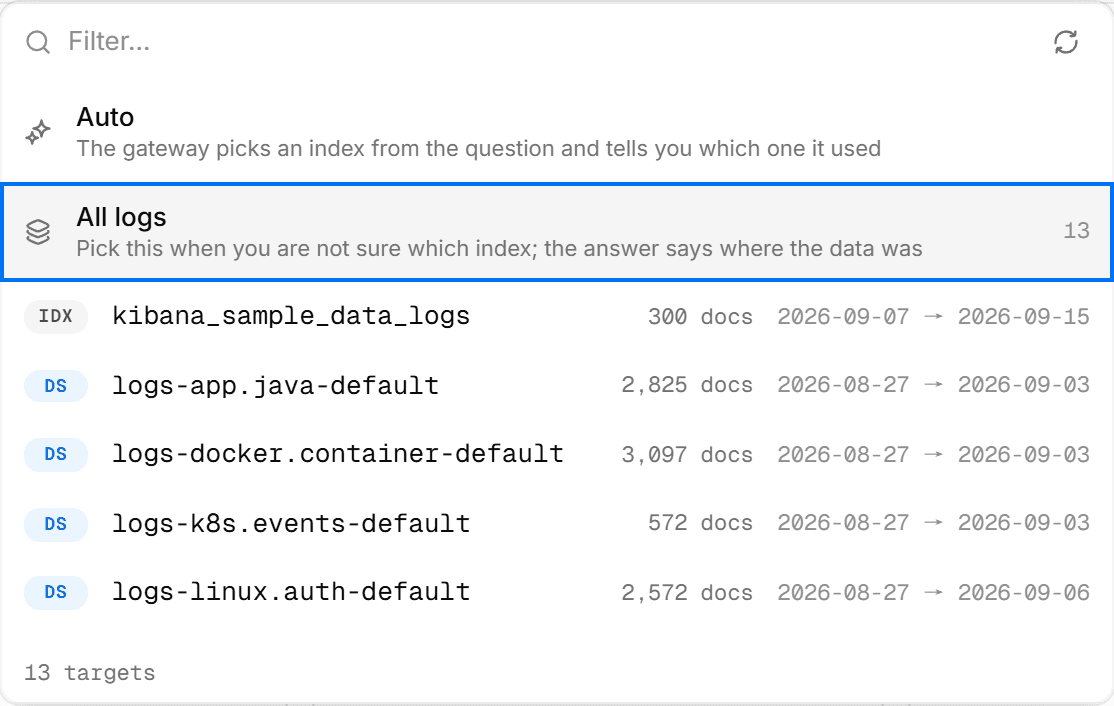
- Index: "auto" by default; or pick one from the whitelist.
- Time range: "All time" by default. With a range set, a "last hour" in the question intersects with it; the card states whether the filter was synced, overrode the question, or sits inside it.
- Enter sends,
Shift+Enterbreaks a line.
Results
| Result | Actions |
|---|---|
| Aggregation ("the 10 most …") | Click a row to drill into that bucket's raw documents, "Back to stats" returns; "Export CSV" |
| Hits | Column set is remembered per index; "Explain" on a row has the model read that log line |
| Generated query | Full DSL: edit and re-run (marked "edited"), copy, "Open in Kibana" (needs a Kibana URL), "Save as a query" |
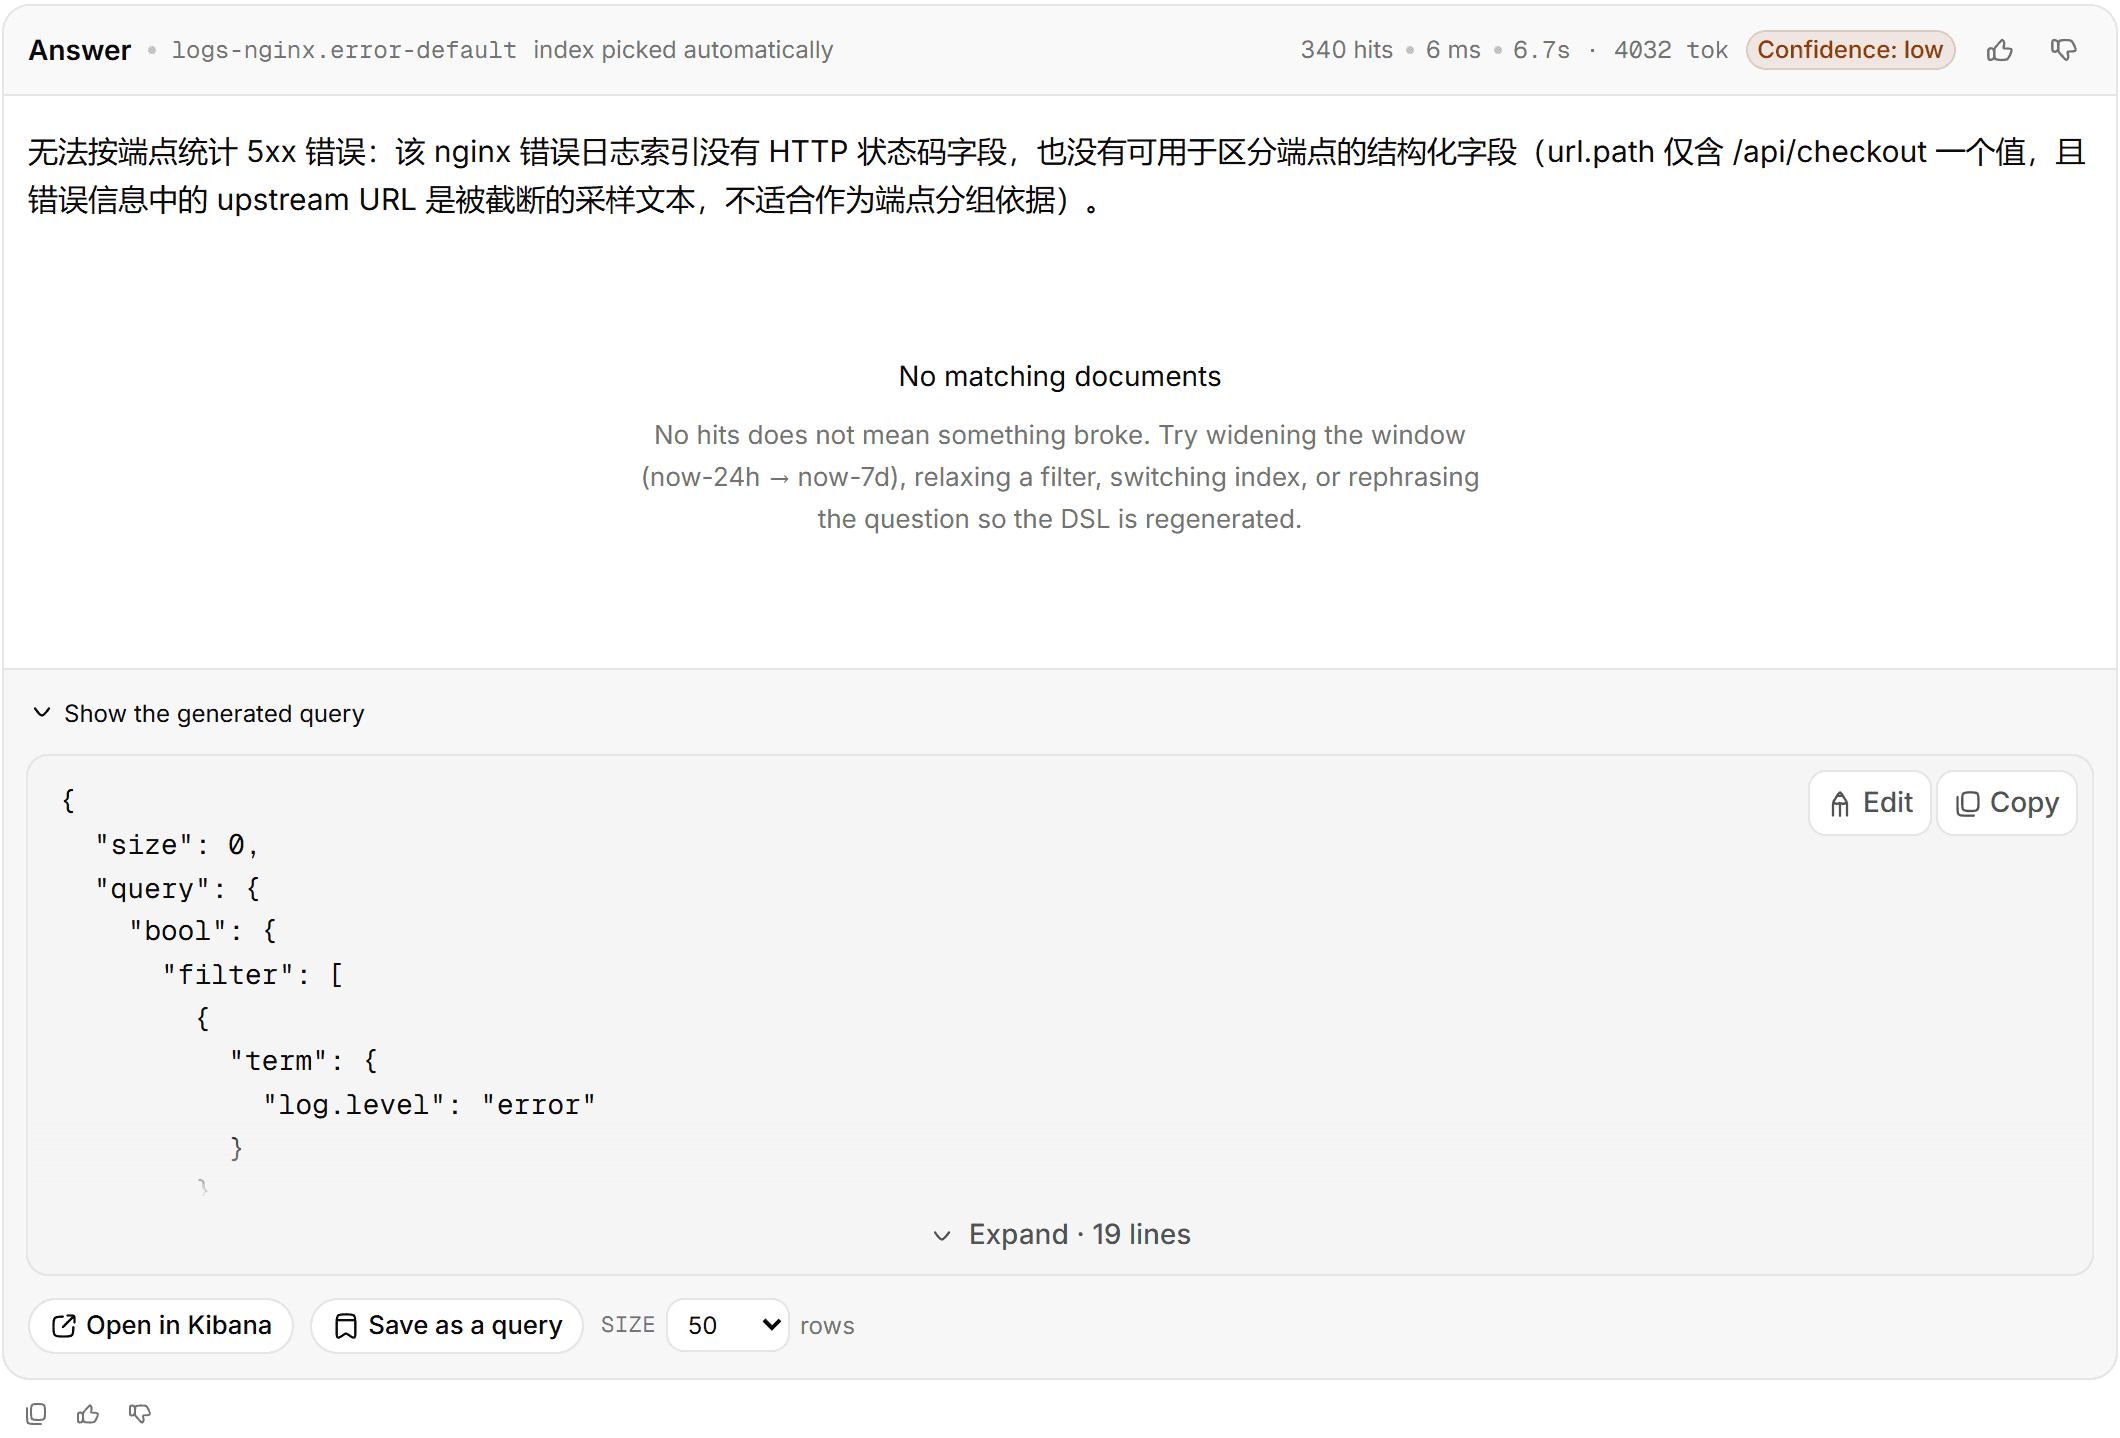
Below the result: "Explain these results" summarises the batch; "Send to triage" hands matching alerts to Batch triage; 👍 / 👎 feed a learning library, and a 👎 can carry the correct query so the next similar question is generated from it.
Empty results
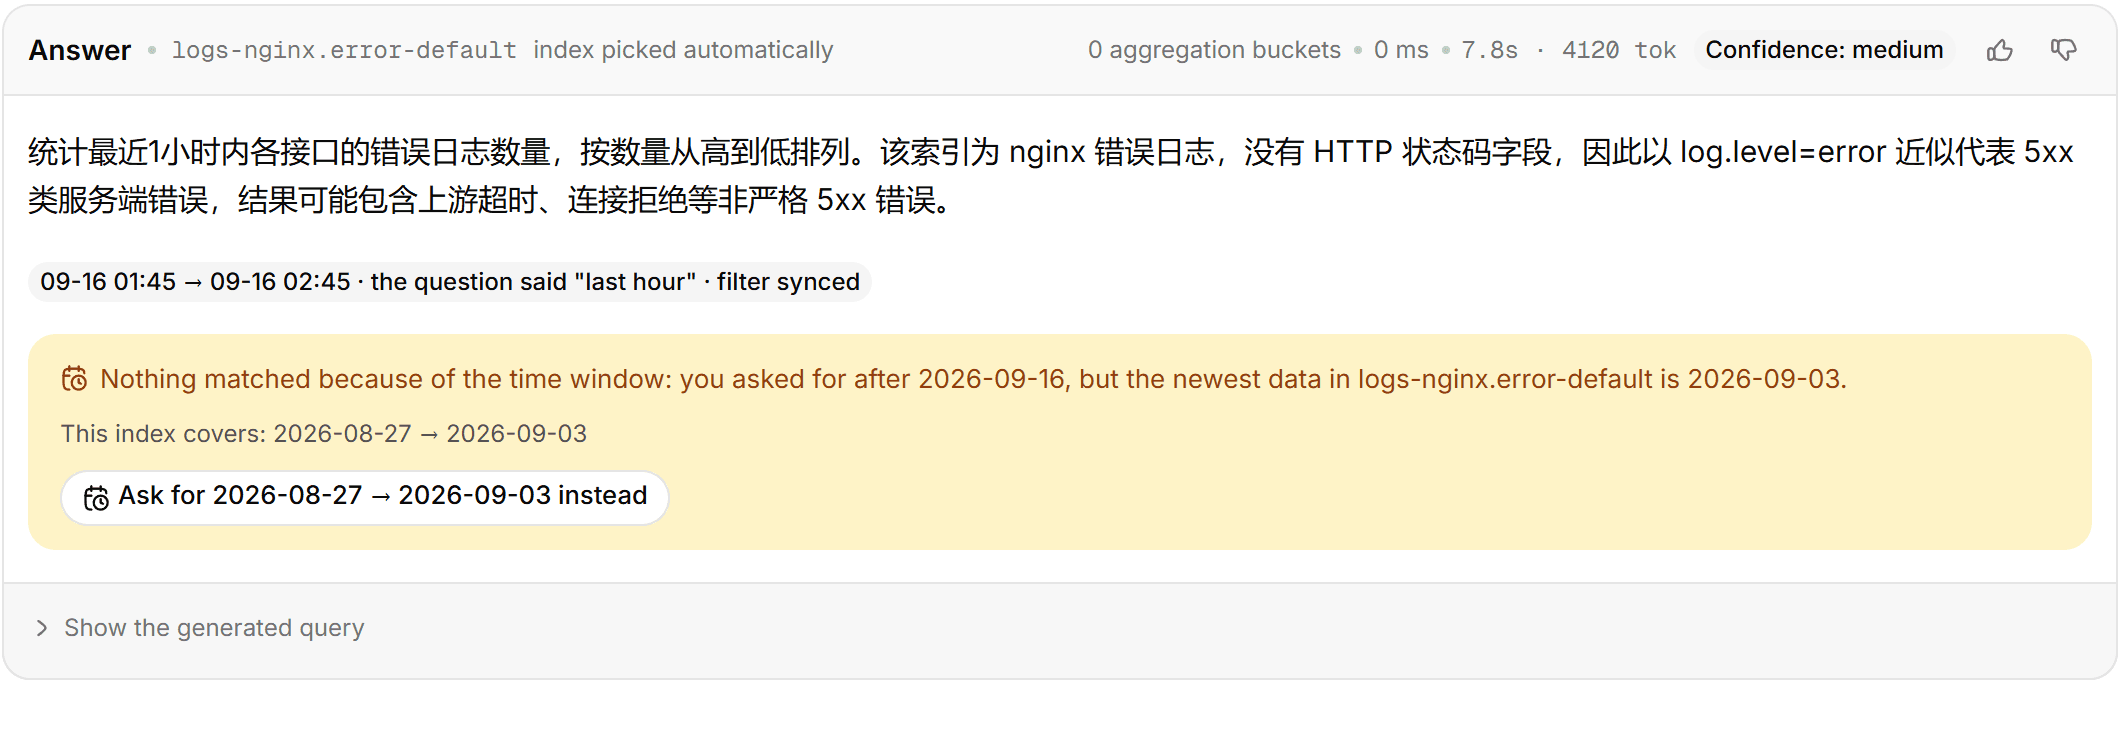
The gateway separates "really nothing" from "wrong question / wrong data" and handles four cases:
| Case | Symptom | Handling |
|---|---|---|
| Wrong time window | "Last hour" asked, newest document is ten days old | States the index's data range and offers "Ask for ⟨range⟩ instead"; "future" logs (a collector wrote local time as UTC) are called out too |
| A clause blocked it | Several conditions, zero hits | Relaxes them one by one, lists "dropping X leaves N hits", click one to re-run relaxed. Typically the log says Out of memory while the question said OOM |
| Wrong index | Nothing in this index | Tries the same conditions in other indices and lists them with counts; click an index to query just it, or "regenerate over all logs" |
| One source of several matched nothing | Question spans indices | Names the source that matched nothing and the likely value-format mismatch |
Follow-up turns
In the same conversation the model carries context: the previous turn's index (marked "inherited"), references like "the first one" or "that IP". "+" top right starts a fresh conversation.
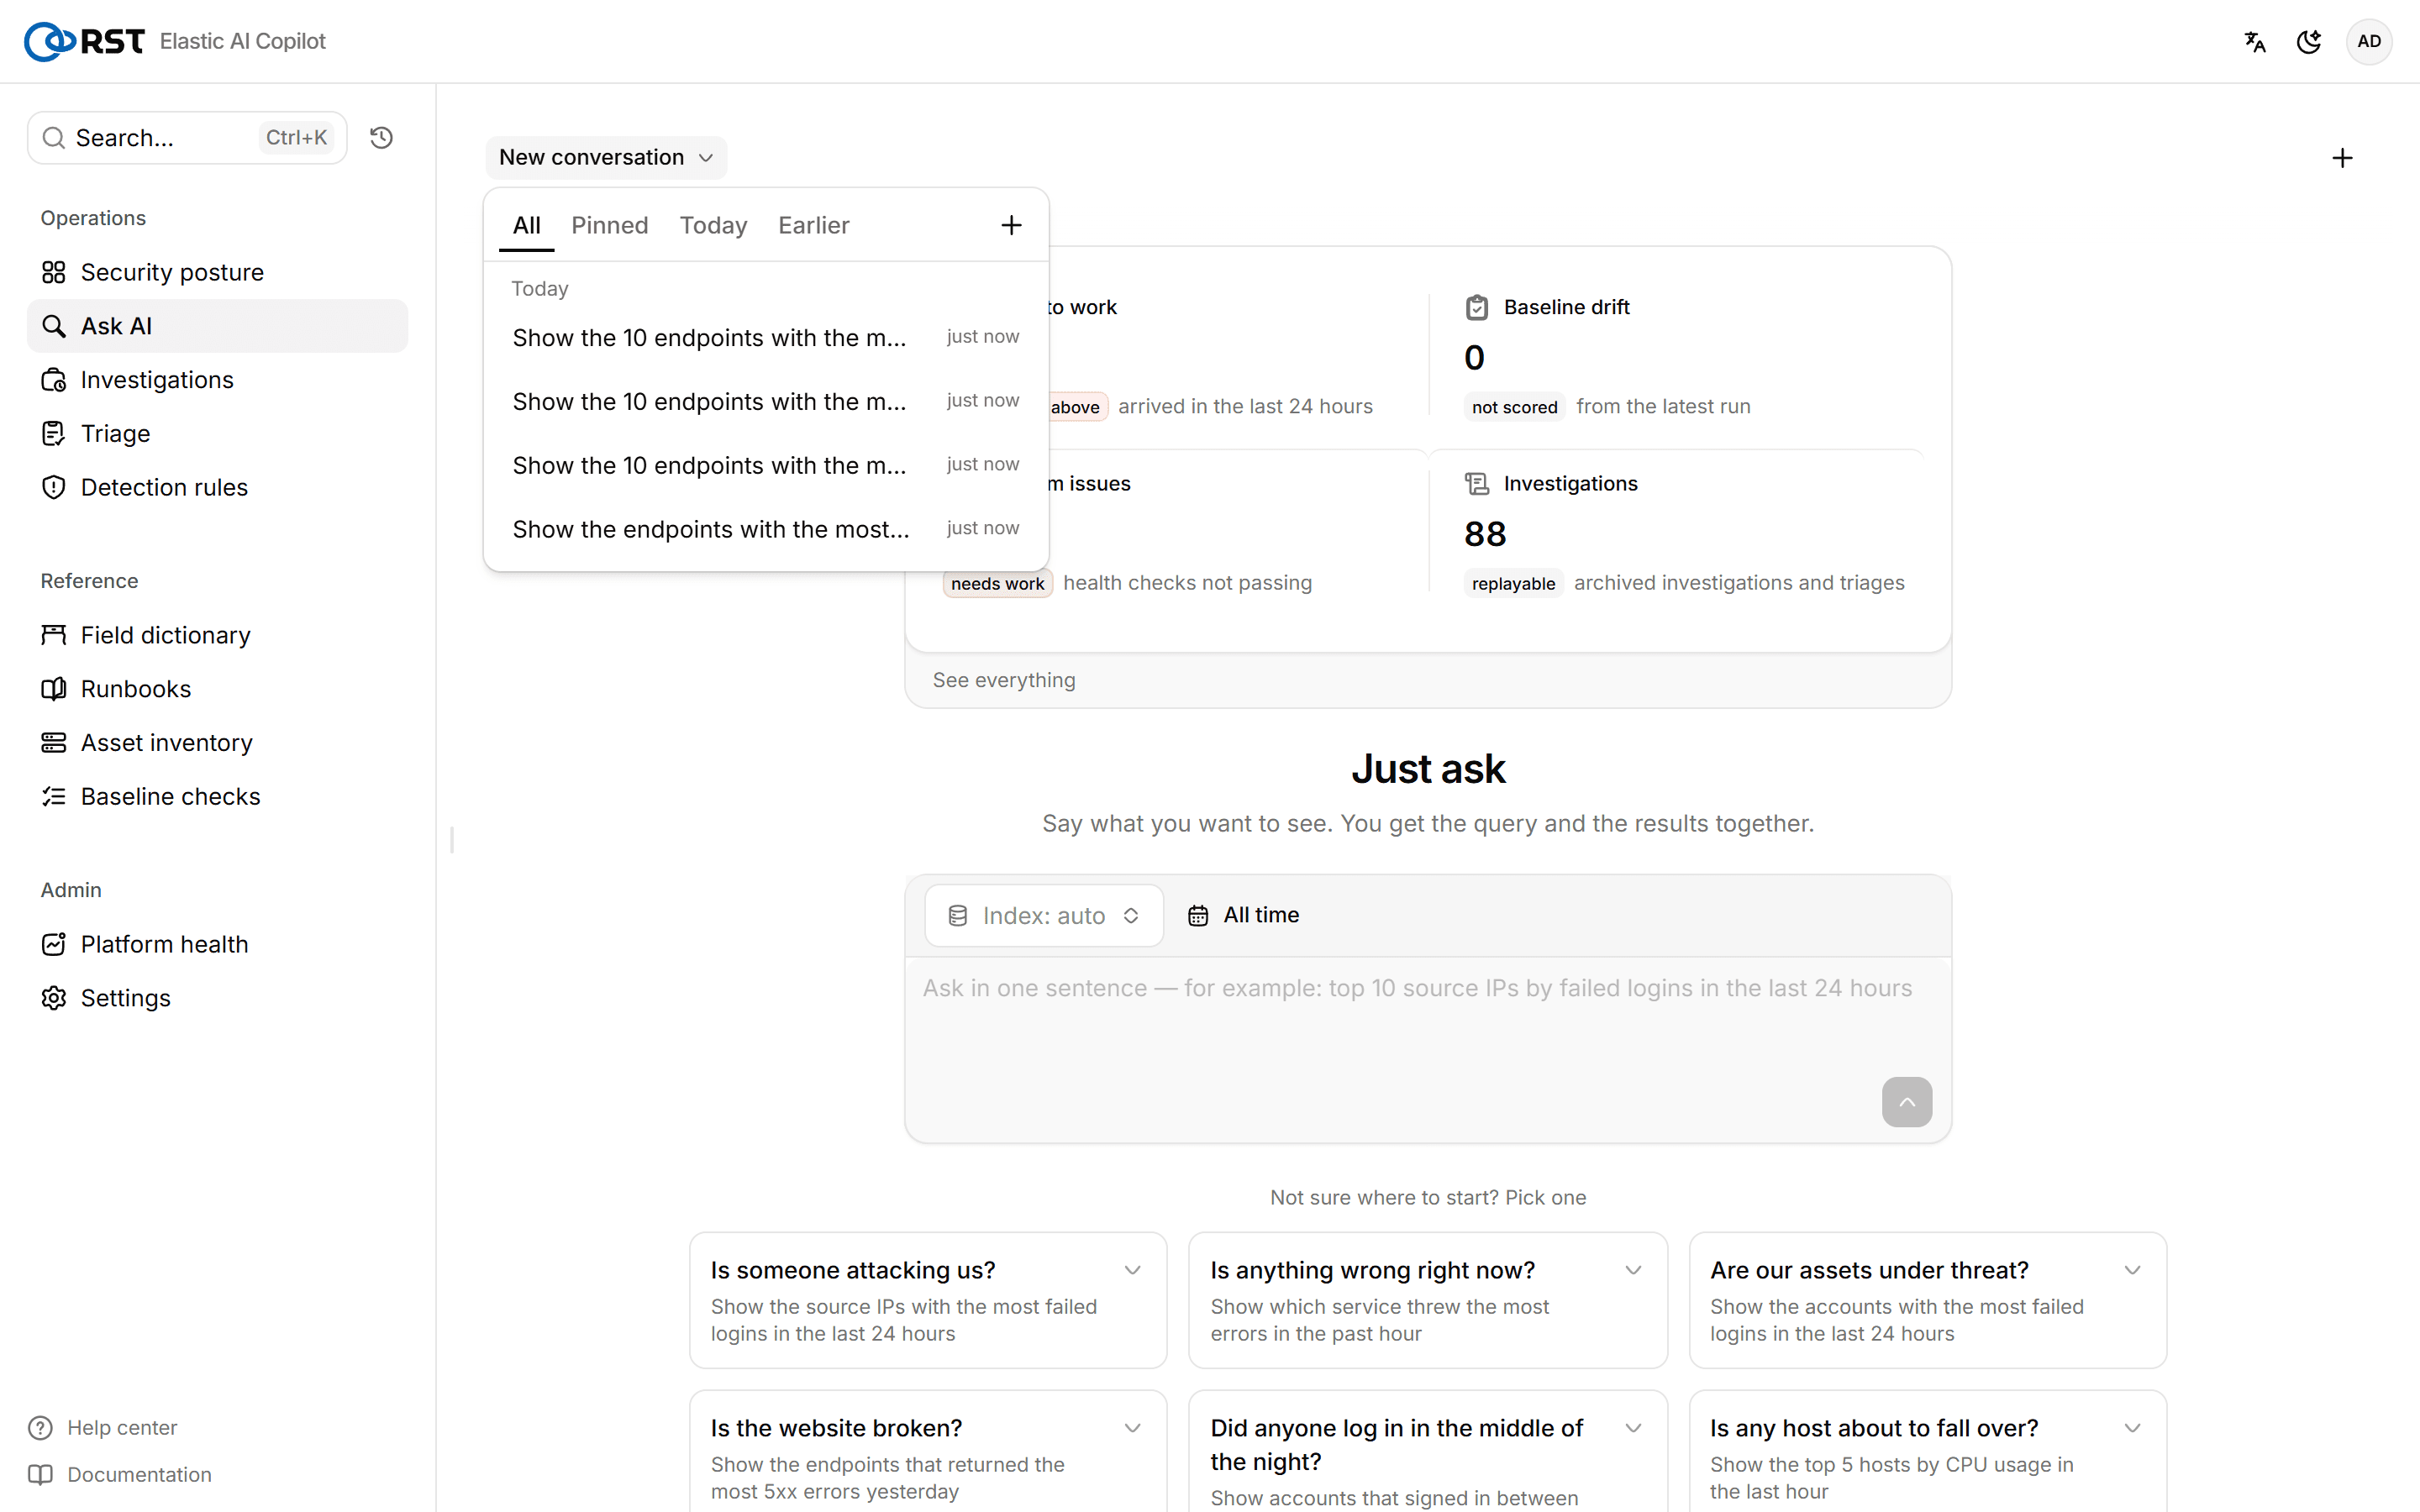
Conversations are stored gateway-side (.rst_copilot_conversations in ES, expiring after 7 idle days) and can be continued from another browser. The conversation name top-left lists history with a badge: failed last time / interrupted / generating.
First-token timeout
No first token within 45 seconds aborts the request with a retry prompt (RST_LLM_FIRST_TOKEN_TIMEOUT_S, 0 = unlimited). Usually the model endpoint is congested; if it persists, lower that provider's reasoning level in AI models or add another provider.
Masking
Before anything reaches the model, field masking applies the mode set in Settings: cloud mode replaces IPs, accounts and the like with placeholders (the 10.30.x.x in results), private mode is looser, air-gapped never leaves the network. All three modes are in every edition.
A tour of the UI
The three navigation groups, accounts and roles, the Ctrl+K command palette, and the quota meter shown before activation.
Analysis records
Automatic archive of alert investigations, batch triage runs and result explanations, visible to the whole team; jump from a record to querying its subject.