

Batch triage
A batch of alerts clustered by intent and subject; the model scores each cluster, flags likely false positives and suggests actions. Paid.
Batch triage answers "300 alerts in the queue, which first". Alerts with the same intent and subject are clustered first and the model scores the cluster, so 300 alerts usually become a dozen decisions.
Paid capability, Standard (14-day trial included) and above. Unactivated gateways are pointed to Activation.
Submitting alerts

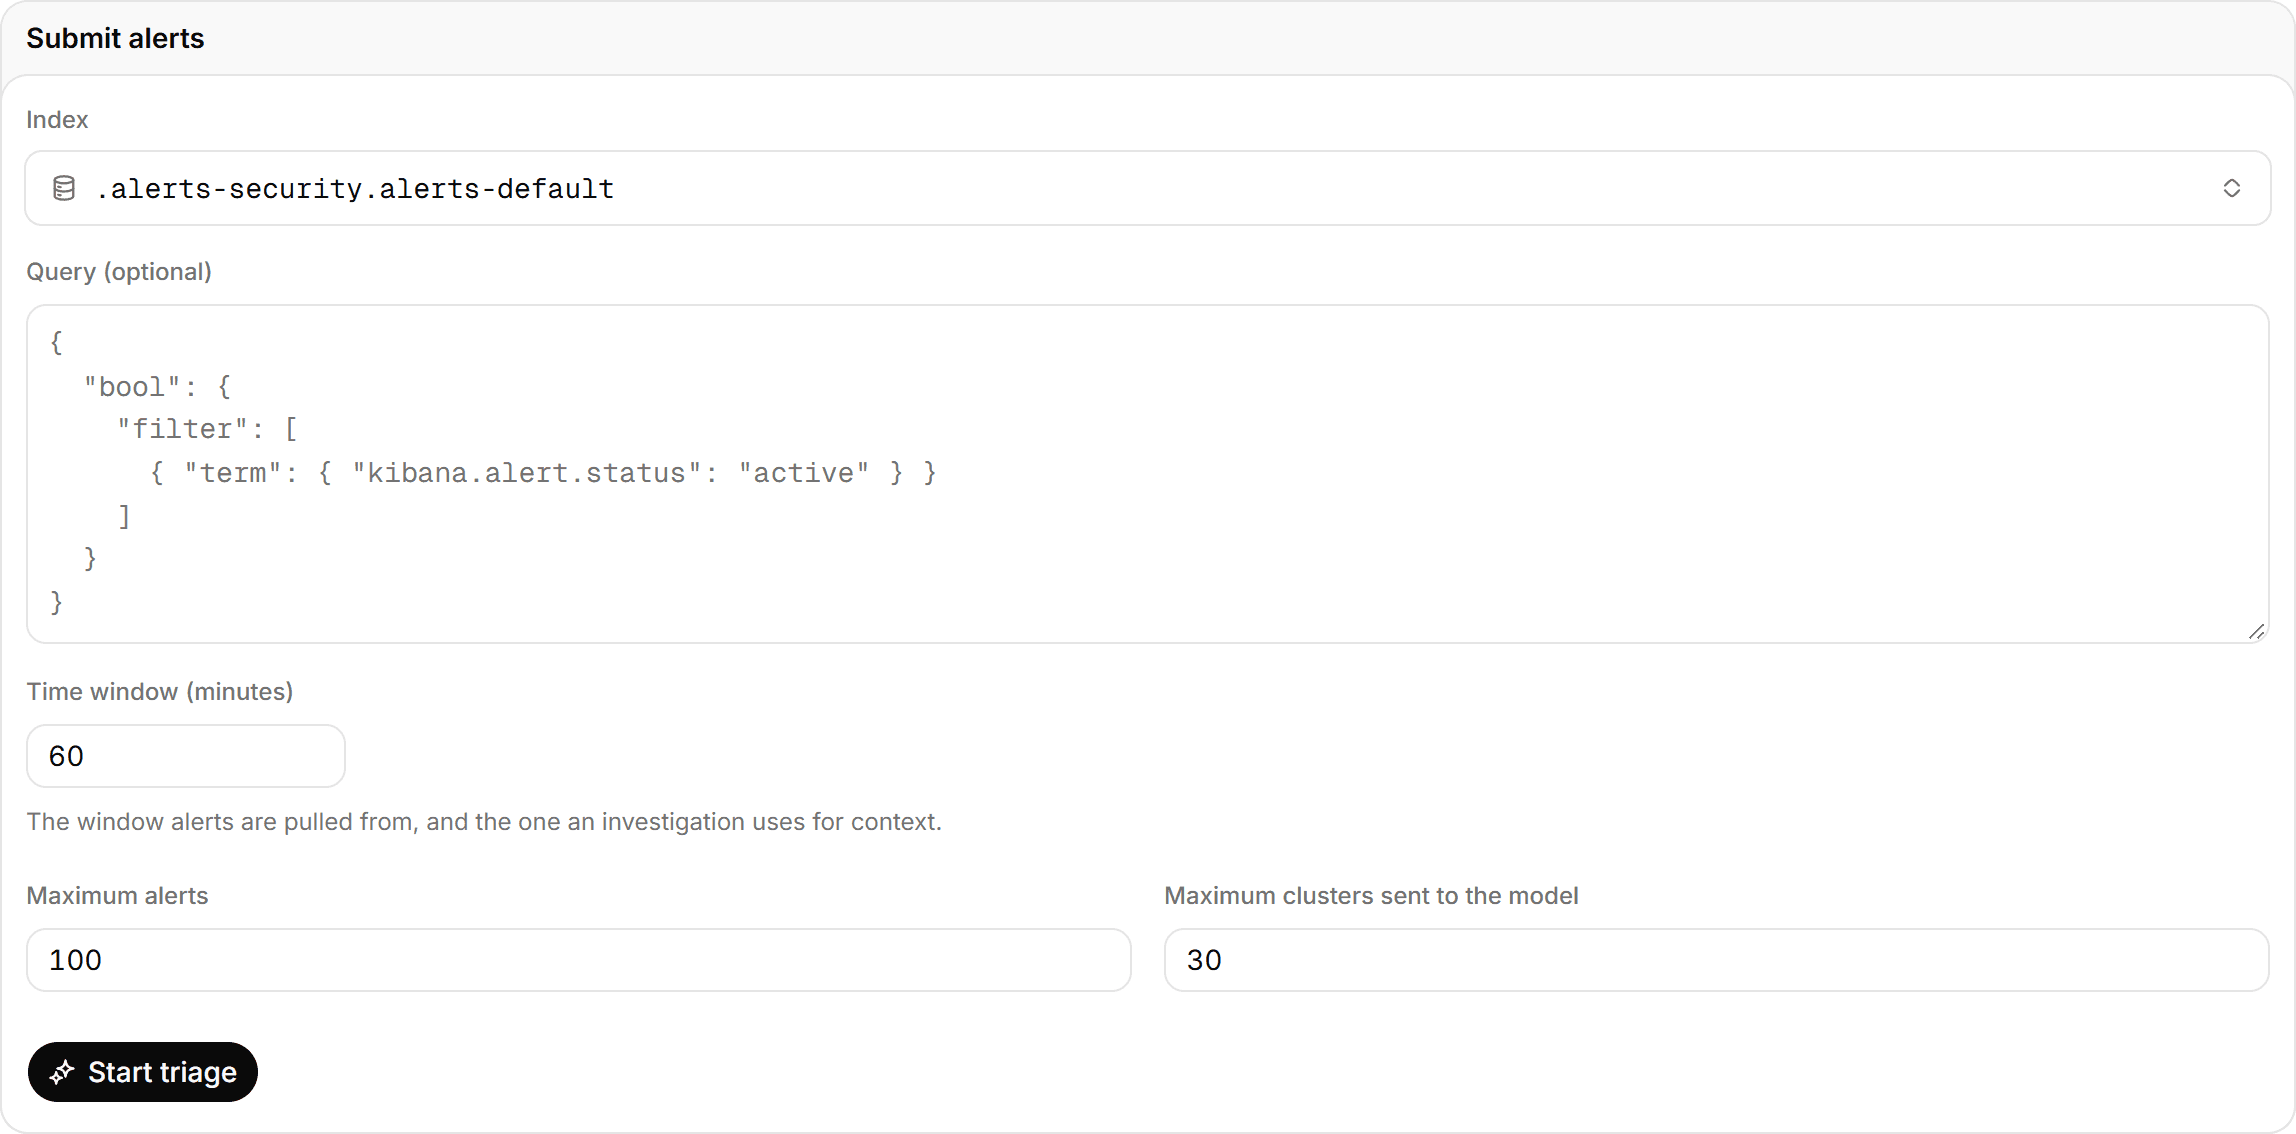
Two sources:
- Pull from ES (default): the alert index (default
.alerts-security.alerts-default, Elastic Security's detection alerts), an optional query filter (defaultkibana.alert.status: active), and a time window in minutes (up to 7 days). - Handed over: "Send to triage" in Smart query or the bulk action in Live alerts brings alerts straight here ("Received N alerts"); the window is then only used by "Investigate" to gather context.
Two caps: max alerts (default 100; beyond that only the newest sample is taken and the result says "first N of total") and clusters sent to the model (default 30; more clusters are ordered by alert count and the rest are left unscored).
Clustering is local; scoring calls the model. A few dozen clusters take 30–130 seconds.
The result
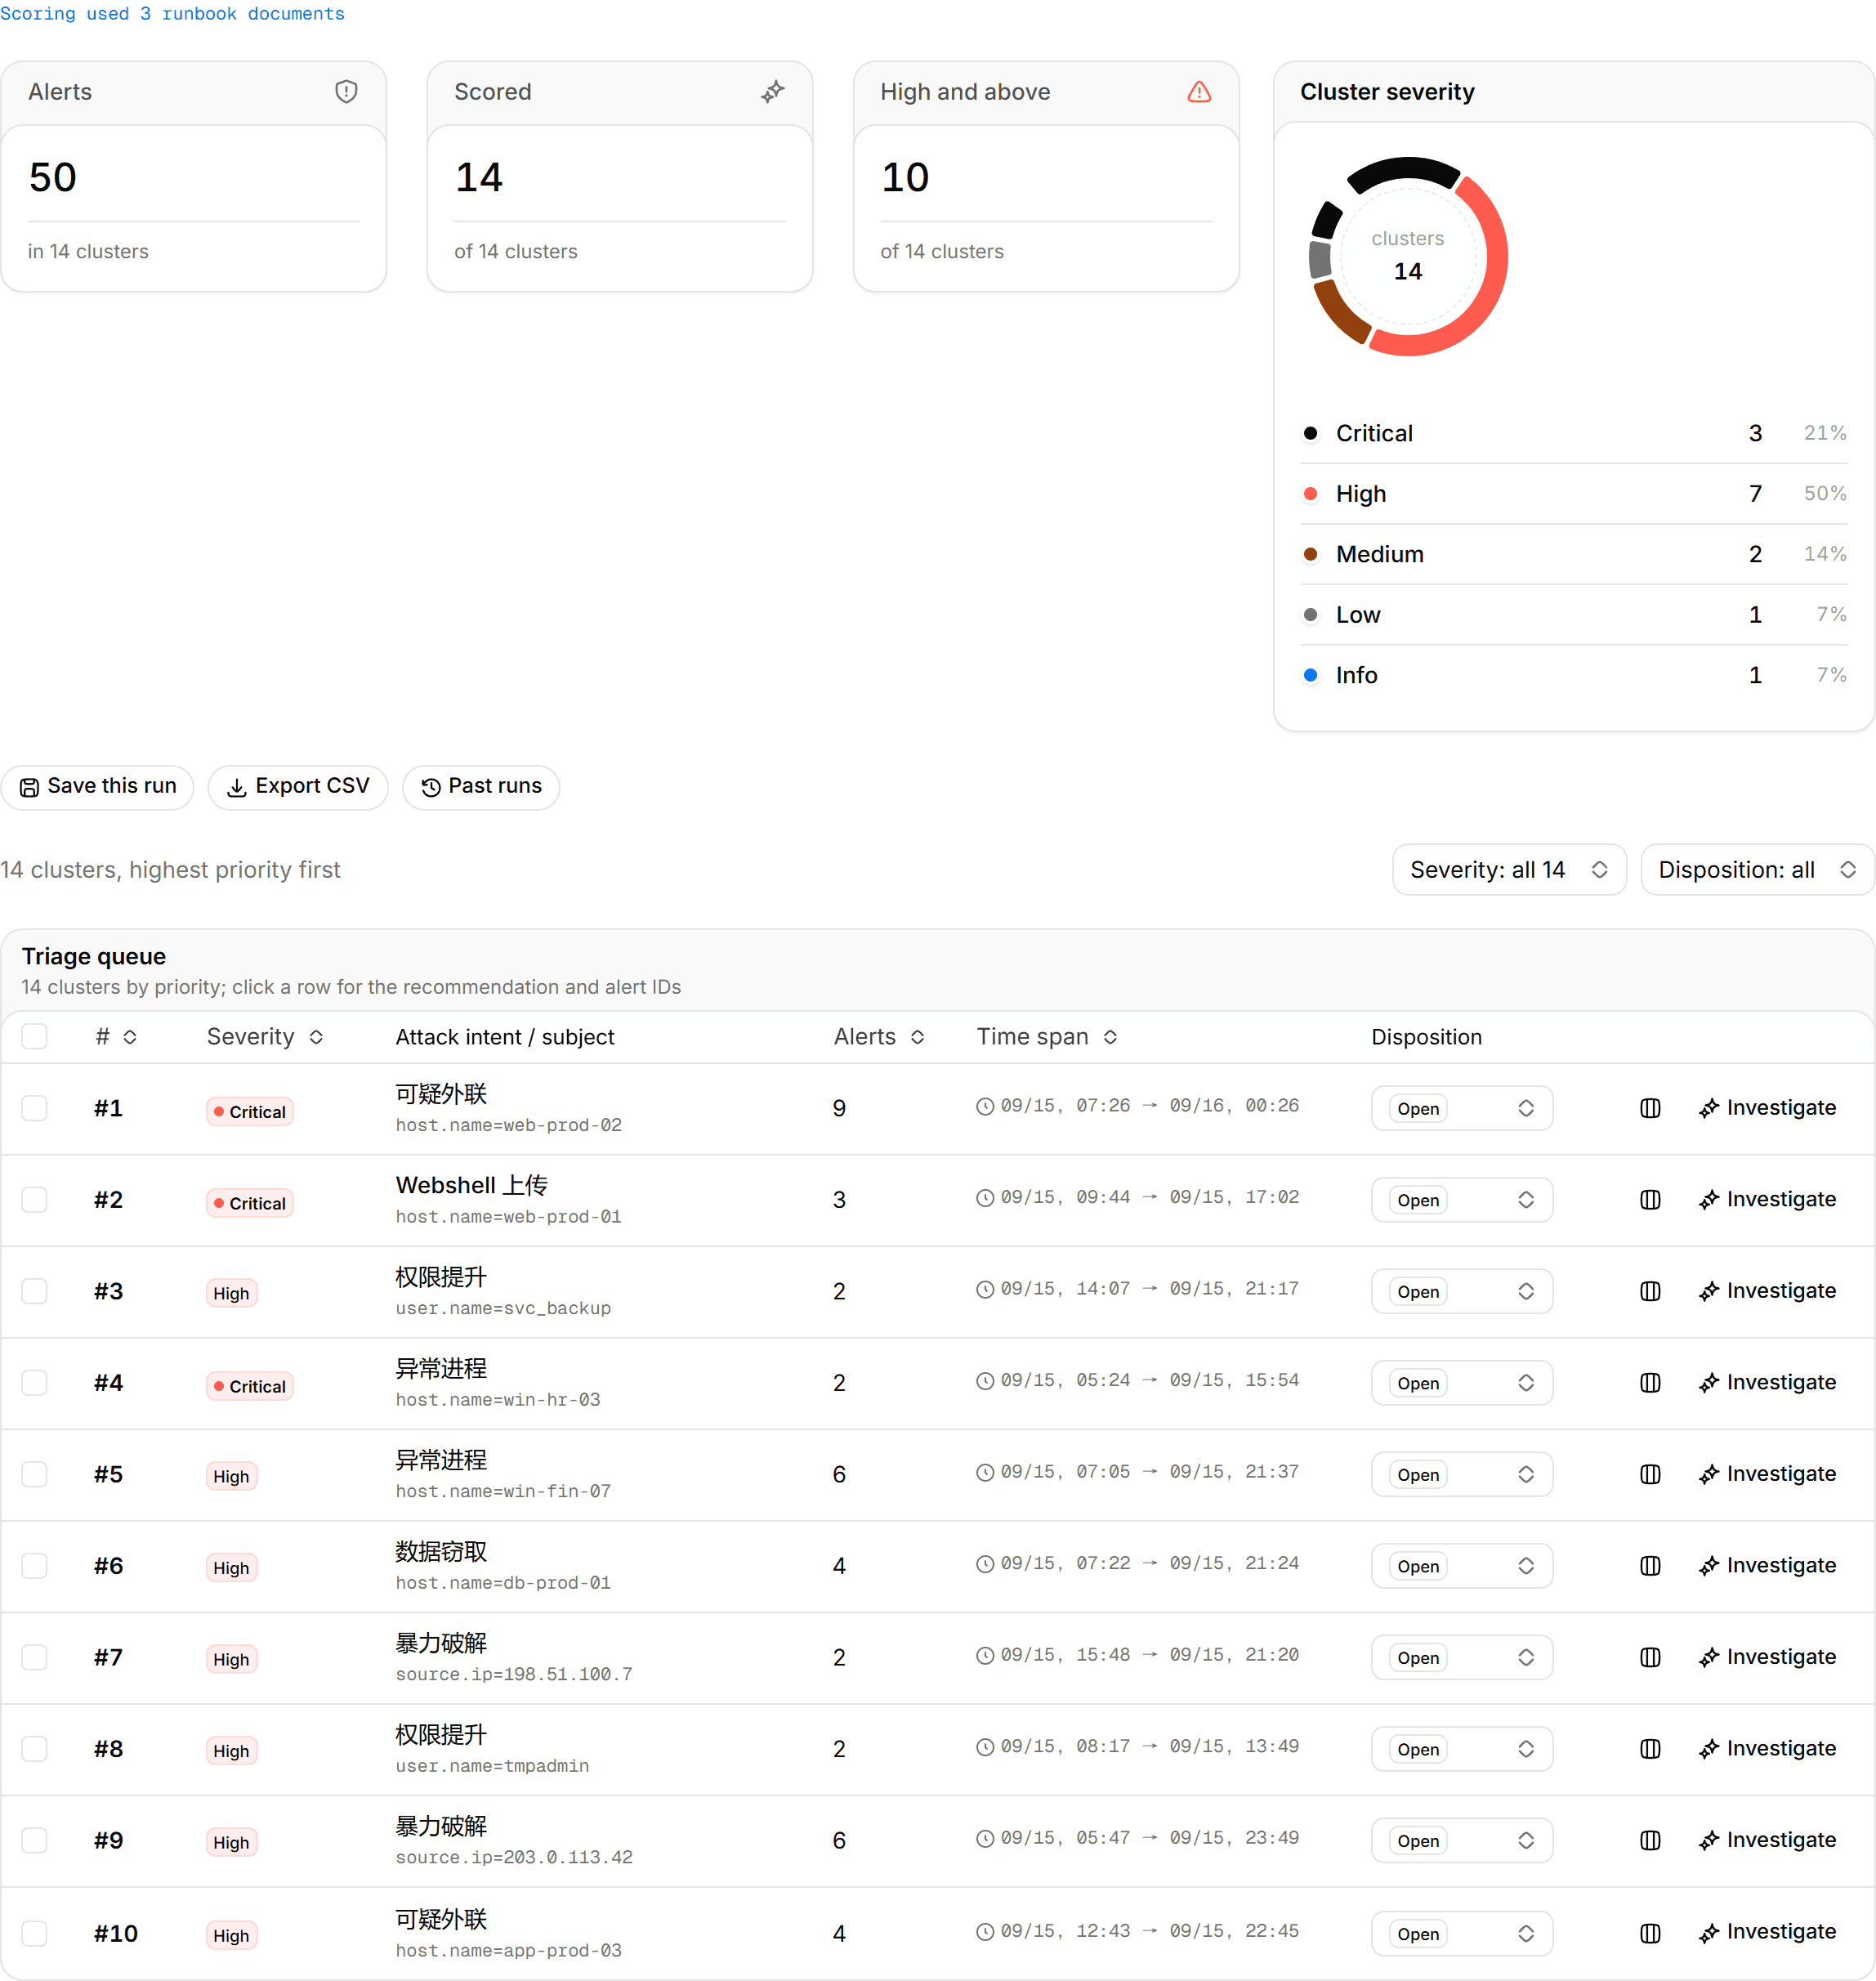
Four cards on top: total alerts (in how many clusters), scored, high and above, a severity donut.
The triage queue is sorted by priority, one row per cluster:
| Column | Meaning |
|---|---|
| Severity | The model's verdict: critical / high / medium / low / info; "likely false positive" is flagged separately |
| Intent / subject | What the cluster is doing, and which host / IP / account |
| Alerts | How many alerts in the cluster |
| Span | First to last alert |
| Disposition | Open / handled / false positive / escalated; syncs to the alert state in Live alerts, visible to the whole team |
Click a row to expand the recommended action and the cluster's alert IDs. Tick several rows to change their disposition at once.
Scoring consults the Runbooks knowledge base; when it did, the result says "scoring used N runbook documents".
From a cluster
- Investigate: gather context around the cluster's subject within the window and run an alert investigation.
- Compare: put several clusters side by side at the bottom to see whether they are facets of one incident.
- Escalate: setting the disposition to "escalated" asks whether to push to on-call channels; destinations must exist in Notifications.
Saving and export
- Save this run: add a note, stored server-side; everyone sees it under "Past runs" and in Analysis records.
- Export CSV: take the queue with you.
Scoring did not complete
On a model timeout or error the page says "AI scoring incomplete" and still shows the clusters ordered by alert count (no severity or recommendation); retry later. If it persists, check provider health in AI models.
Analysis records
Automatic archive of alert investigations, batch triage runs and result explanations, visible to the whole team; jump from a record to querying its subject.
Detection rules
Describe the behaviour to catch in one sentence and get a Kibana detection rule (KQL / EQL / threshold) mapped to MITRE ATT&CK; export .ndjson and import into Kibana. Paid.