

Platform health
A check-up of the Elastic cluster: cluster state, shards, disk, ILM, time baseline, permissions, with a verdict per item; the paid "AI read" ties failing items together and says what to fix first.
Platform health checks the Elastic platform carrying the logs. Opening the page runs a check-up (free); "AI read" is paid (the platform-ops copilot).
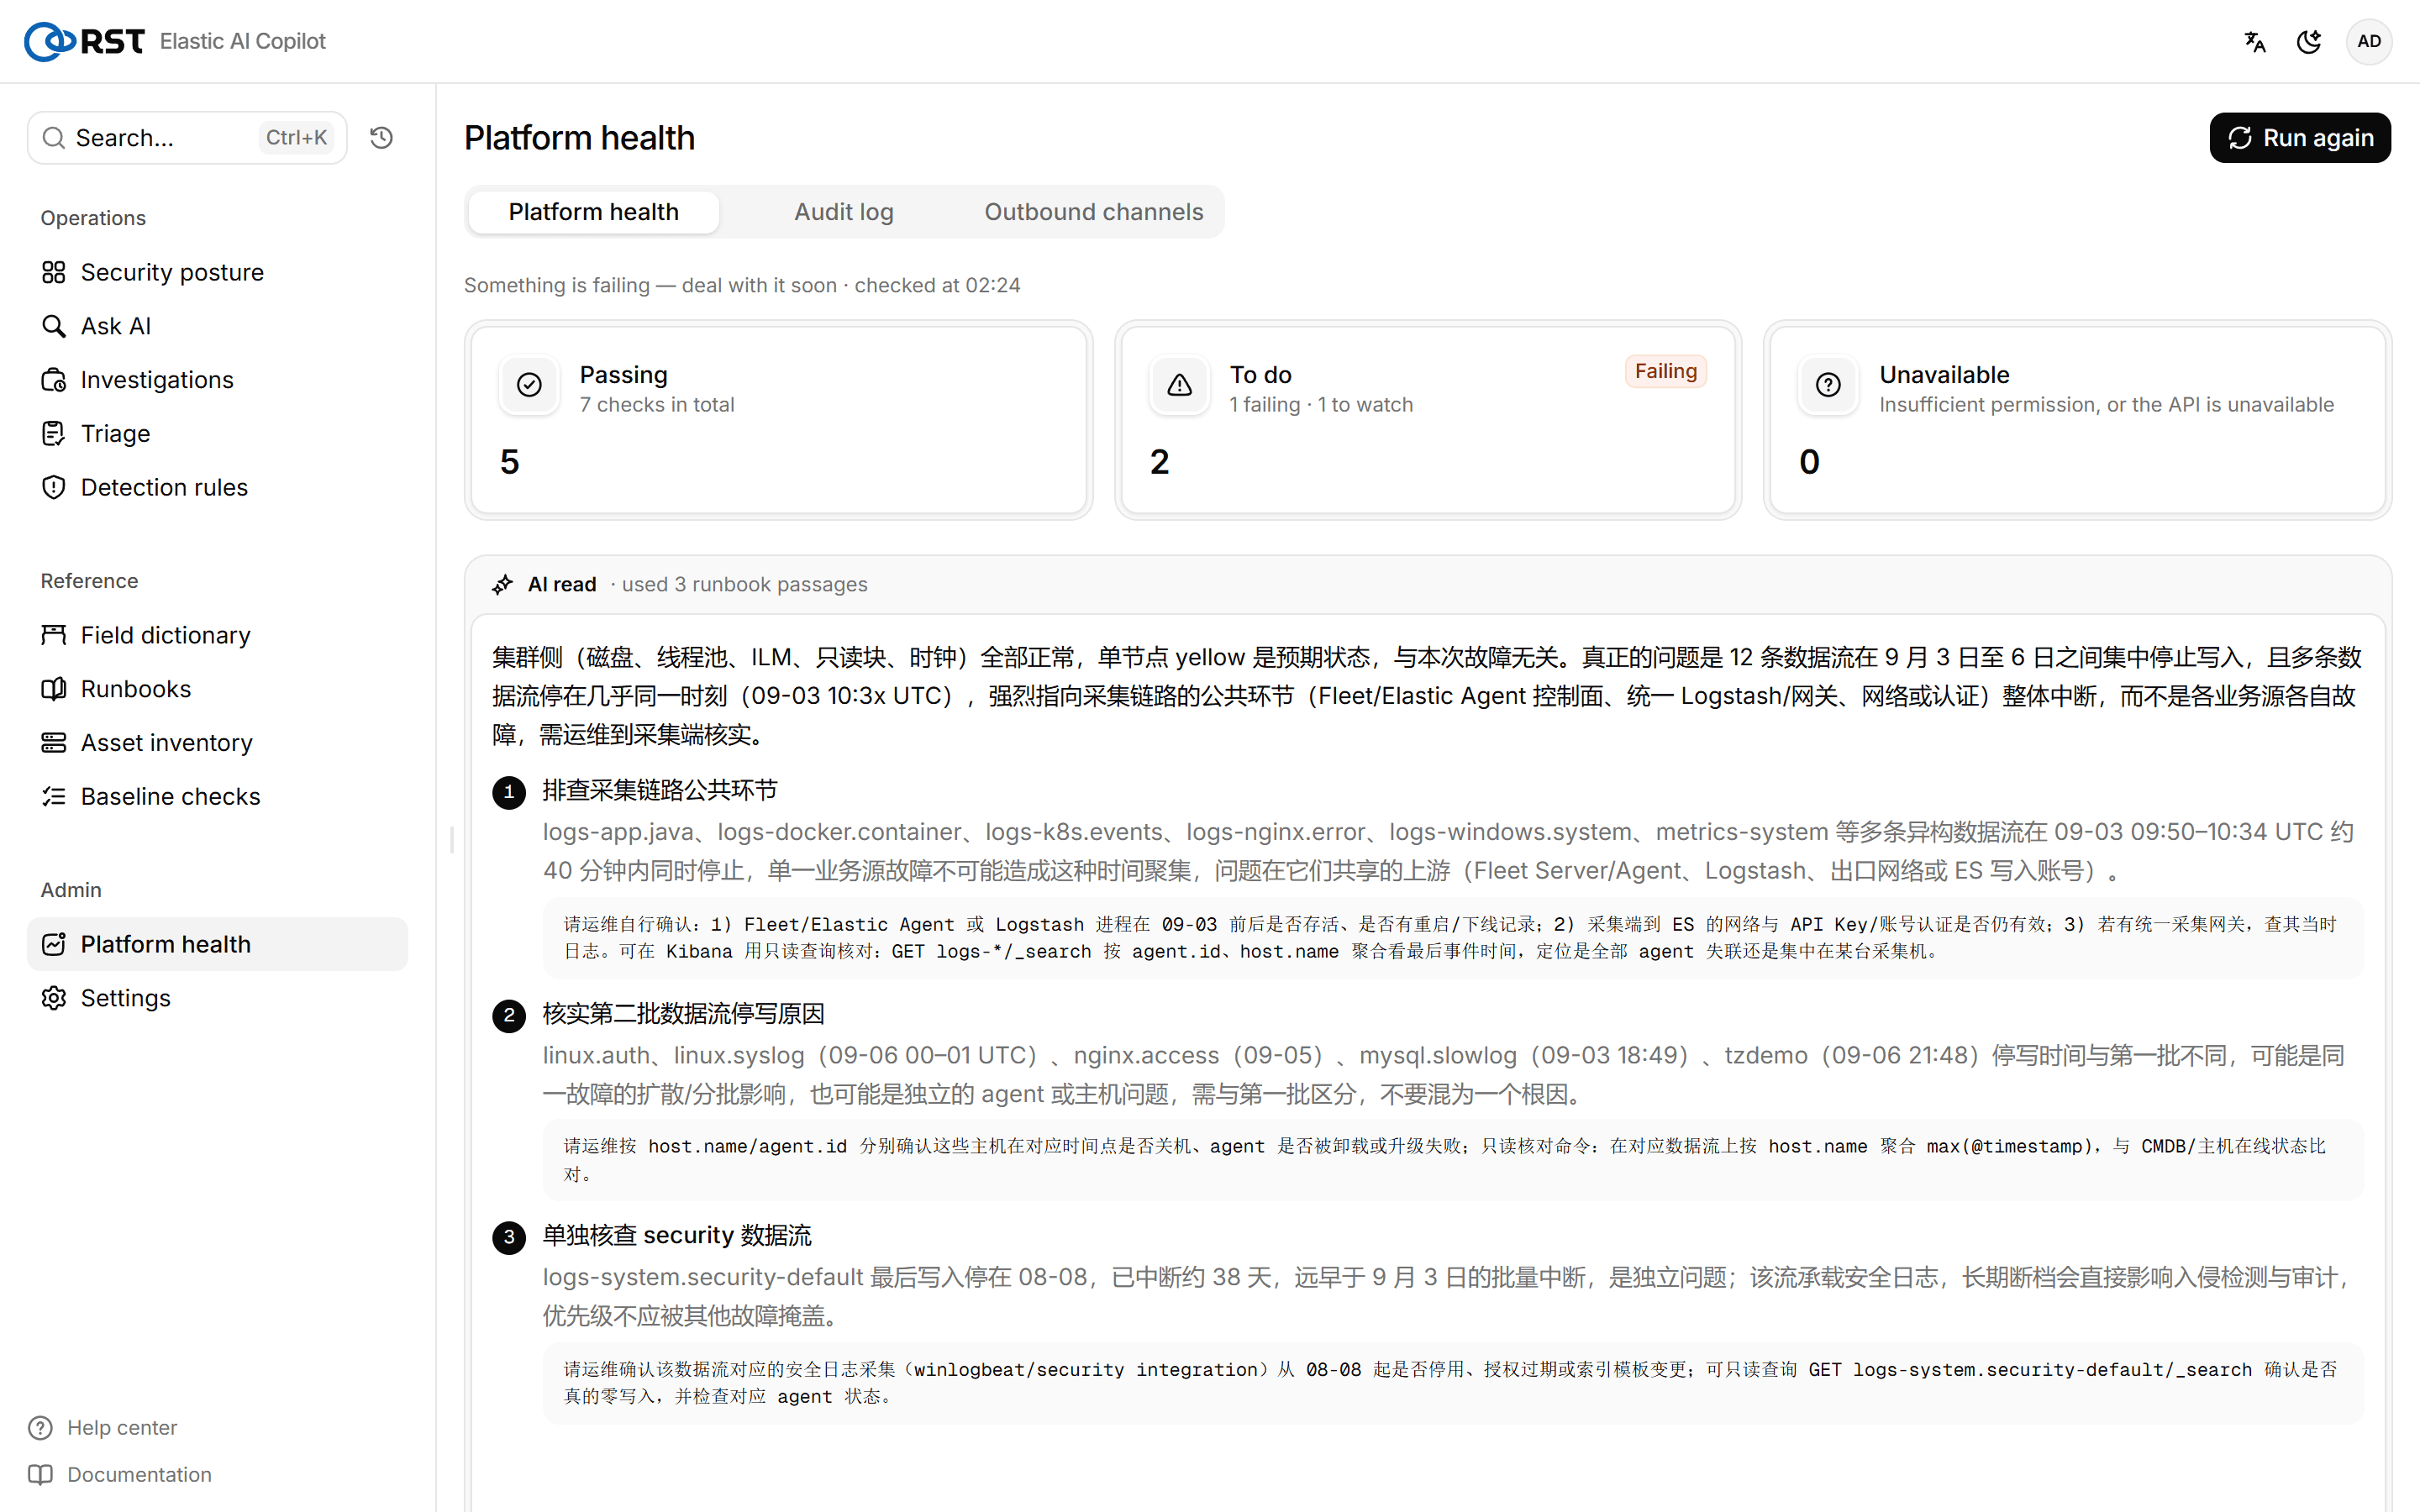
Overview
A one-line verdict (OK / items to watch / failing / some checks unavailable) plus three cards: passed, to handle (failing + watch), unavailable (missing permission or API).
Checks
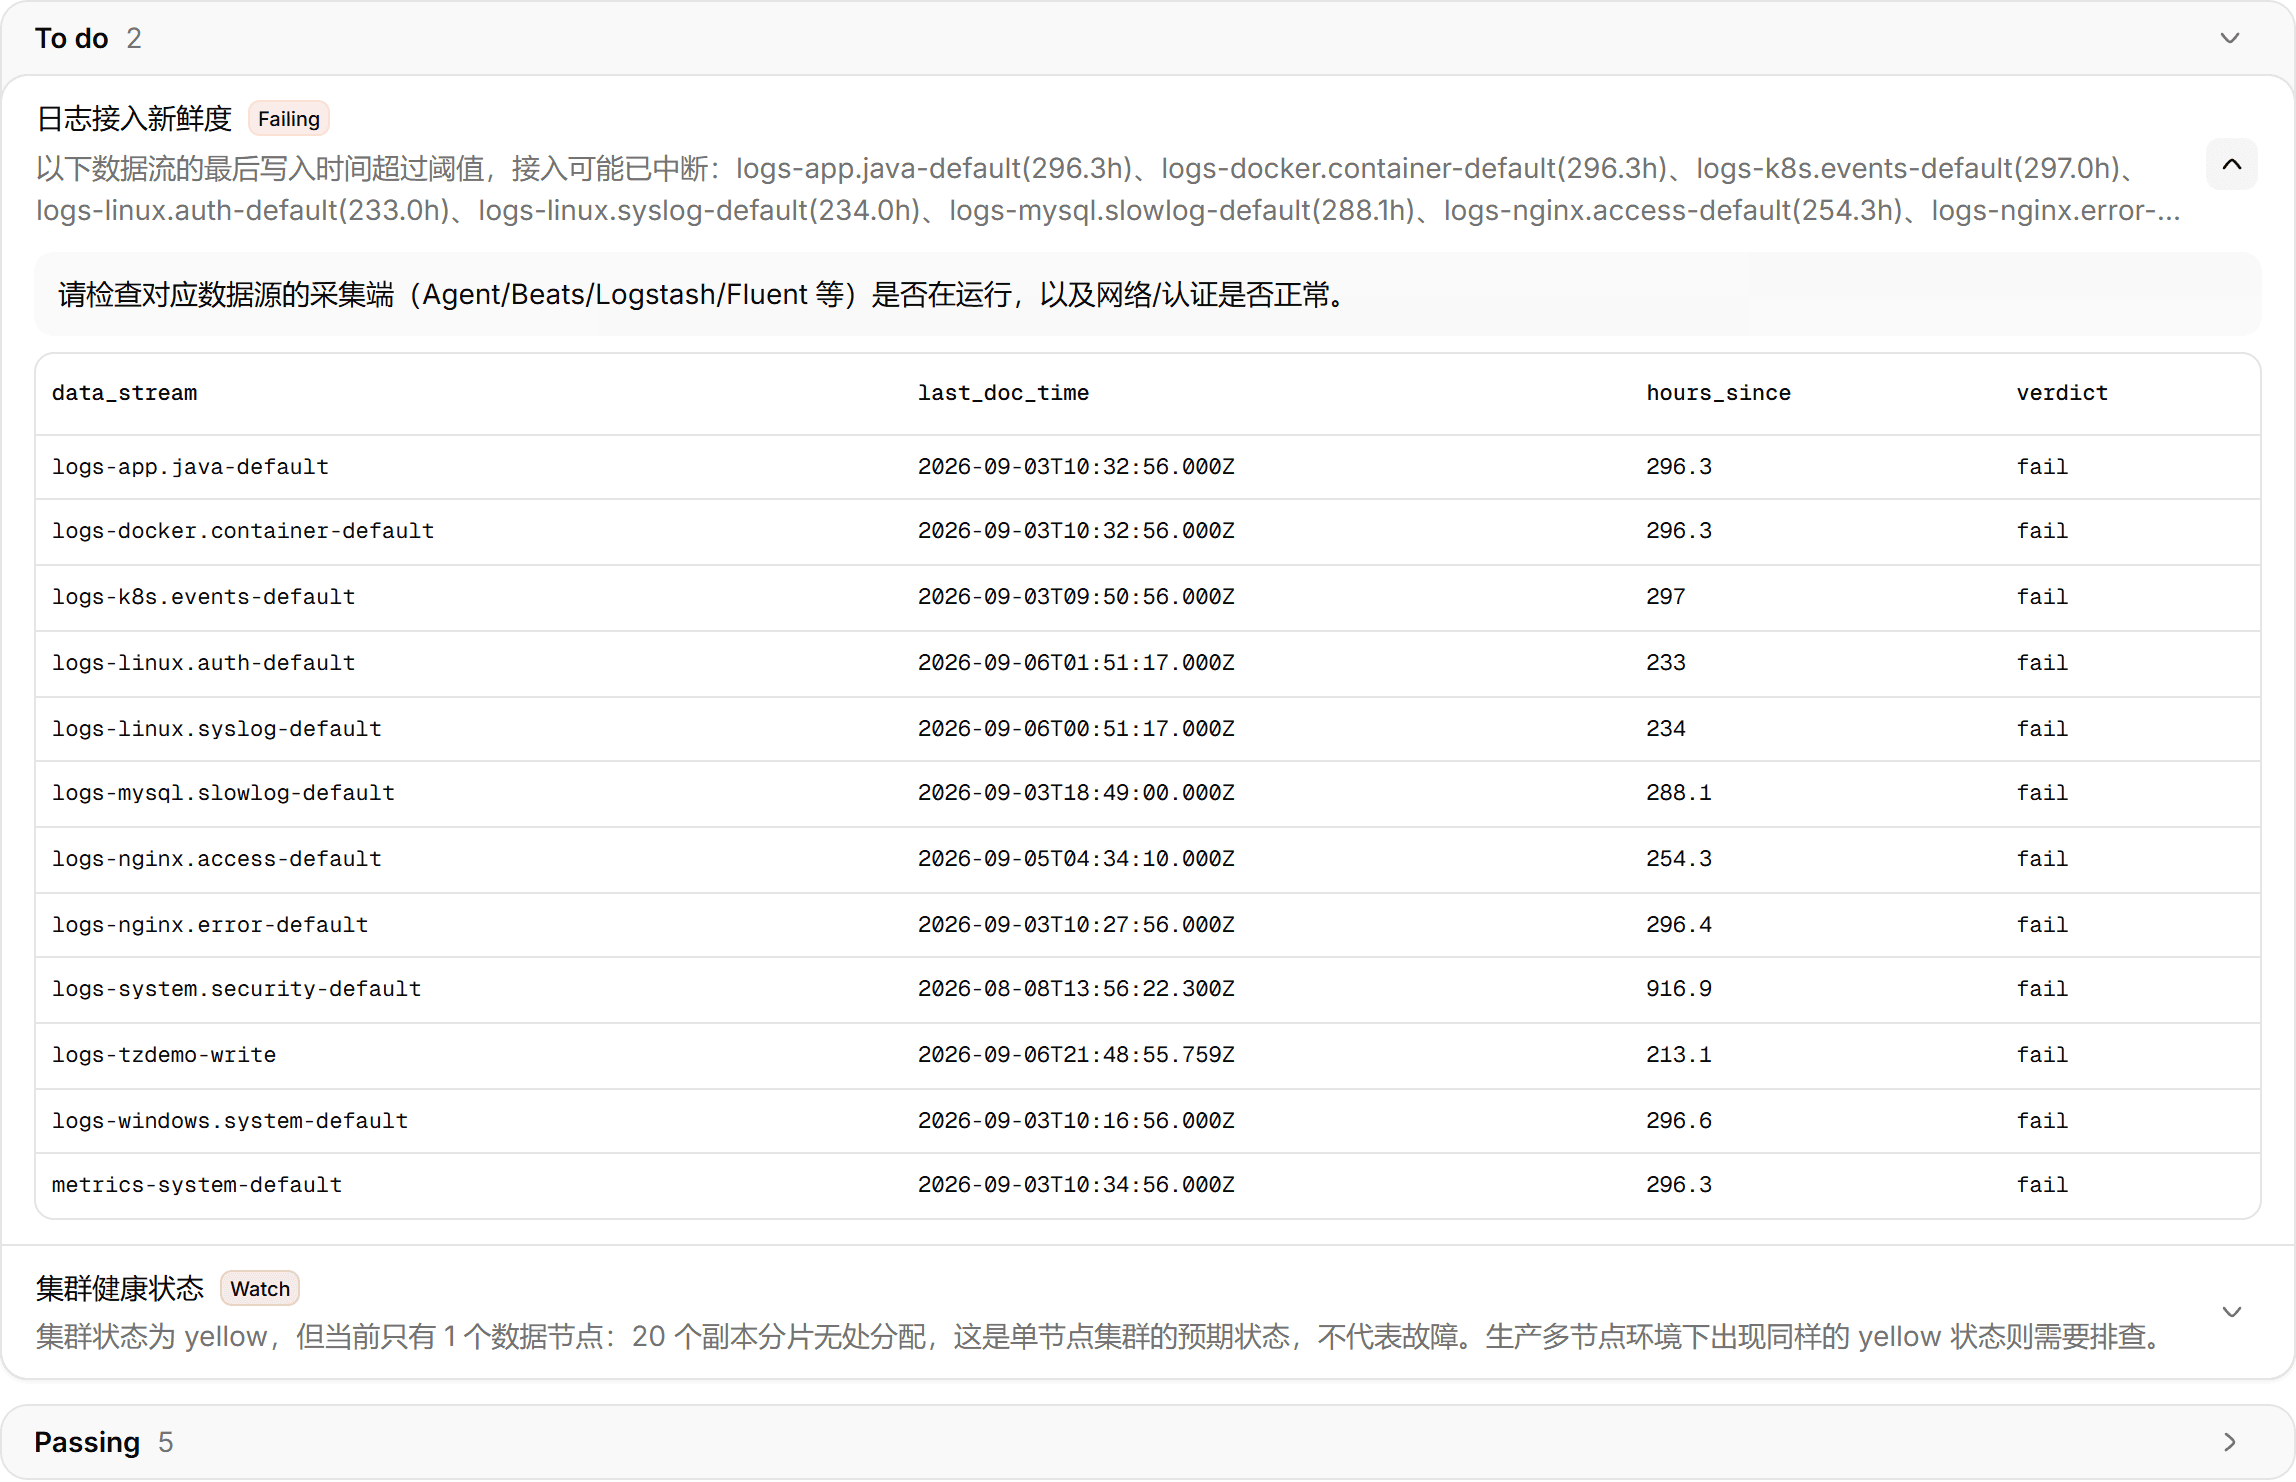
Grouped into to handle / passed / unavailable, one row each: verdict, what was checked, the observed value, why. Areas covered:
| Category | Examples |
|---|---|
| Cluster | Health colour, node count, master election |
| Indices and shards | Unassigned shards, shards per node, oversized / tiny shards, read-only indices |
| Storage | Disk watermarks (low / high / flood), snapshot repositories |
| Lifecycle | ILM execution errors, log indices without ILM |
| Time baseline | "Future" data in indices, ingest lag; Smart query's time-window hint uses the same data |
| Permissions | What ES_USER lacks (listing indices, writing .rst_copilot_*, reading alerts) |
| Kibana | Reachable, version match |
"Unavailable" is not an error: without monitor the cluster-level checks cannot run; grant it and run again.
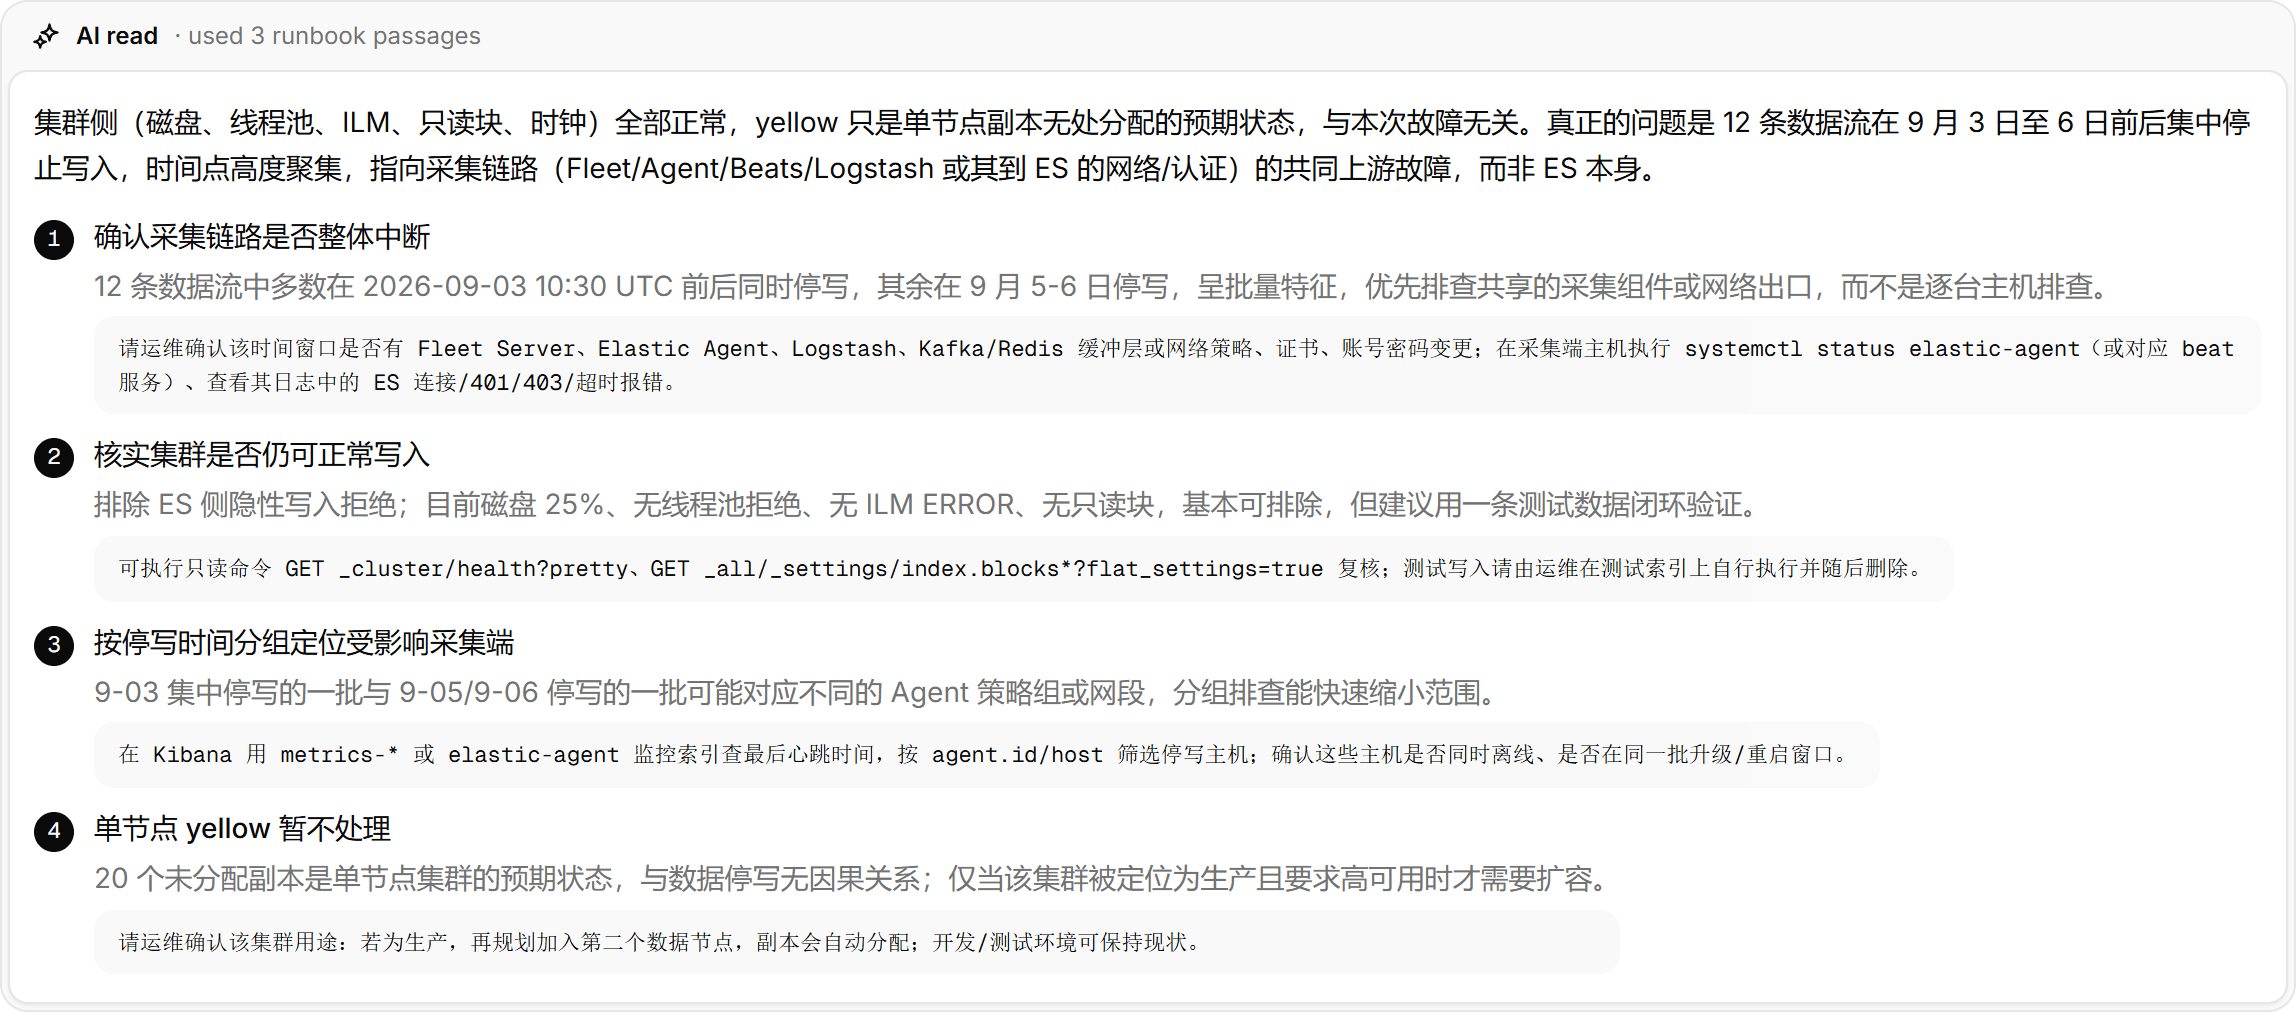
AI read
Paid capability (platform-ops copilot), Standard (14-day trial included) and above. The check-up itself is free.
With non-passing items an "AI read" button appears. The model looks at the items together: which share a root cause, what to fix first and how; it consults the cluster runbooks in Runbooks ("used N knowledge-base passages").
Related pages
- The "Platform issues" card on Posture is this page's non-passing count.
- The top tabs also hold Audit and Notifications.
Reports
Daily / weekly / monthly reports: alert posture, top rules and entities, baseline pass rate, model usage and health. On demand or scheduled, archived and pushed.
Settings
Administrator configuration: the Elasticsearch connection, index whitelist, field-masking mode, audit and forwarding, online update. Changes apply immediately.