

Live alerts
Ingest Elastic Security detection alerts (polling or webhook), each with an automatic summary; group, filter and disposition them in the feed; investigate a single alert.
Live alerts sits in the tabs of Posture. Alerts come from Elastic Security (or anything else writing to the alert index); the gateway ingests them, adds a summary and tracks disposition. Ingest and disposition are free; alert investigation is paid.
Ingesting alerts

The "Ingest" block at the bottom of the page; both sources can be on at once.
| Source | How it works | Latency | Setup |
|---|---|---|---|
| Polling | The gateway tails the alert index on an interval | ≈ the interval (10 s default) | Alert index (default .alerts-security.alerts-default, the read alias, not the .internal.* backing index); ES_USER needs read on it |
| Webhook push | Kibana calls the gateway when a rule fires | none | Set a secret; create a Kibana Webhook connector with URL https://<hostname>/api/alerts/ingest and header X-RST-Alert-Token: <secret> |
Each ingested alert gets a one-line model summary. One webhook push carries up to 200 alerts; concurrency and time budget are bounded by RST_ALERT_INGEST_CONCURRENCY / RST_ALERT_INGEST_BUDGET_S.
Overview
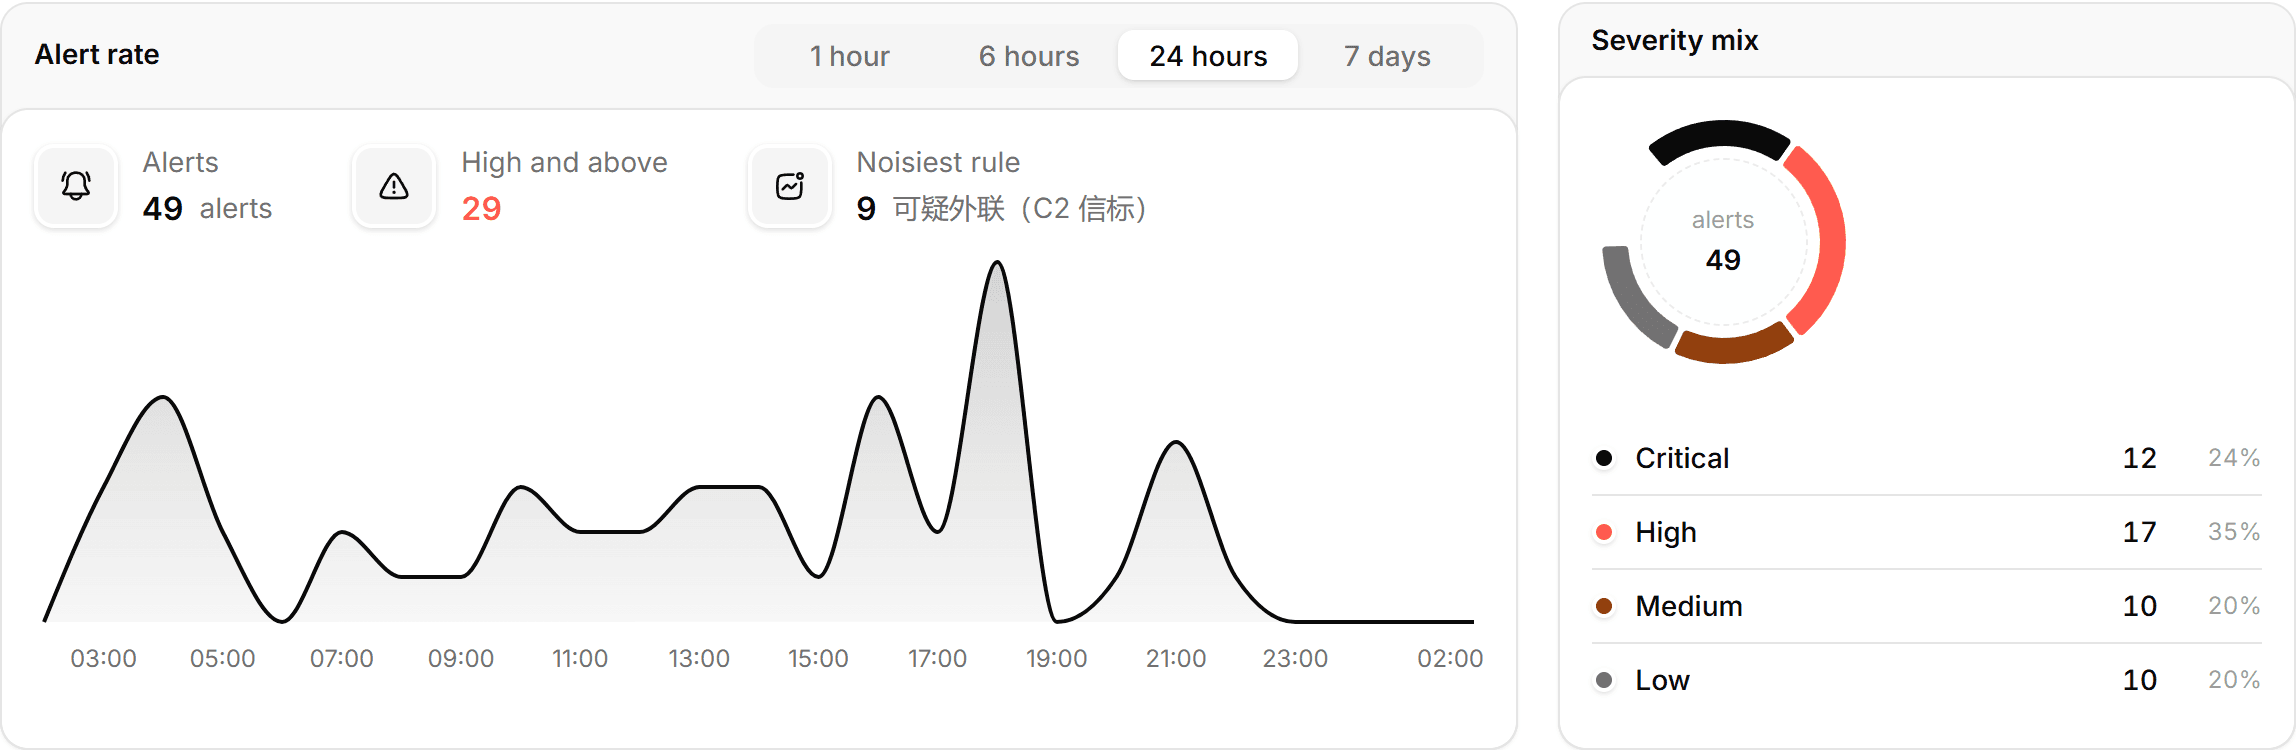
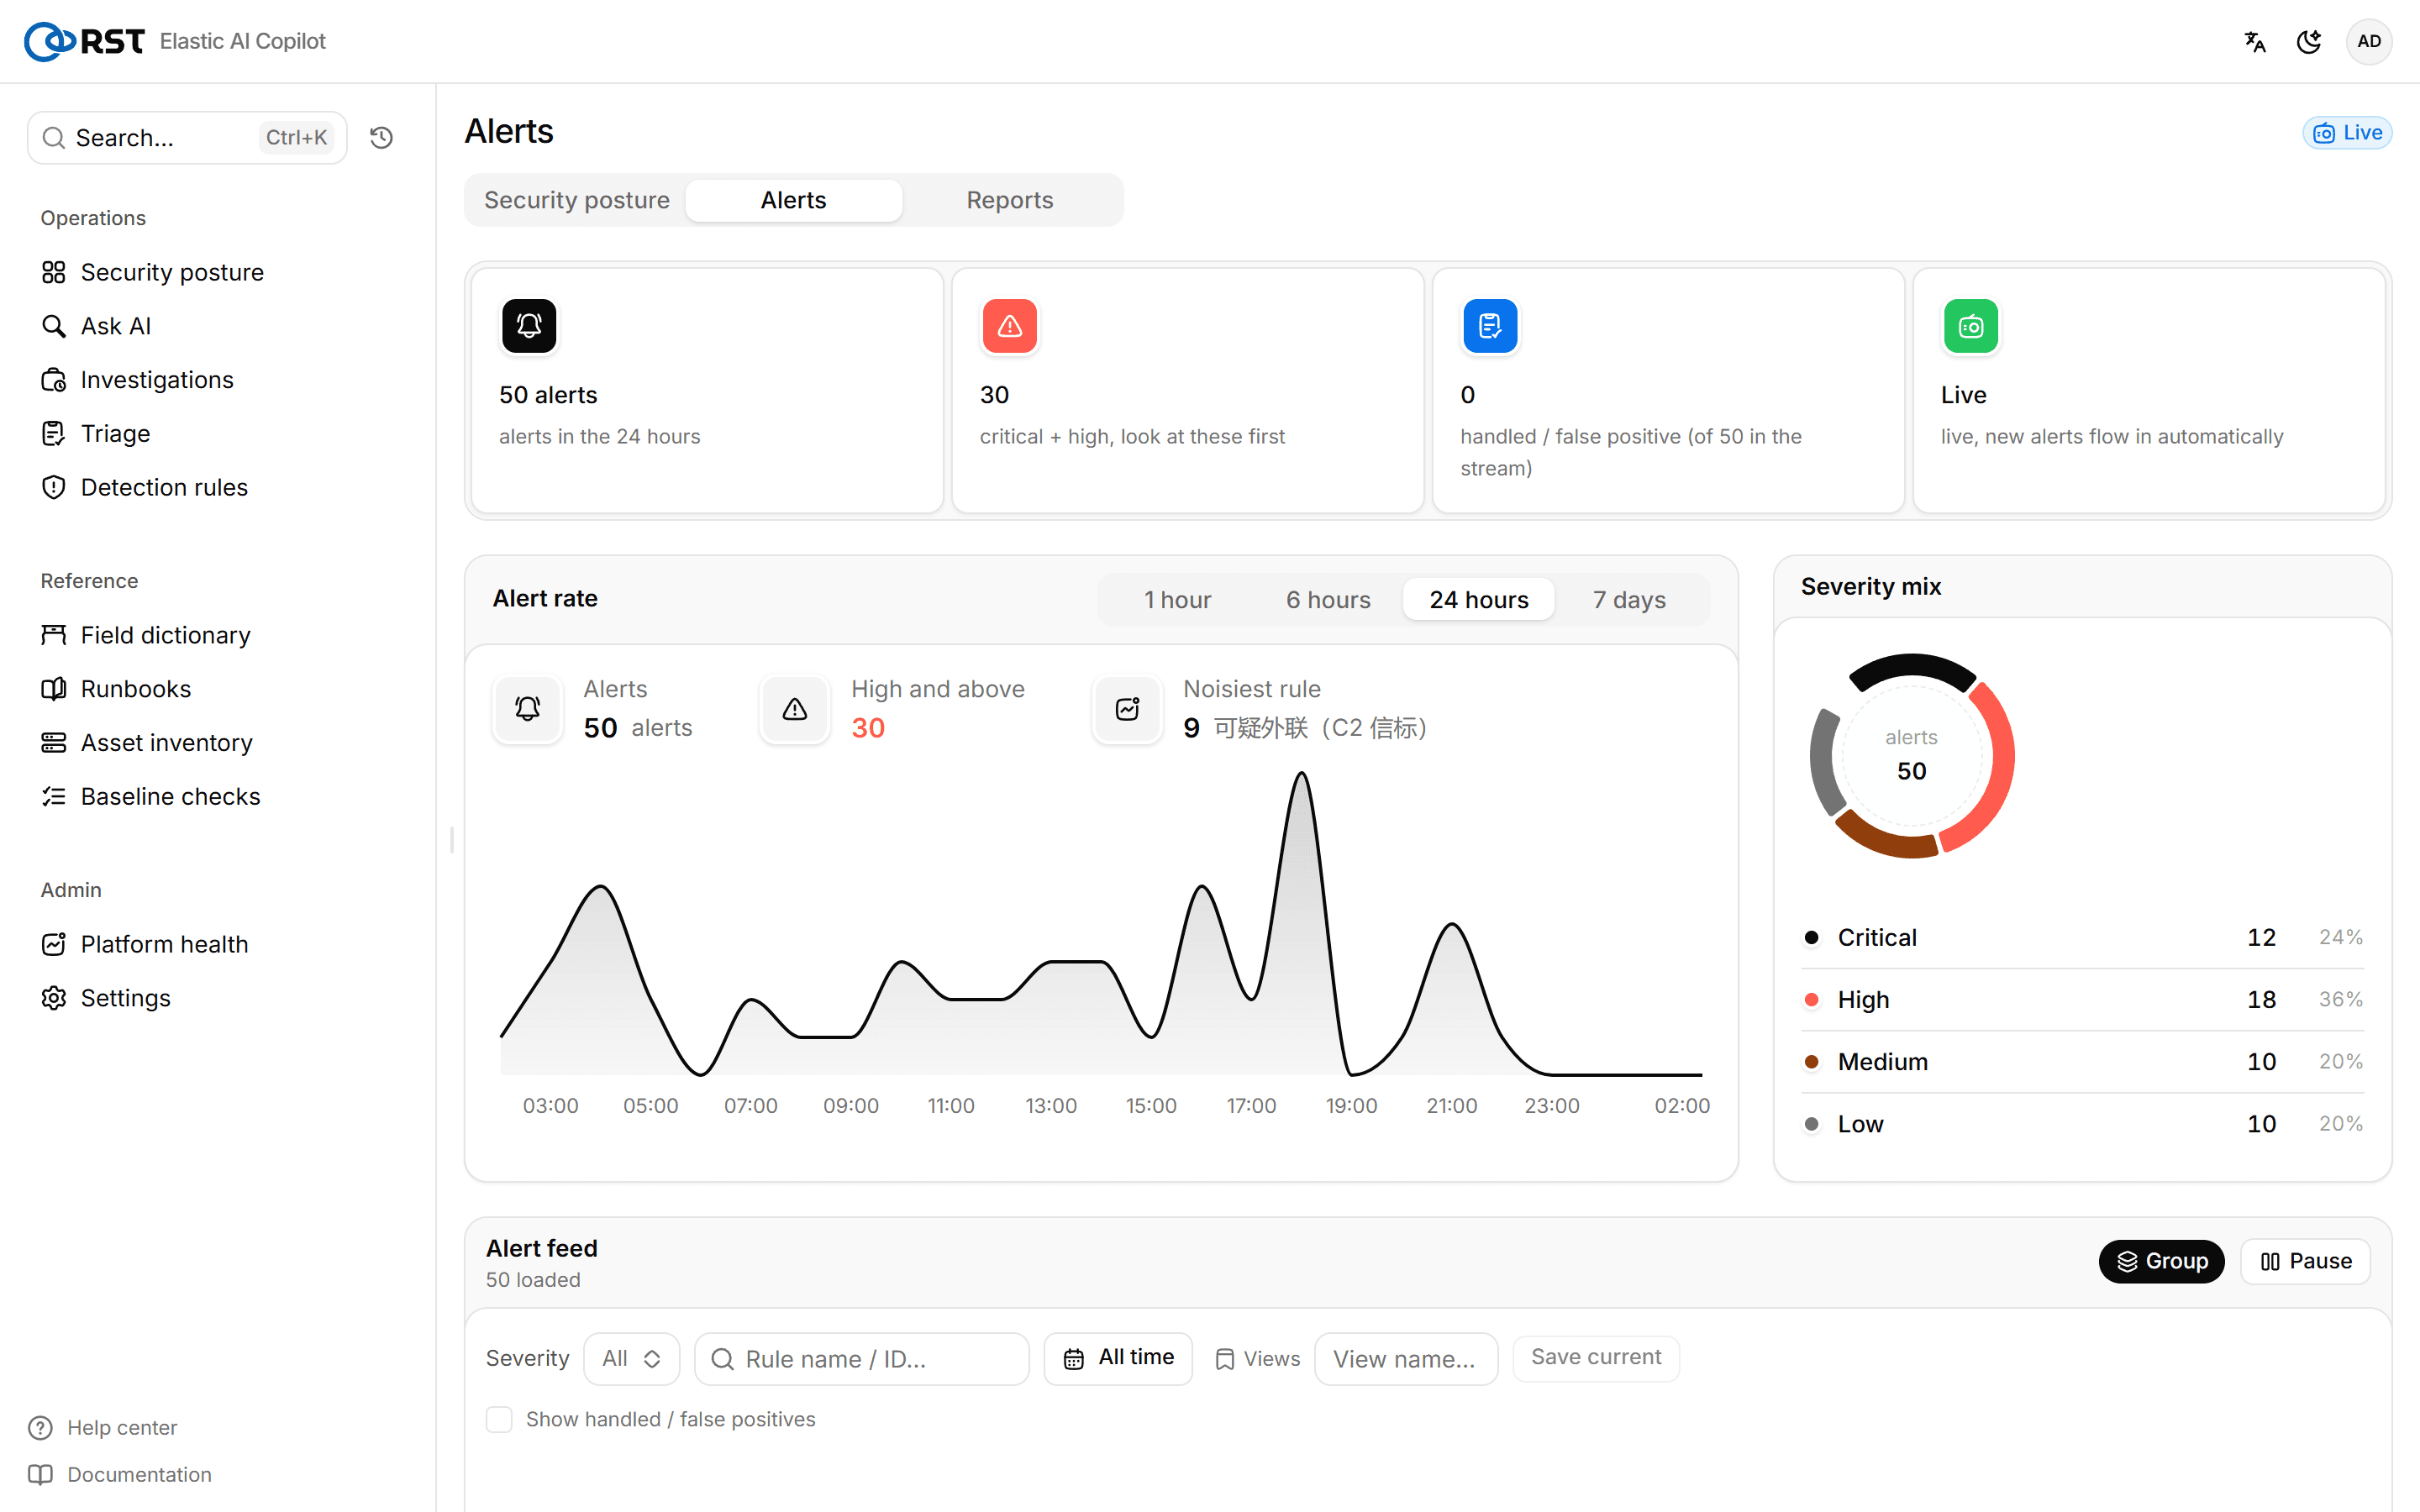
Three cards: alerts in the last 24 hours, critical + high, handled / false positives; then an alert-rate chart (1 h / 6 h / 24 h / 7 d) and the noisiest rules in that window.
The feed
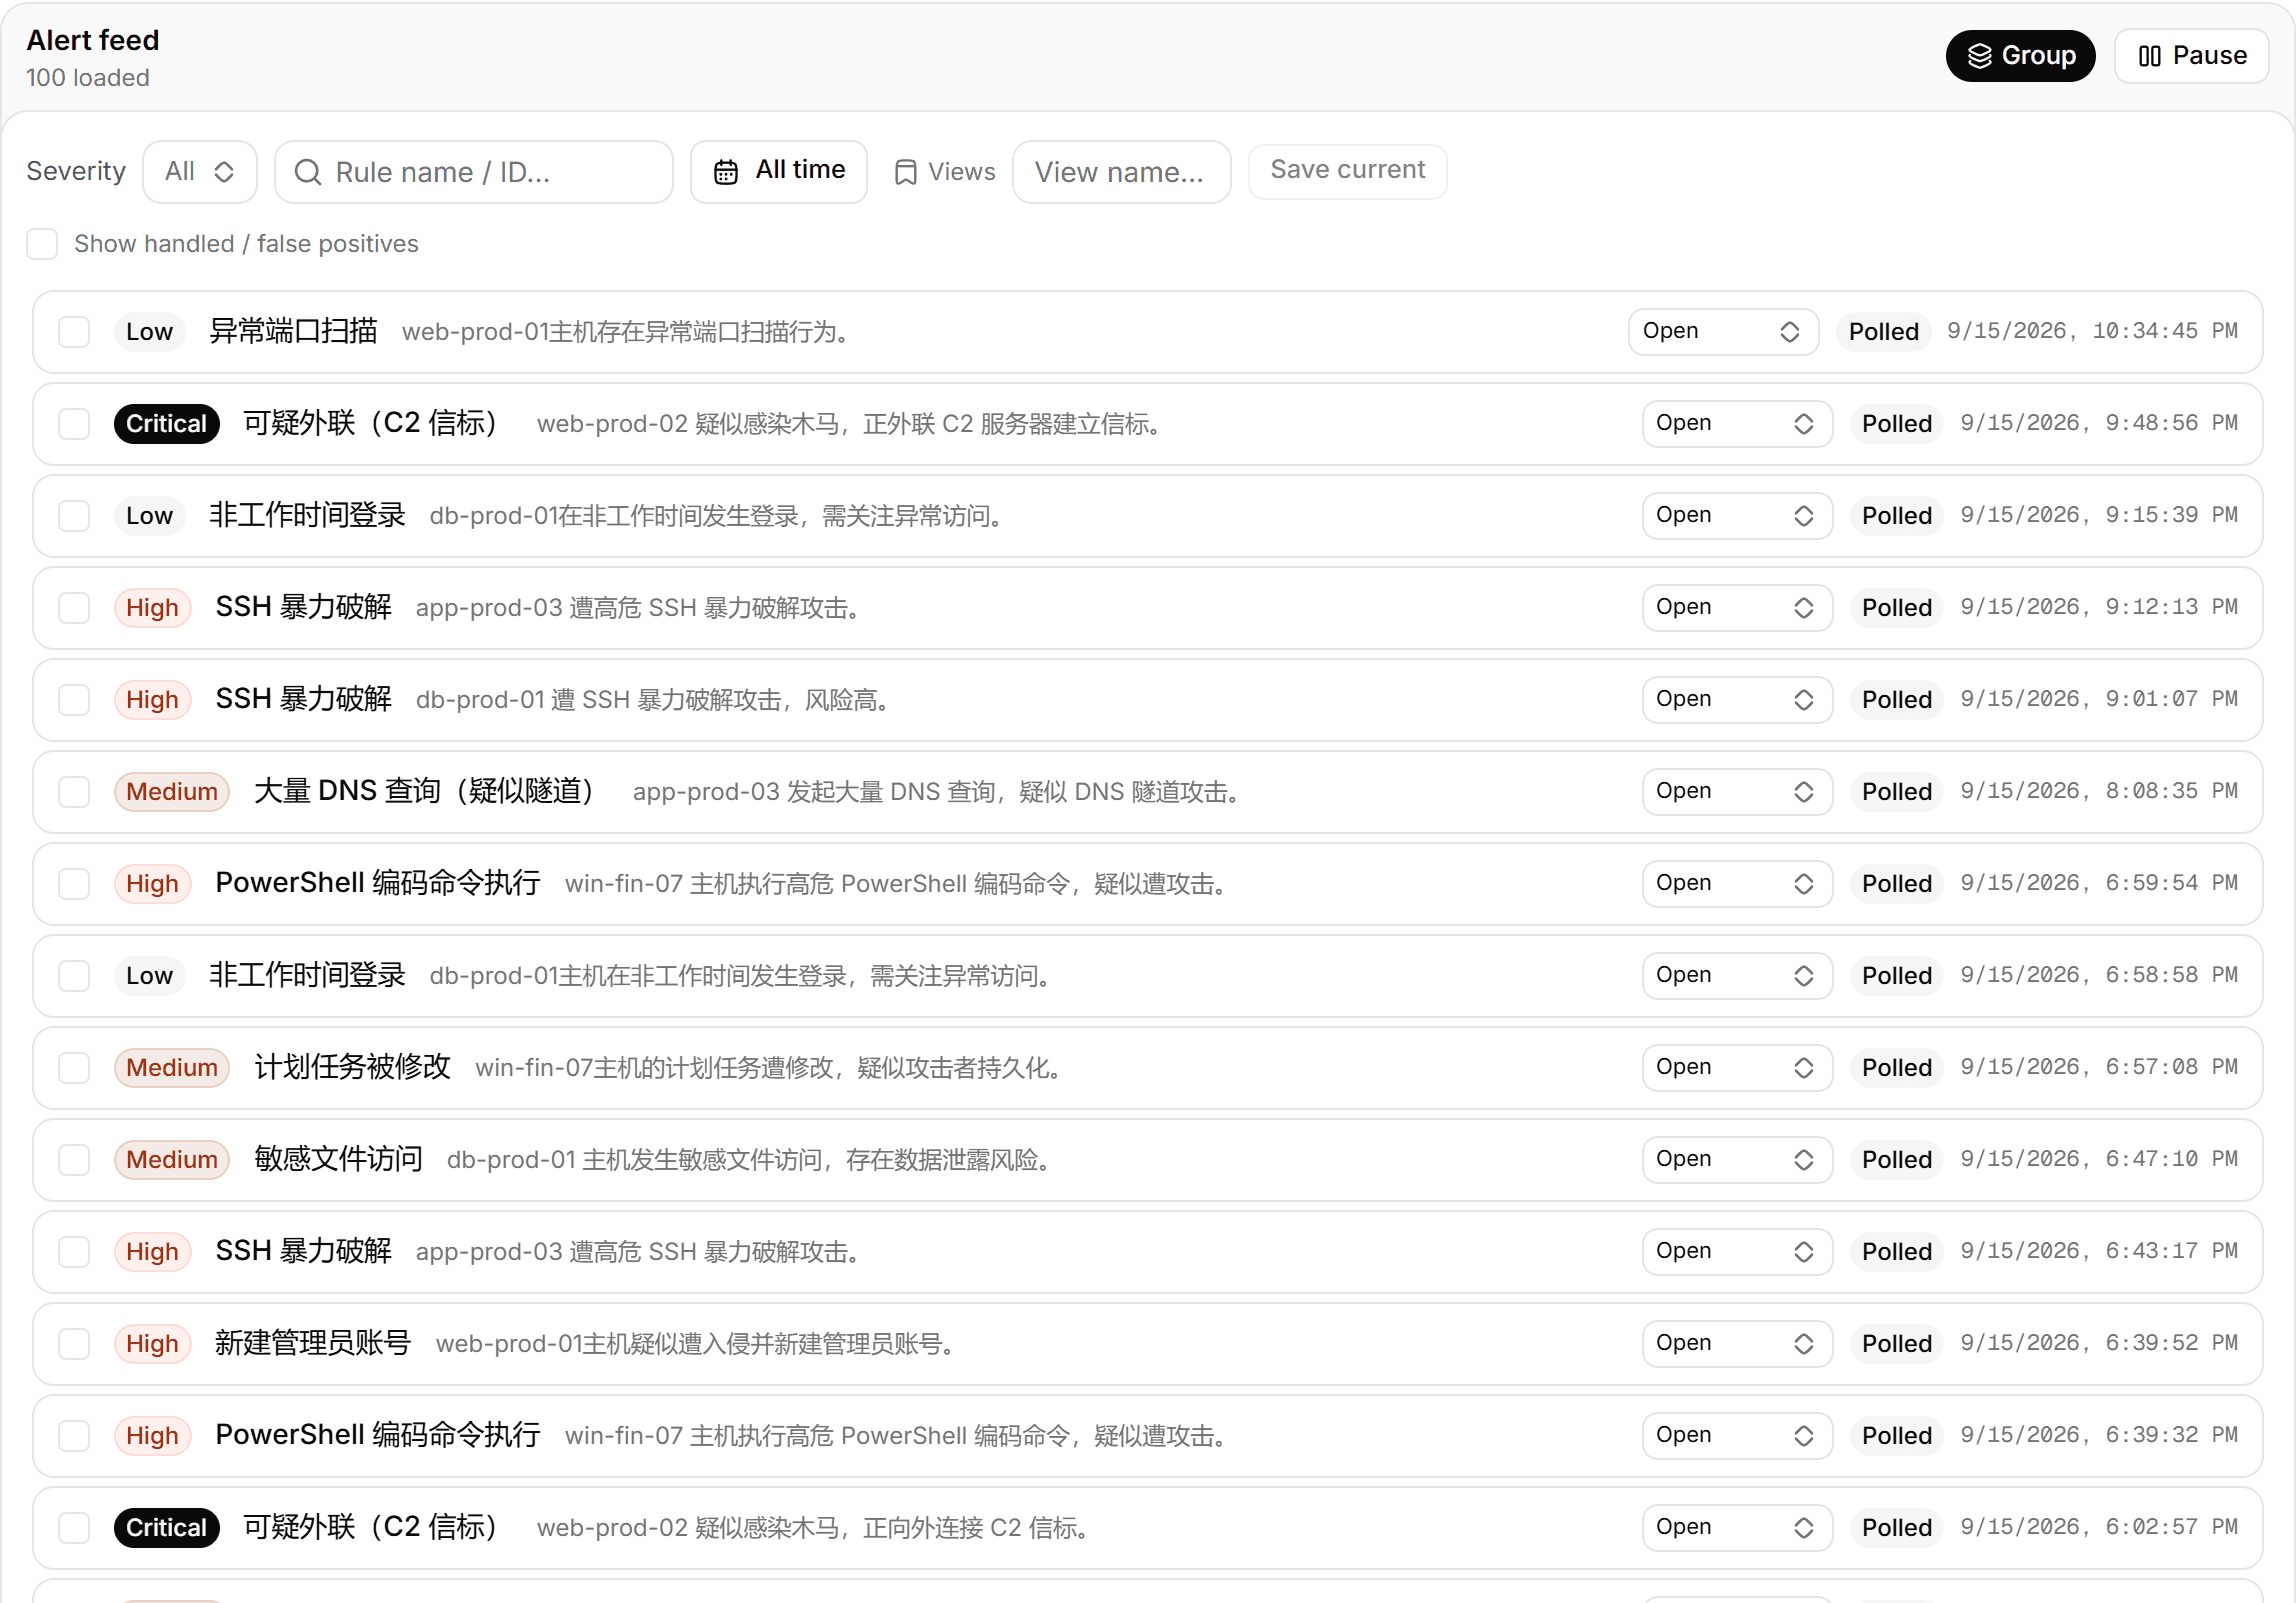
- Live: new alerts appear at the top. Scrolling down pauses it ("paused while scrolled"); back to the top resumes.
- Group: same rule + same subject folds into one row; expand for the children.
- Filter: severity, time range, keyword.
- Views: save the current filter combination under a name and switch to it later.
- Disposition: open / handled / false positive / escalated, shared by the team; tick several rows for bulk changes, with "undo".
- Handled / false-positive alerts are hidden by default; "Show handled" reveals them.
Alert details
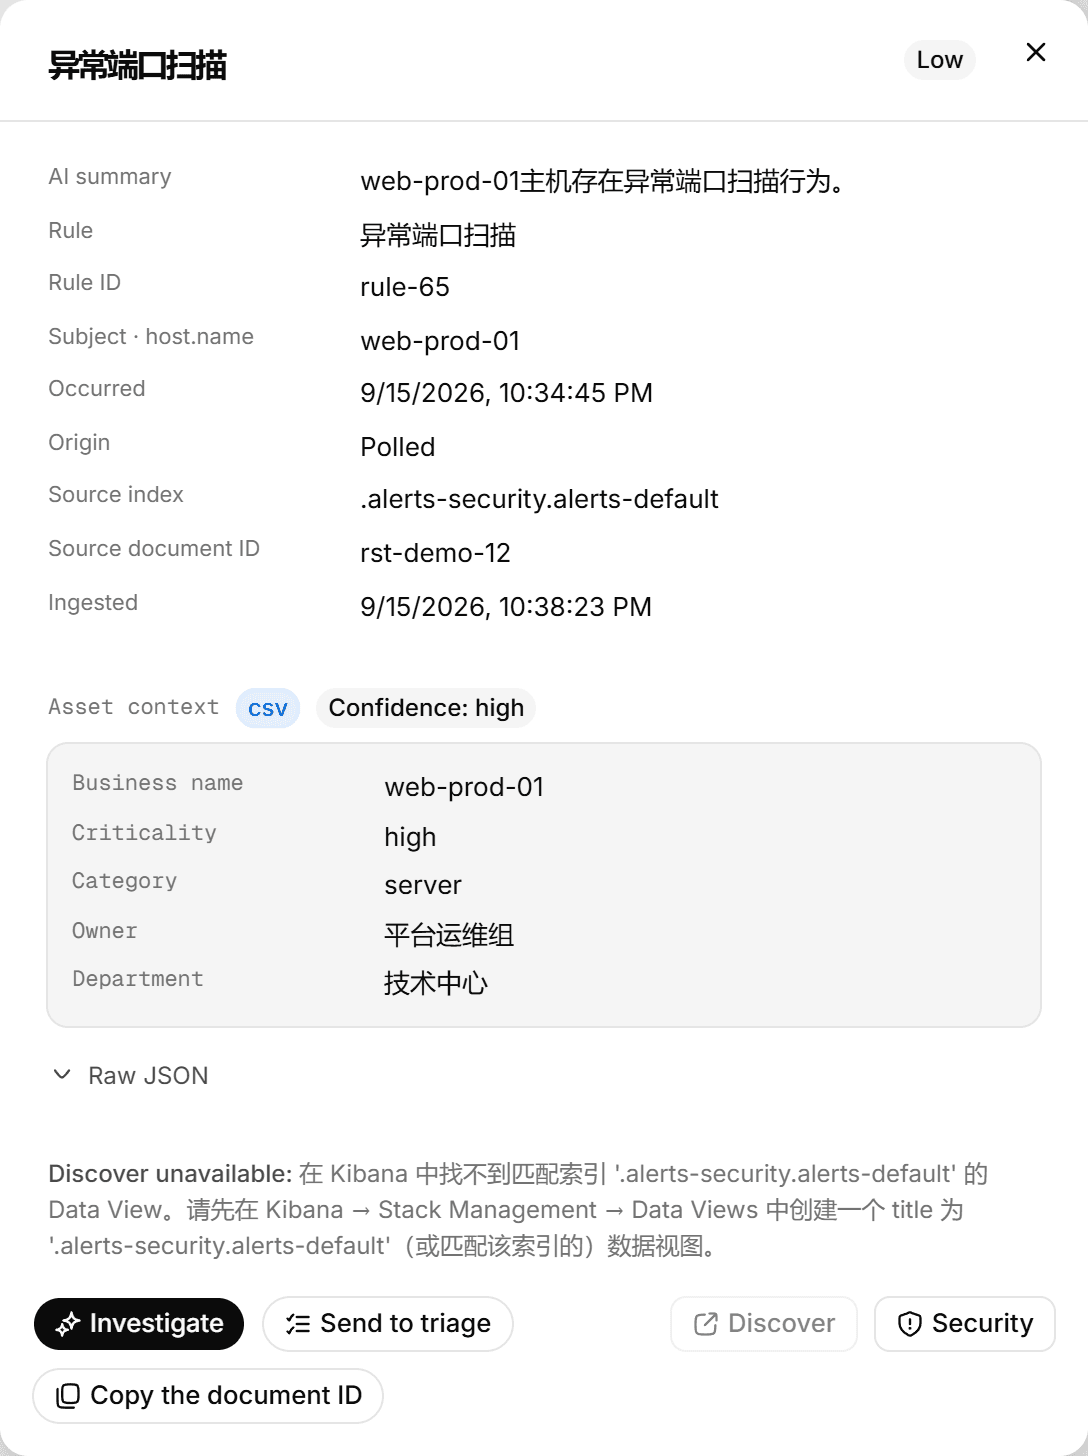
Click a row for the right-hand sheet: summary, raw fields, rule, subject, and asset / owner data enriched from the Asset ledger.
Alert investigation
Paid capability, Standard (14-day trial included) and above.
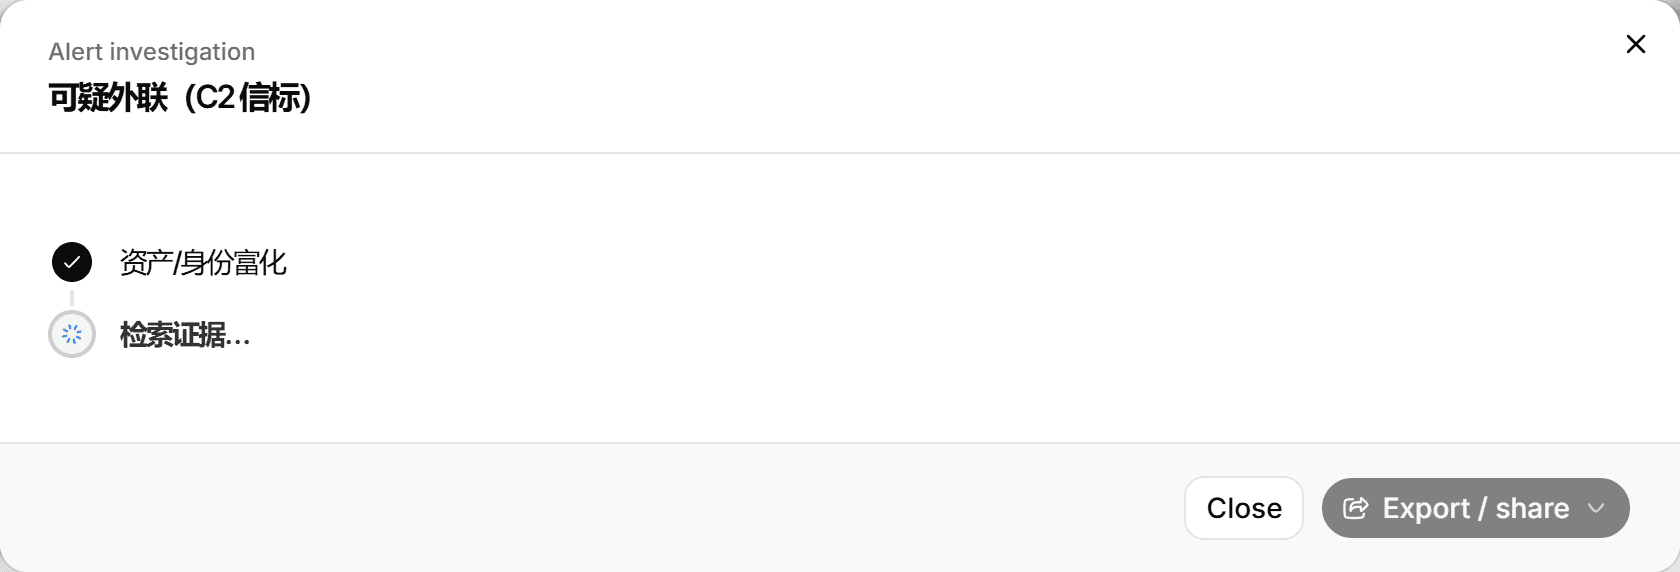
Click "Investigate" in the sheet. The gateway gathers evidence around the alert's subject (host / IP / account) within the window: asset / identity enrichment first, then several rounds of retrieval, then a verdict.
Report structure:
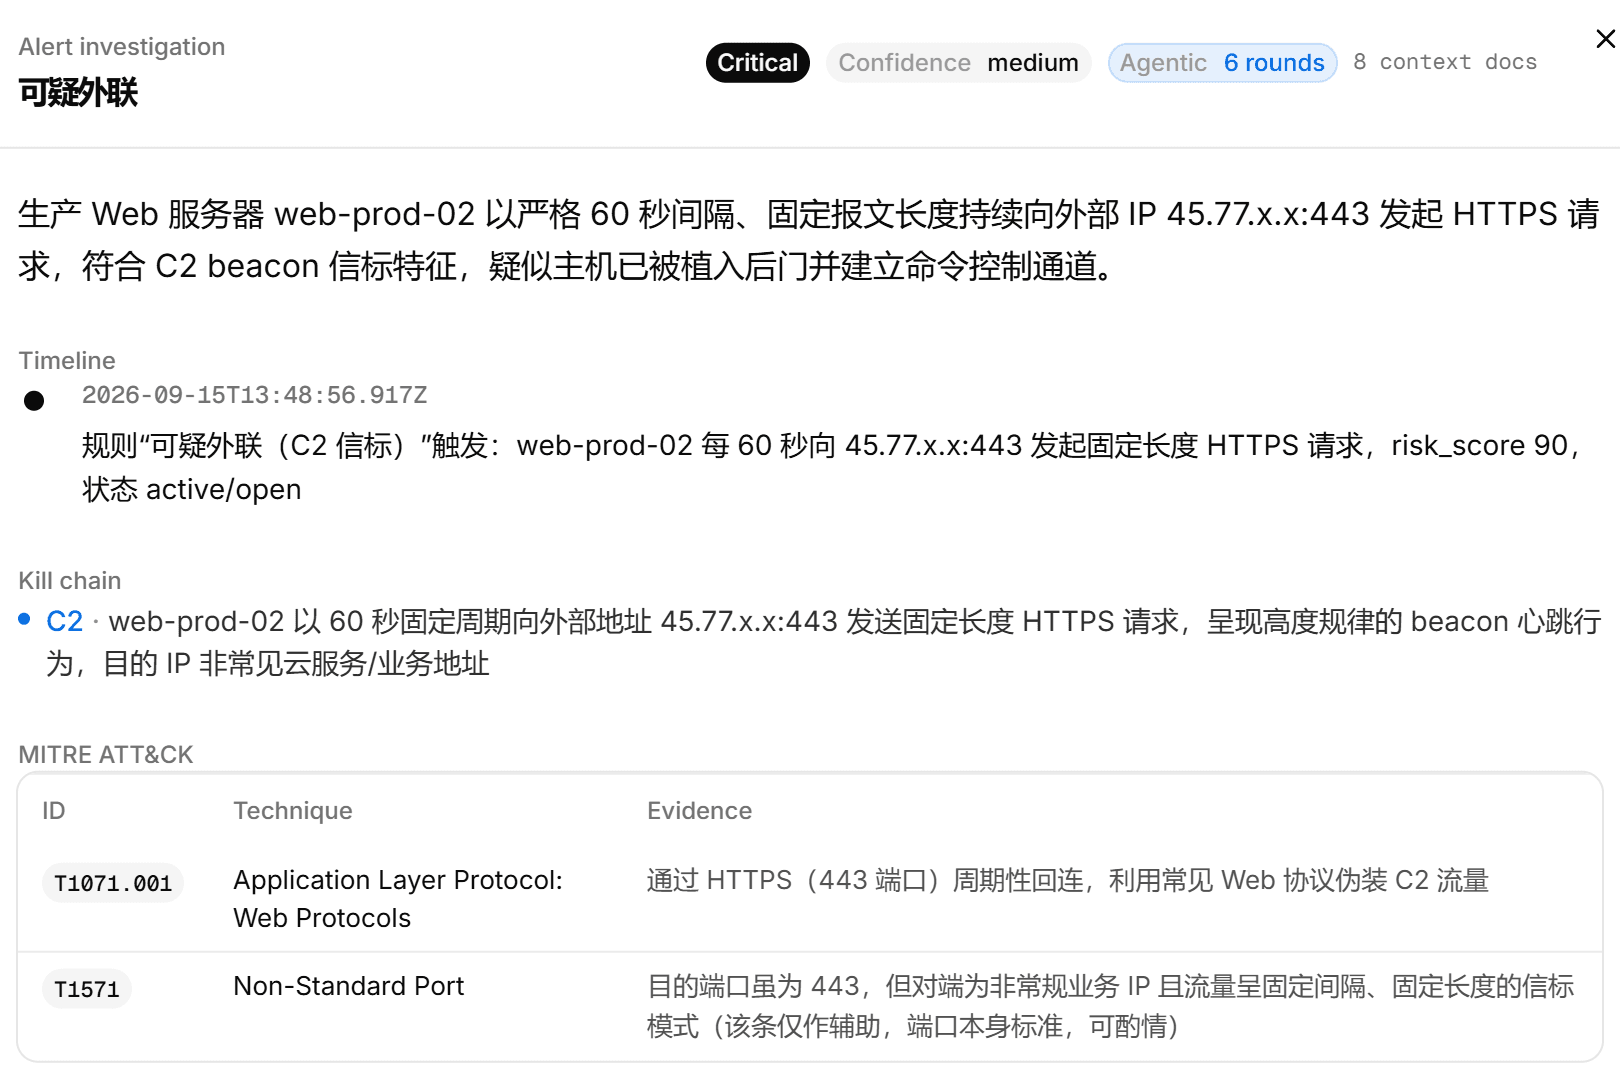
| Block | Content |
|---|---|
| Badges | Severity, likely false positive, confidence, how many agentic rounds ran, how many context documents were pulled |
| Verdict | What this is and whether it matters |
| False-positive assessment | Why it is, or is not, a false positive |
| Timeline | Related events in order |
| Affected assets | Hosts / IPs / accounts involved |
| Recommended actions | Numbered concrete steps |
| Retrieval trace | Every step: which index, how many hits, the parameters; failed steps (an index outside the whitelist) are listed too |
At the bottom: change the disposition, turn it into a detection rule (handed to Detection rules), push the conclusion to Notifications, export / share. Every investigation is archived in Analysis records.
The 10.30.x.x in the screenshot is cloud masking mode: IPs and accounts are replaced before they reach the model. Air-gapped / private modes show real values.
Alert push
New alerts above a threshold are pushed to Feishu / DingTalk / WeCom / Teams / Slack / mail automatically; set the alert threshold and bind destinations in Notifications.
Posture
First screen after login: alerts in the window, critical + high, baseline failures, platform issues; the ten noisiest rules and ten latest alerts.
Reports
Daily / weekly / monthly reports: alert posture, top rules and entities, baseline pass rate, model usage and health. On demand or scheduled, archived and pushed.