

A tour of the UI
The three navigation groups, accounts and roles, the Ctrl+K command palette, and the quota meter shown before activation.
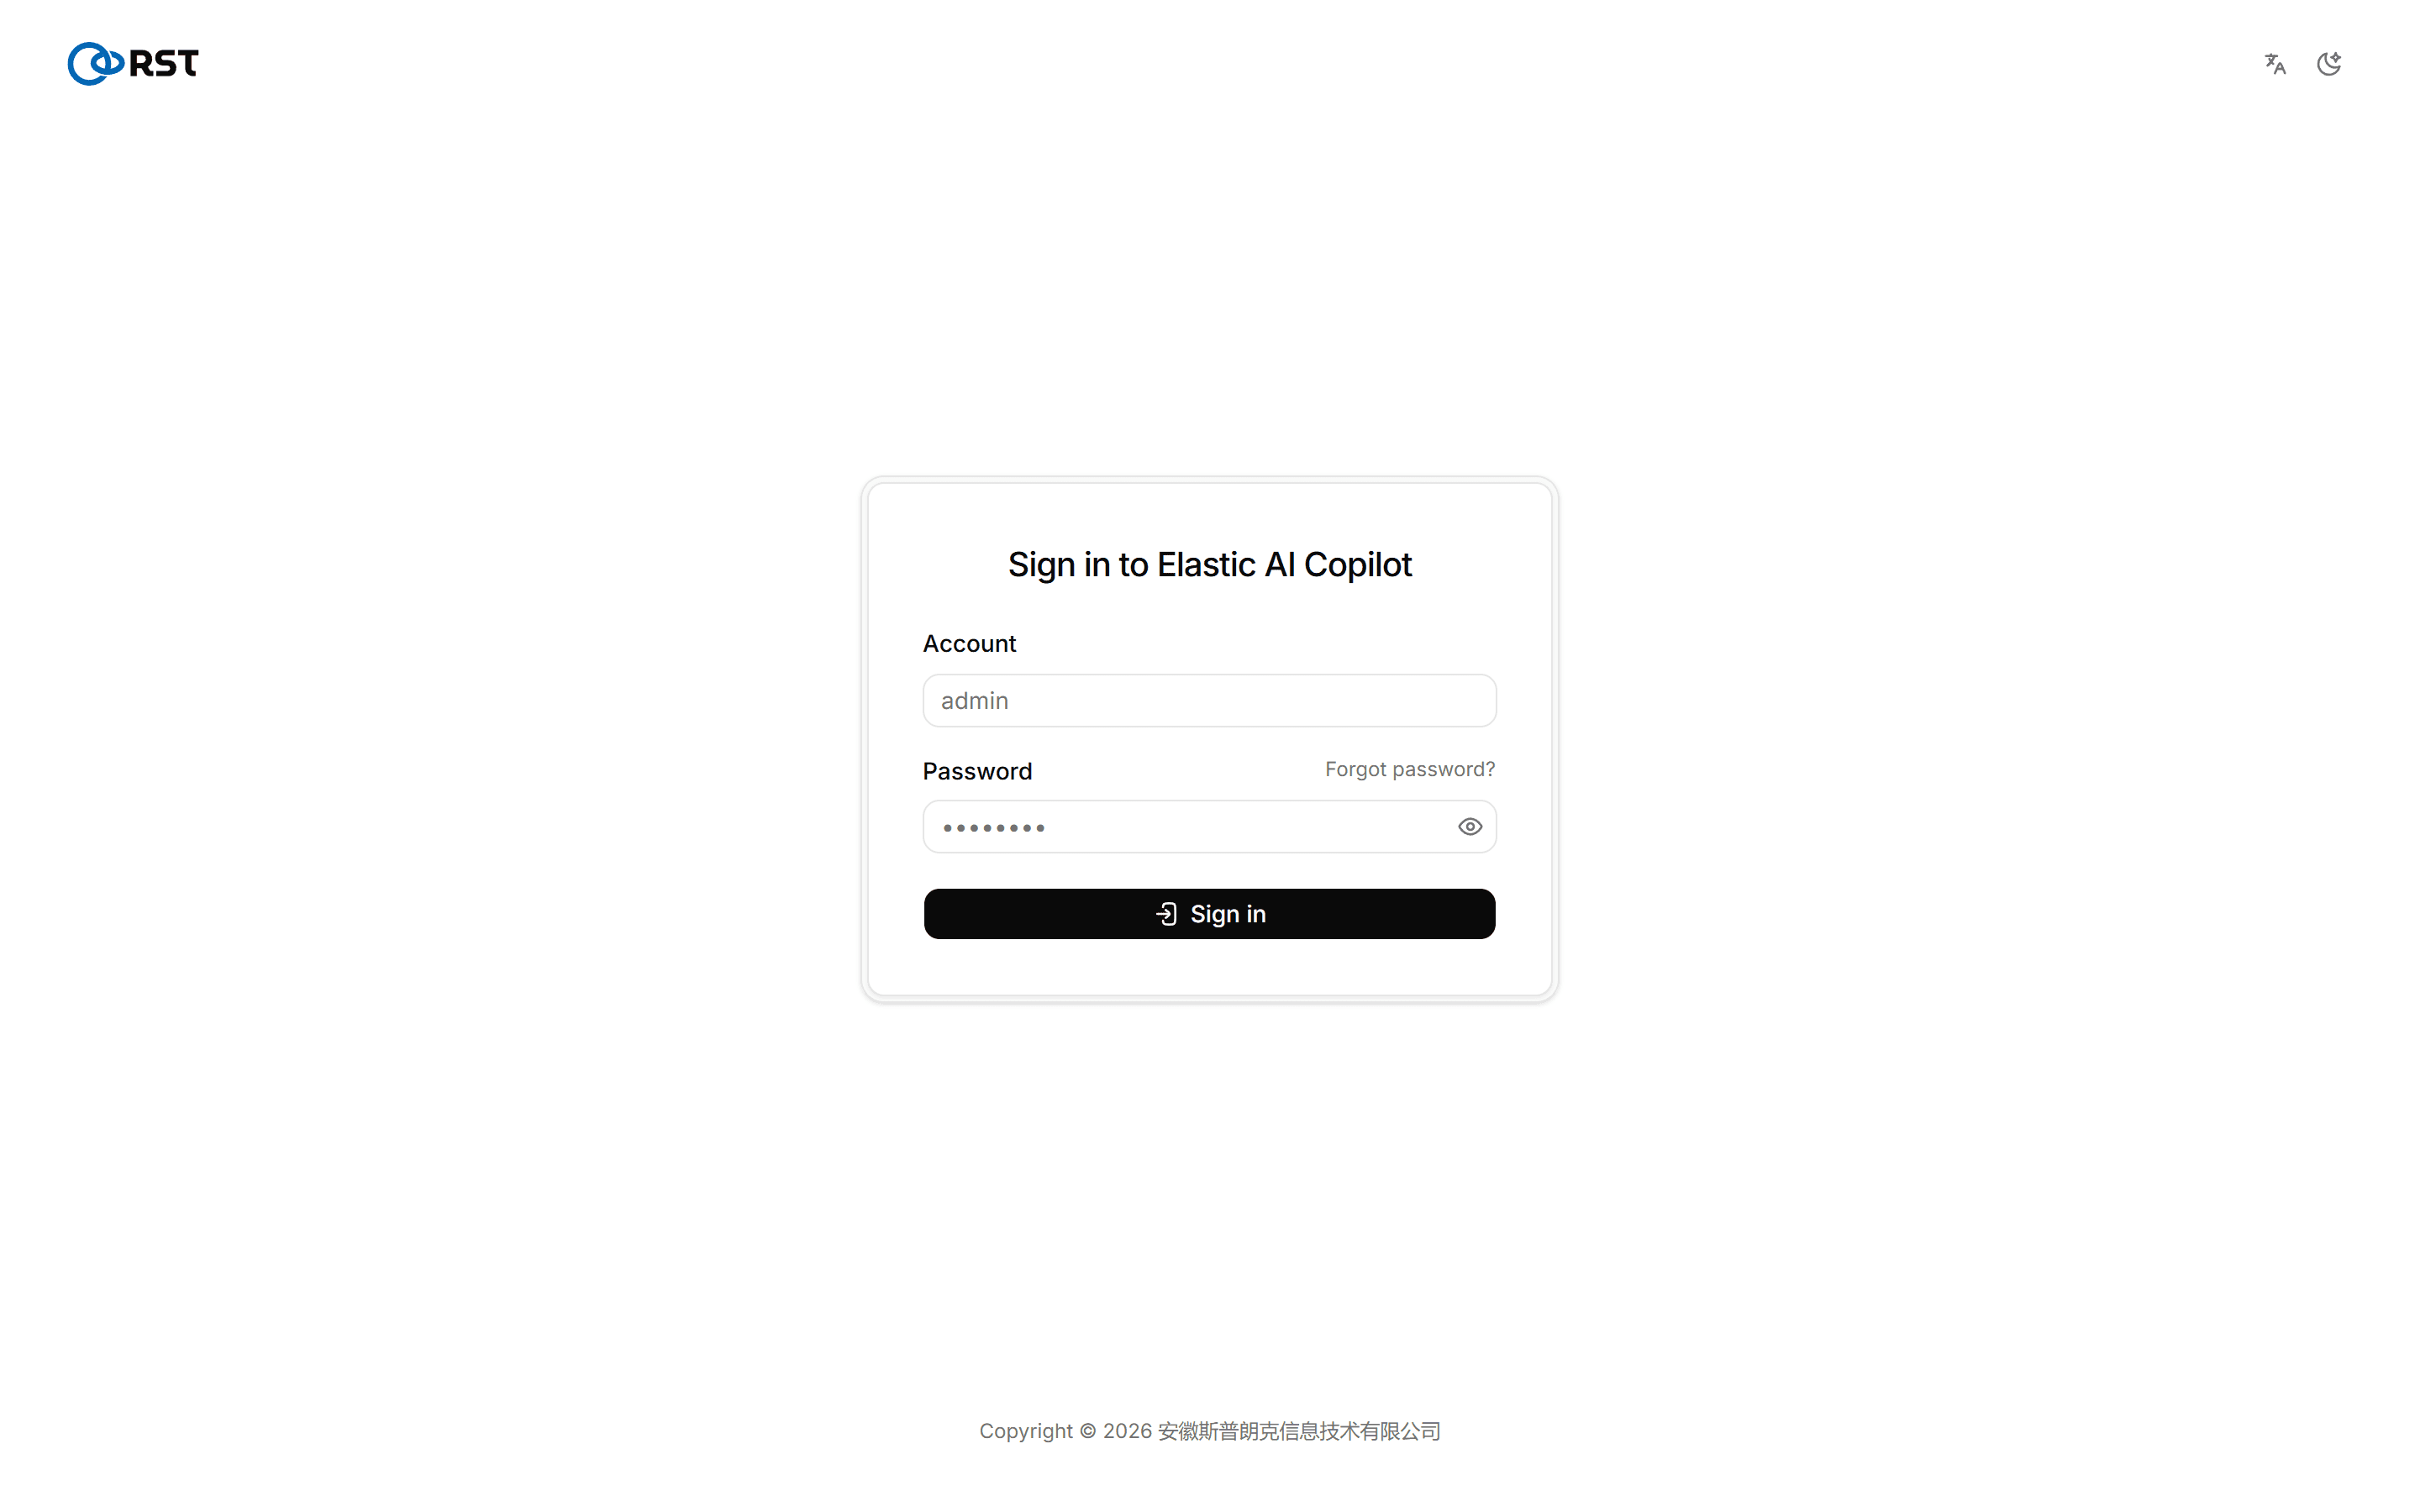
Signing in
https://<hostname>/v2/. The first account is the admin set during deploy.sh; there is no self-registration, people are added on the Users page.
Pages
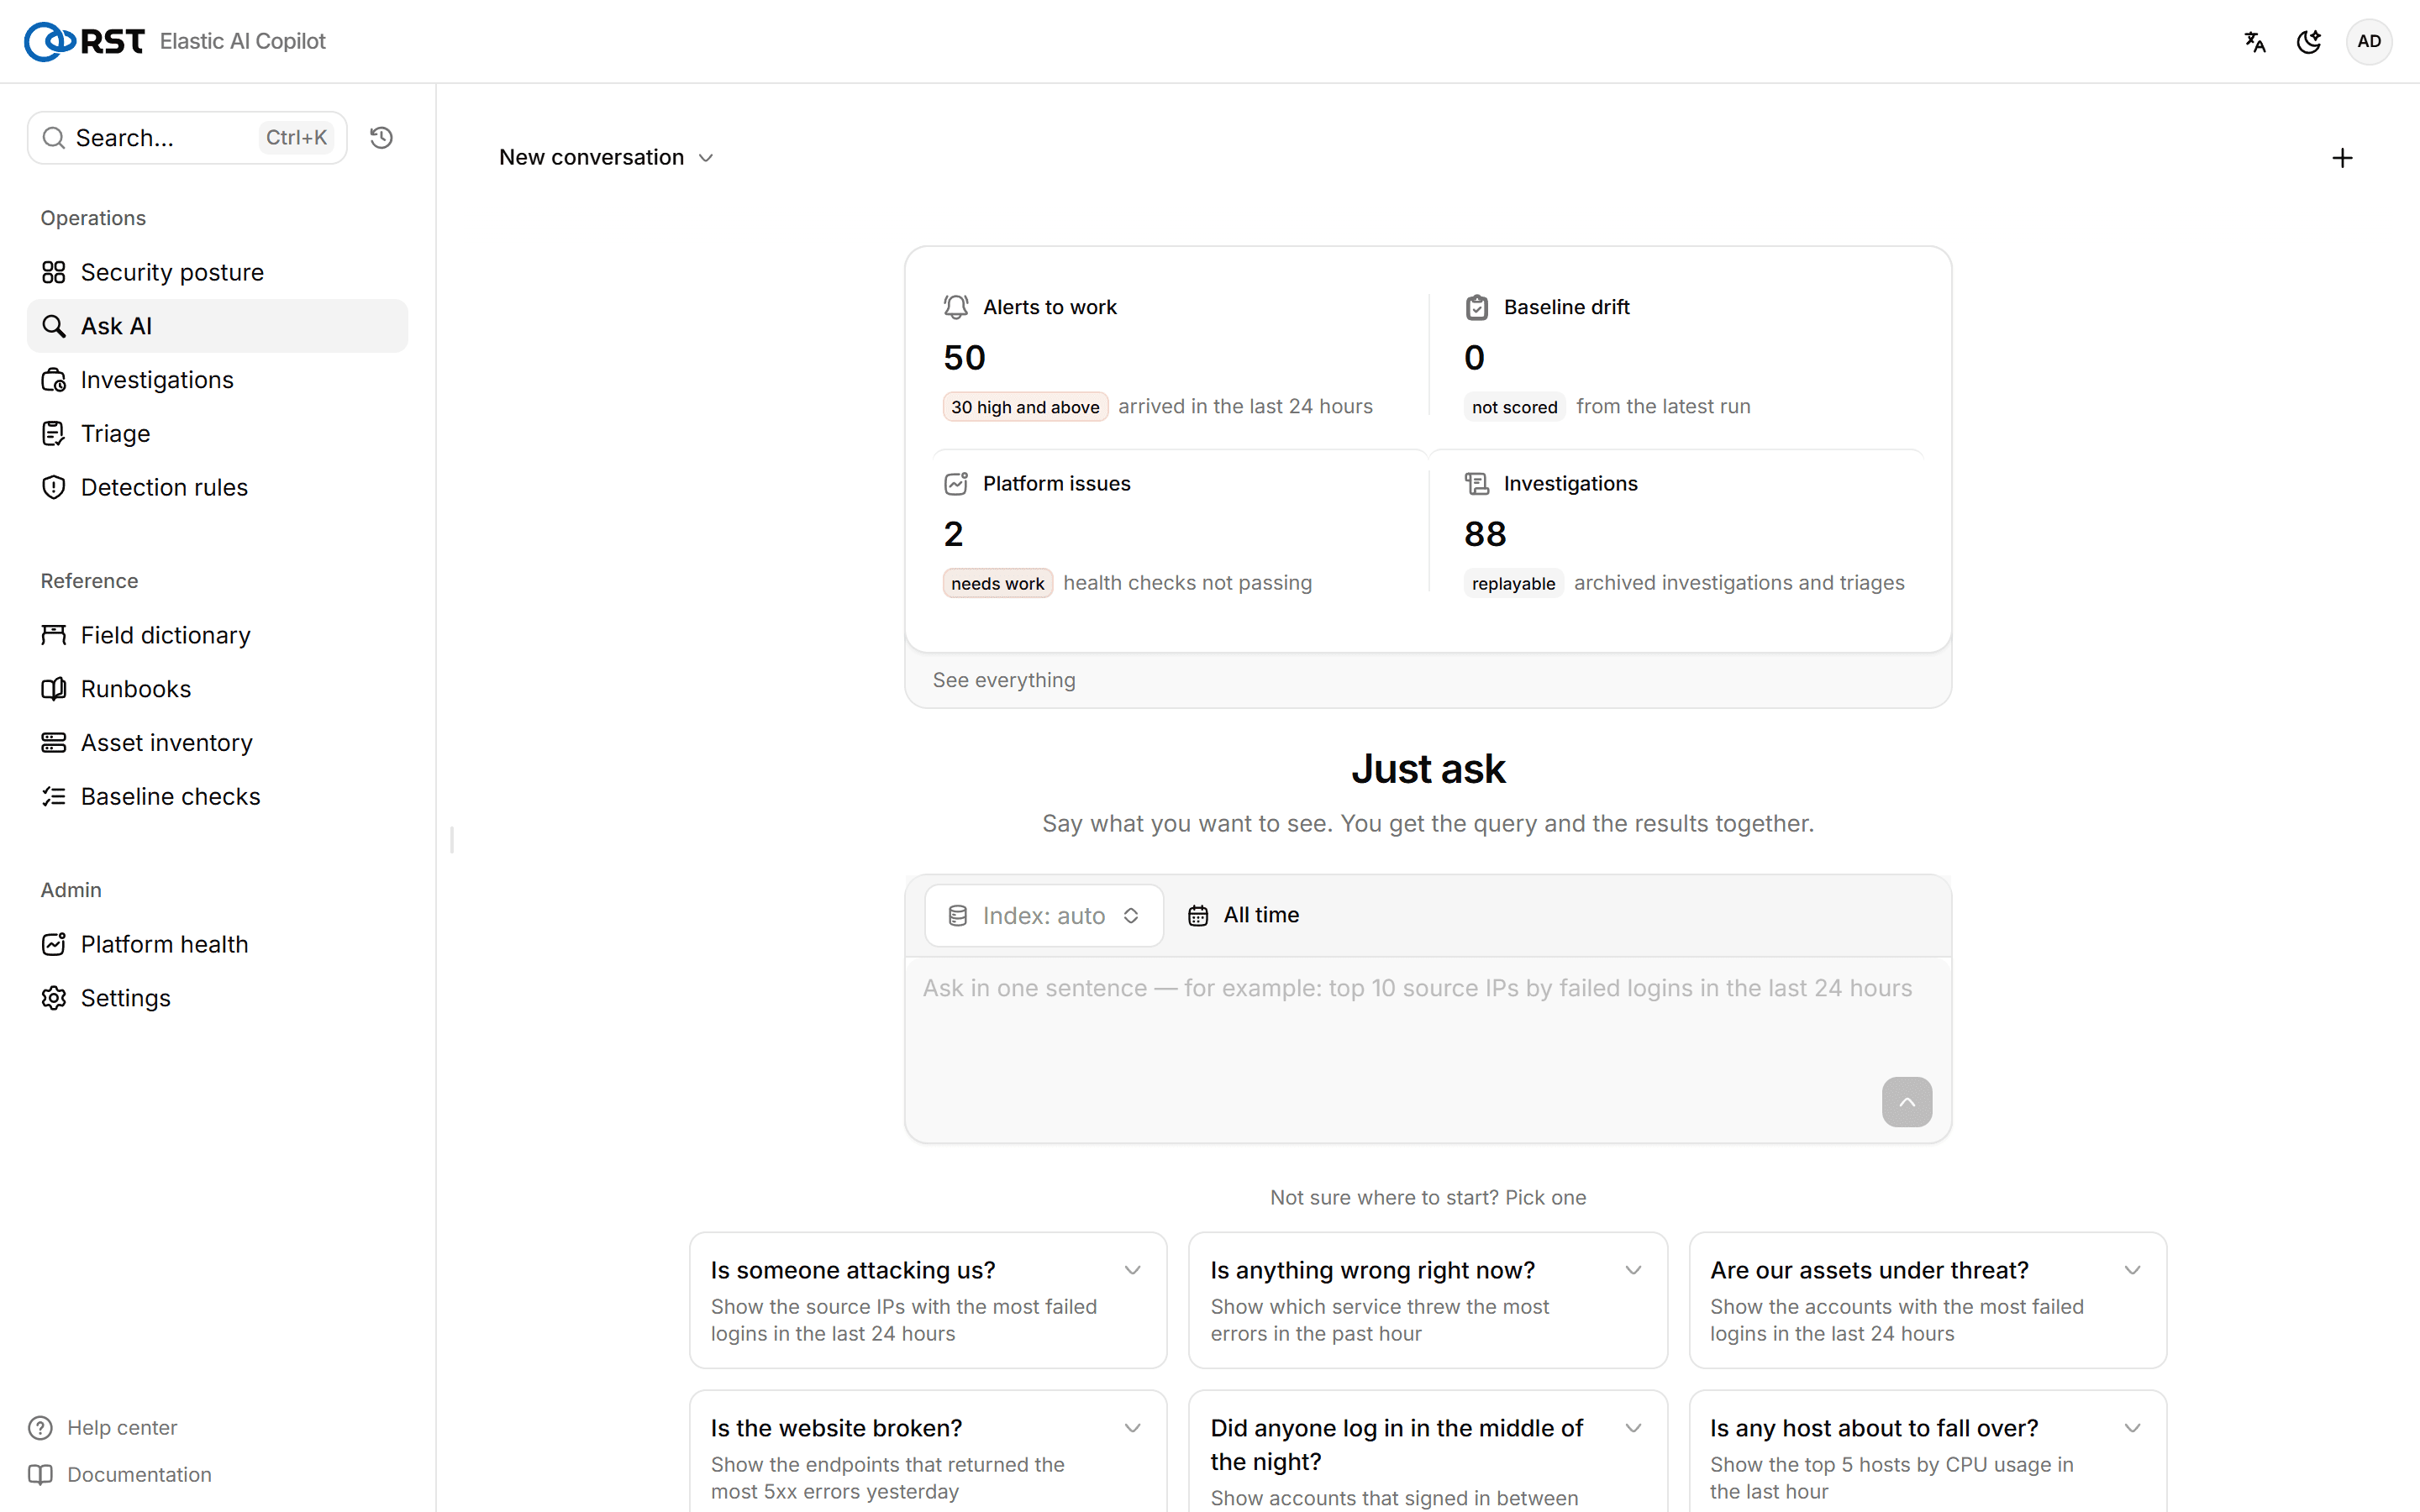
The left navigation has three groups. Posture, Settings and Platform health each carry top tabs that hold another seven pages.
| Group | Page | Purpose |
|---|---|---|
| Security operations | Posture | Alert volume, critical + high, baseline failures, platform issues; tabs: Live alerts, Reports |
| Smart query | Query logs in plain language, follow up in turns | |
| Analysis records | Archive of investigations, triage runs and result explanations | |
| Batch triage | Cluster, score and rank a batch of alerts (paid) | |
| Detection rules | Generate a Kibana detection rule from one sentence (paid) | |
| Reference data | Field dictionary | Which fields an index has and what their values look like |
| Runbooks | SOP knowledge base the AI cites | |
| Asset ledger | Business asset and owner behind a host / account / IP | |
| Baseline | CIS / MLPS 2.0 compliance verdicts over osquery results | |
| Administration | Platform health | Check-up of the Elastic cluster + AI read (the read is paid); tabs: Audit, Notifications |
| Settings | ES connection, index whitelist, masking, online update; tabs: Users, AI models, Activation |
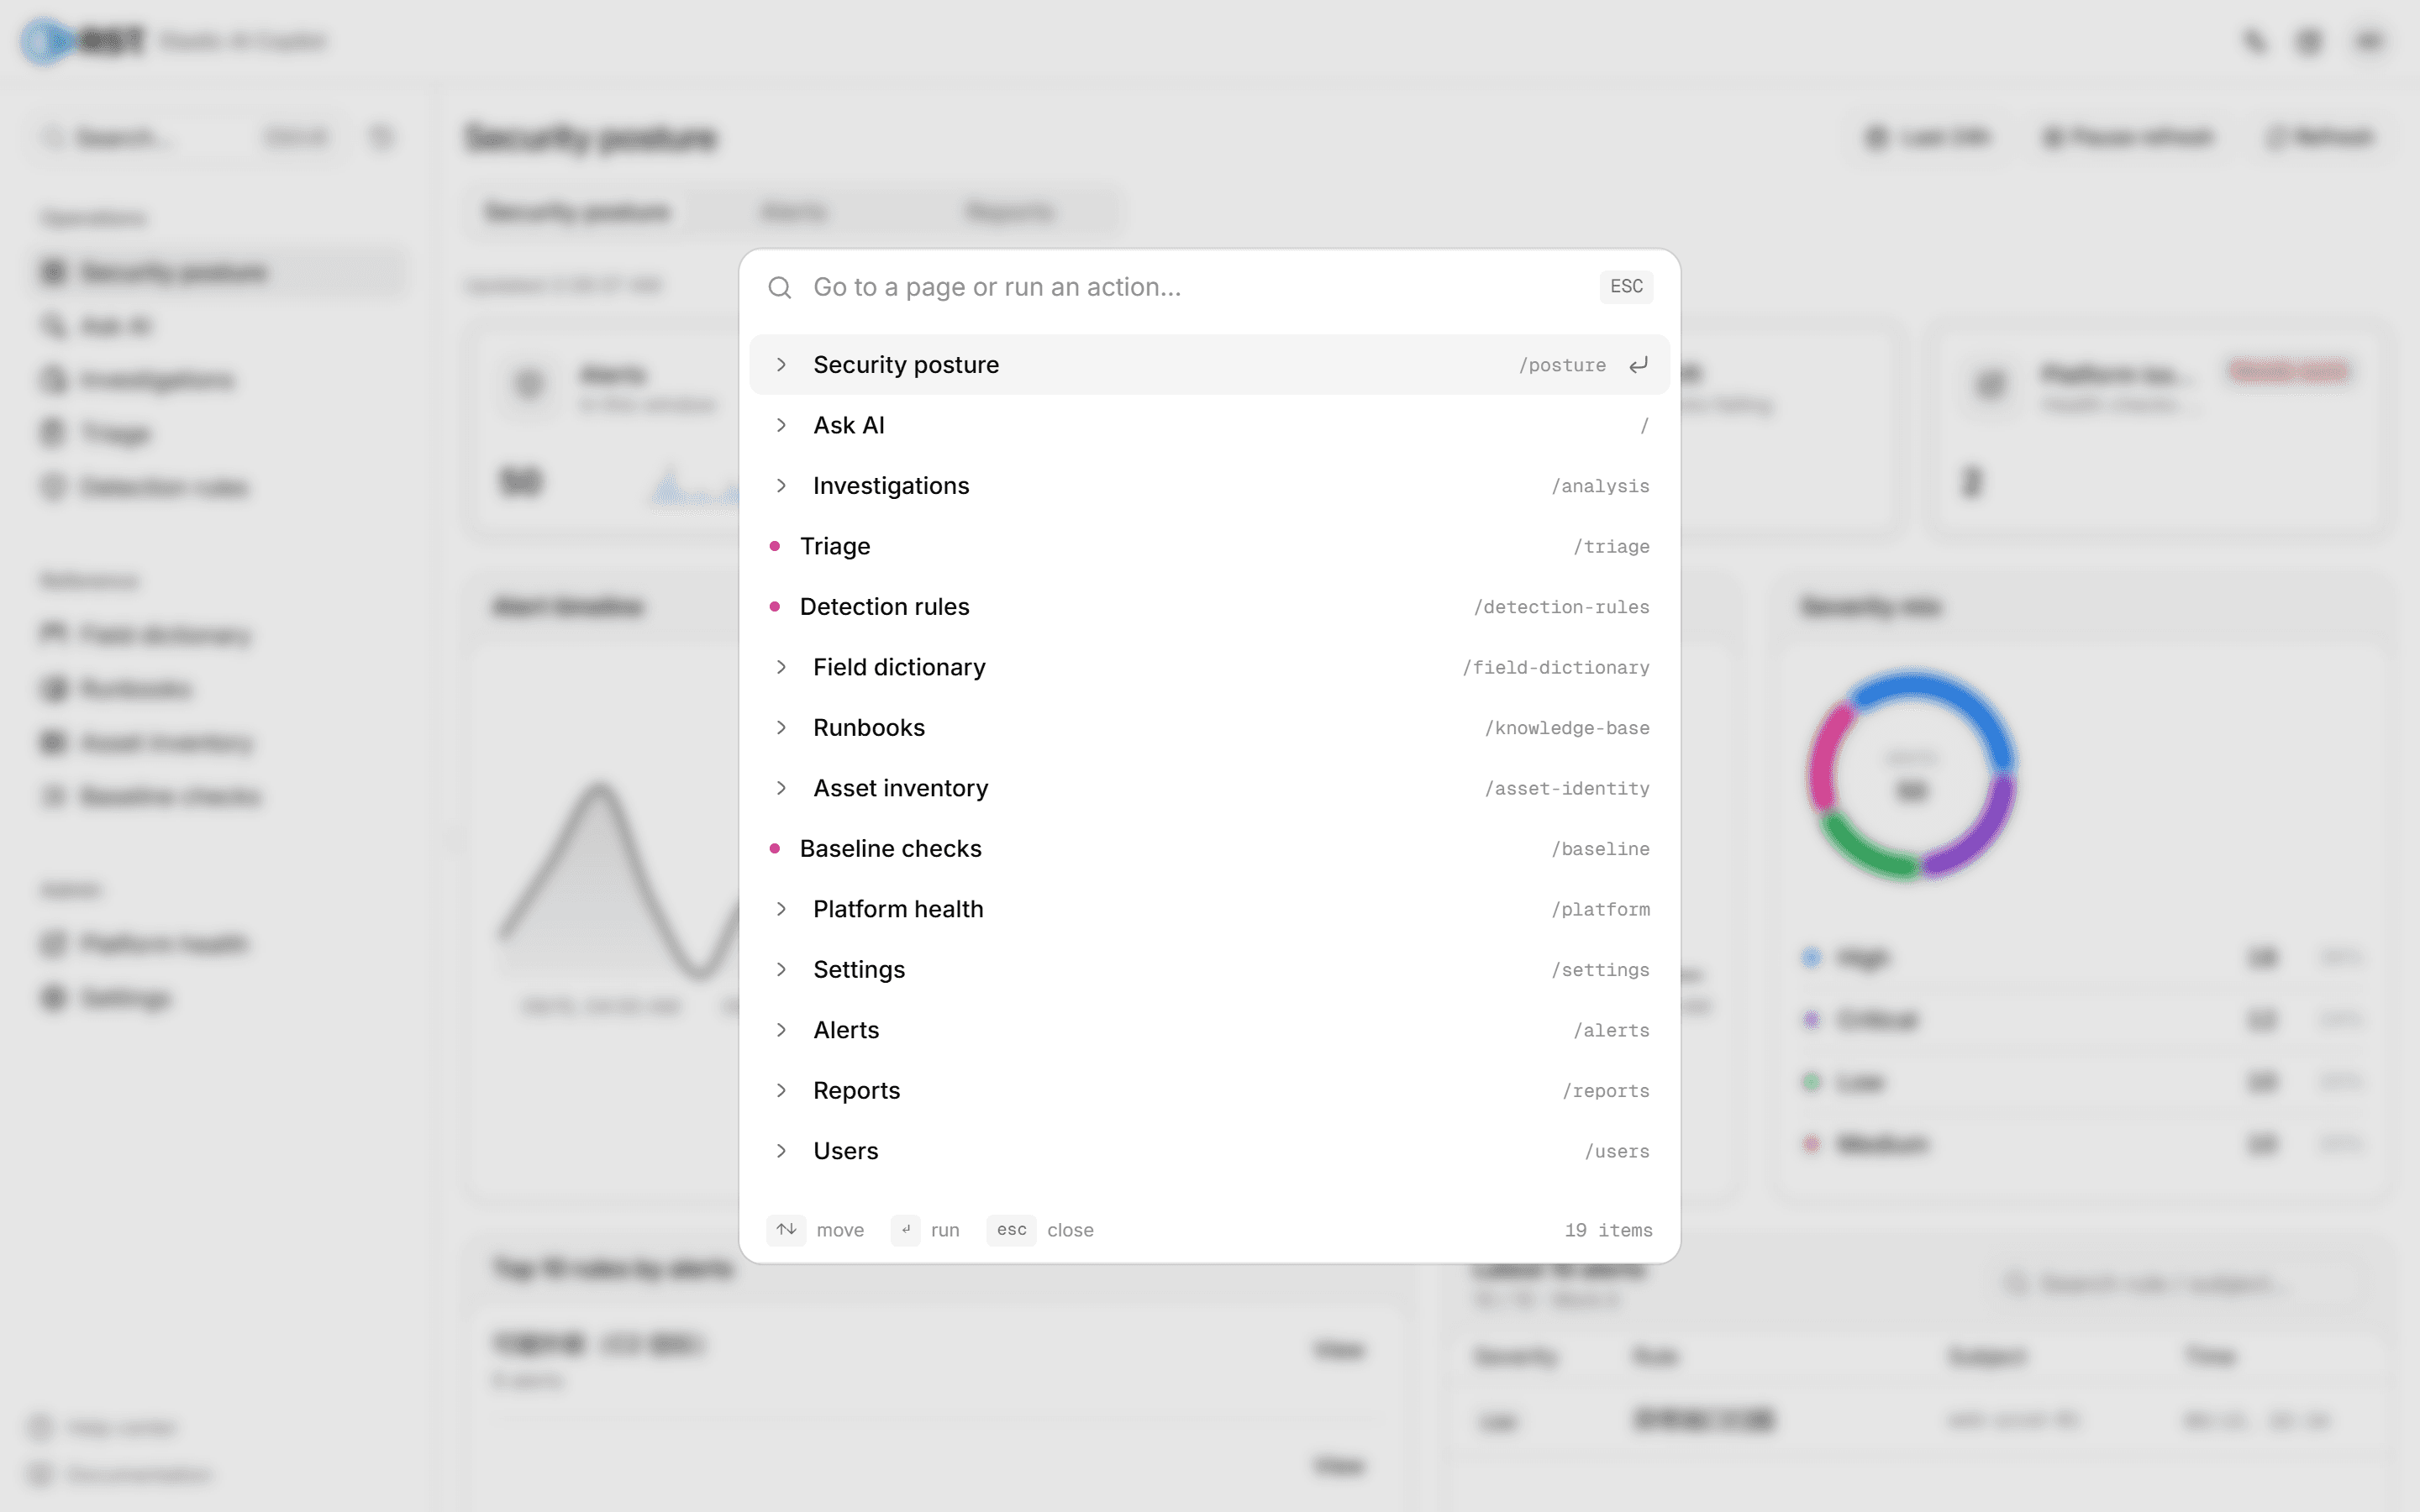
Command palette
Ctrl+K (⌘K on macOS) or the search box top-left: type a page name to jump; recent queries are listed too.
Account and roles
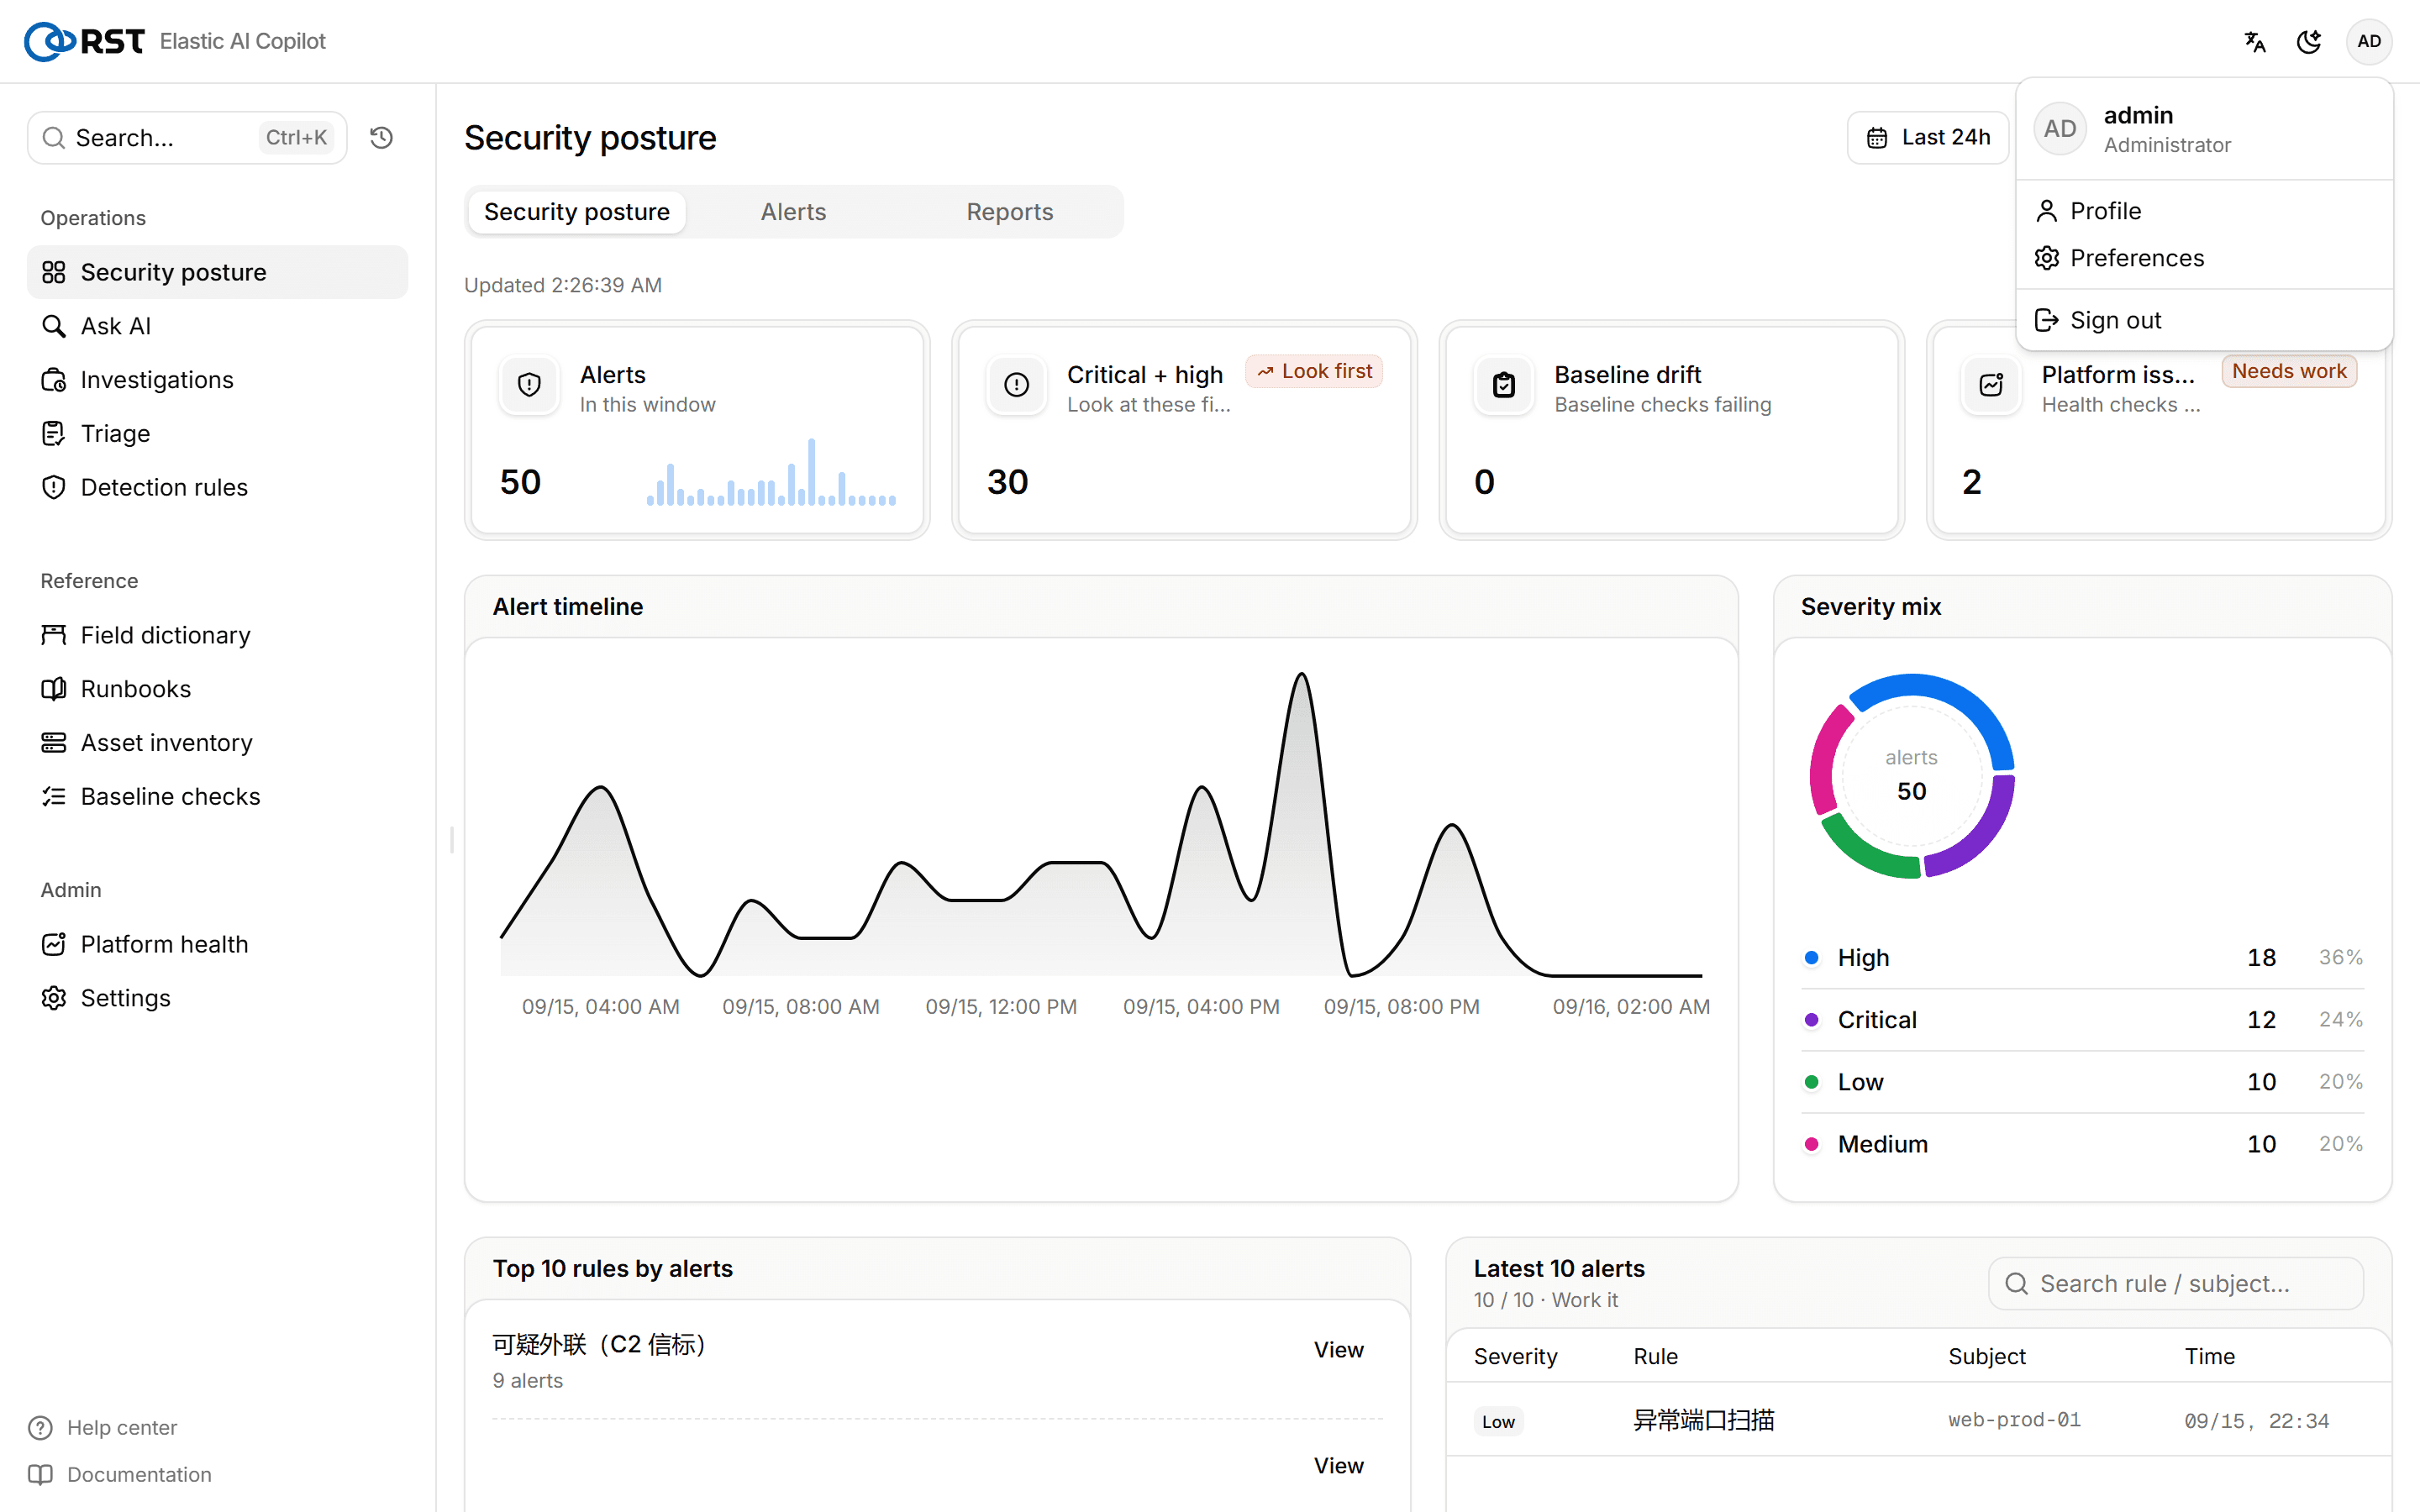
The avatar top-right: current account and role, profile, preferences (language, theme, default index), sign out. Language and theme are stored with the account and follow it to another browser.
| Role | Permissions |
|---|---|
| Administrator | Change configuration, manage accounts, activate the licence |
| Analyst | Query, investigate, triage, disposition alerts; cannot change gateway configuration |
| Read-only | Query, search, read explanations; changes nothing |
Quota before activation
Without an activated licence every free capability works under a daily LLM-call quota (200 by default, RST_TRIAL_DAILY_LIMIT). A meter at the bottom of the navigation shows what is left today and when it resets. Activation lifts the limit.
Two global banners
- "Not connected to Elasticsearch": the gateway has no ES address yet. Enter and test the cluster URL in Settings; until then queries, alerts and analyses have no data source.
- "Not synced": history / preferences / saved queries are only in this browser for now; they sync once the gateway is reachable again.
Upgrade, rollback and backup
Three ways to upgrade (re-run deploy.sh in place, online update, manual tag switch), health-gated rollback, the four things to back up, and the restore drill.
Smart query
Query logs in one sentence. The gateway turns it into Elasticsearch DSL, validates it read-only, dry-runs and executes it; when nothing matches it says why and offers a fix.