

Posture
First screen after login: alerts in the window, critical + high, baseline failures, platform issues; the ten noisiest rules and ten latest alerts.
Posture generates nothing; it gathers numbers from Live alerts, Baseline, Platform health and Analysis records, refreshing every 30 seconds (pausable). Every edition.
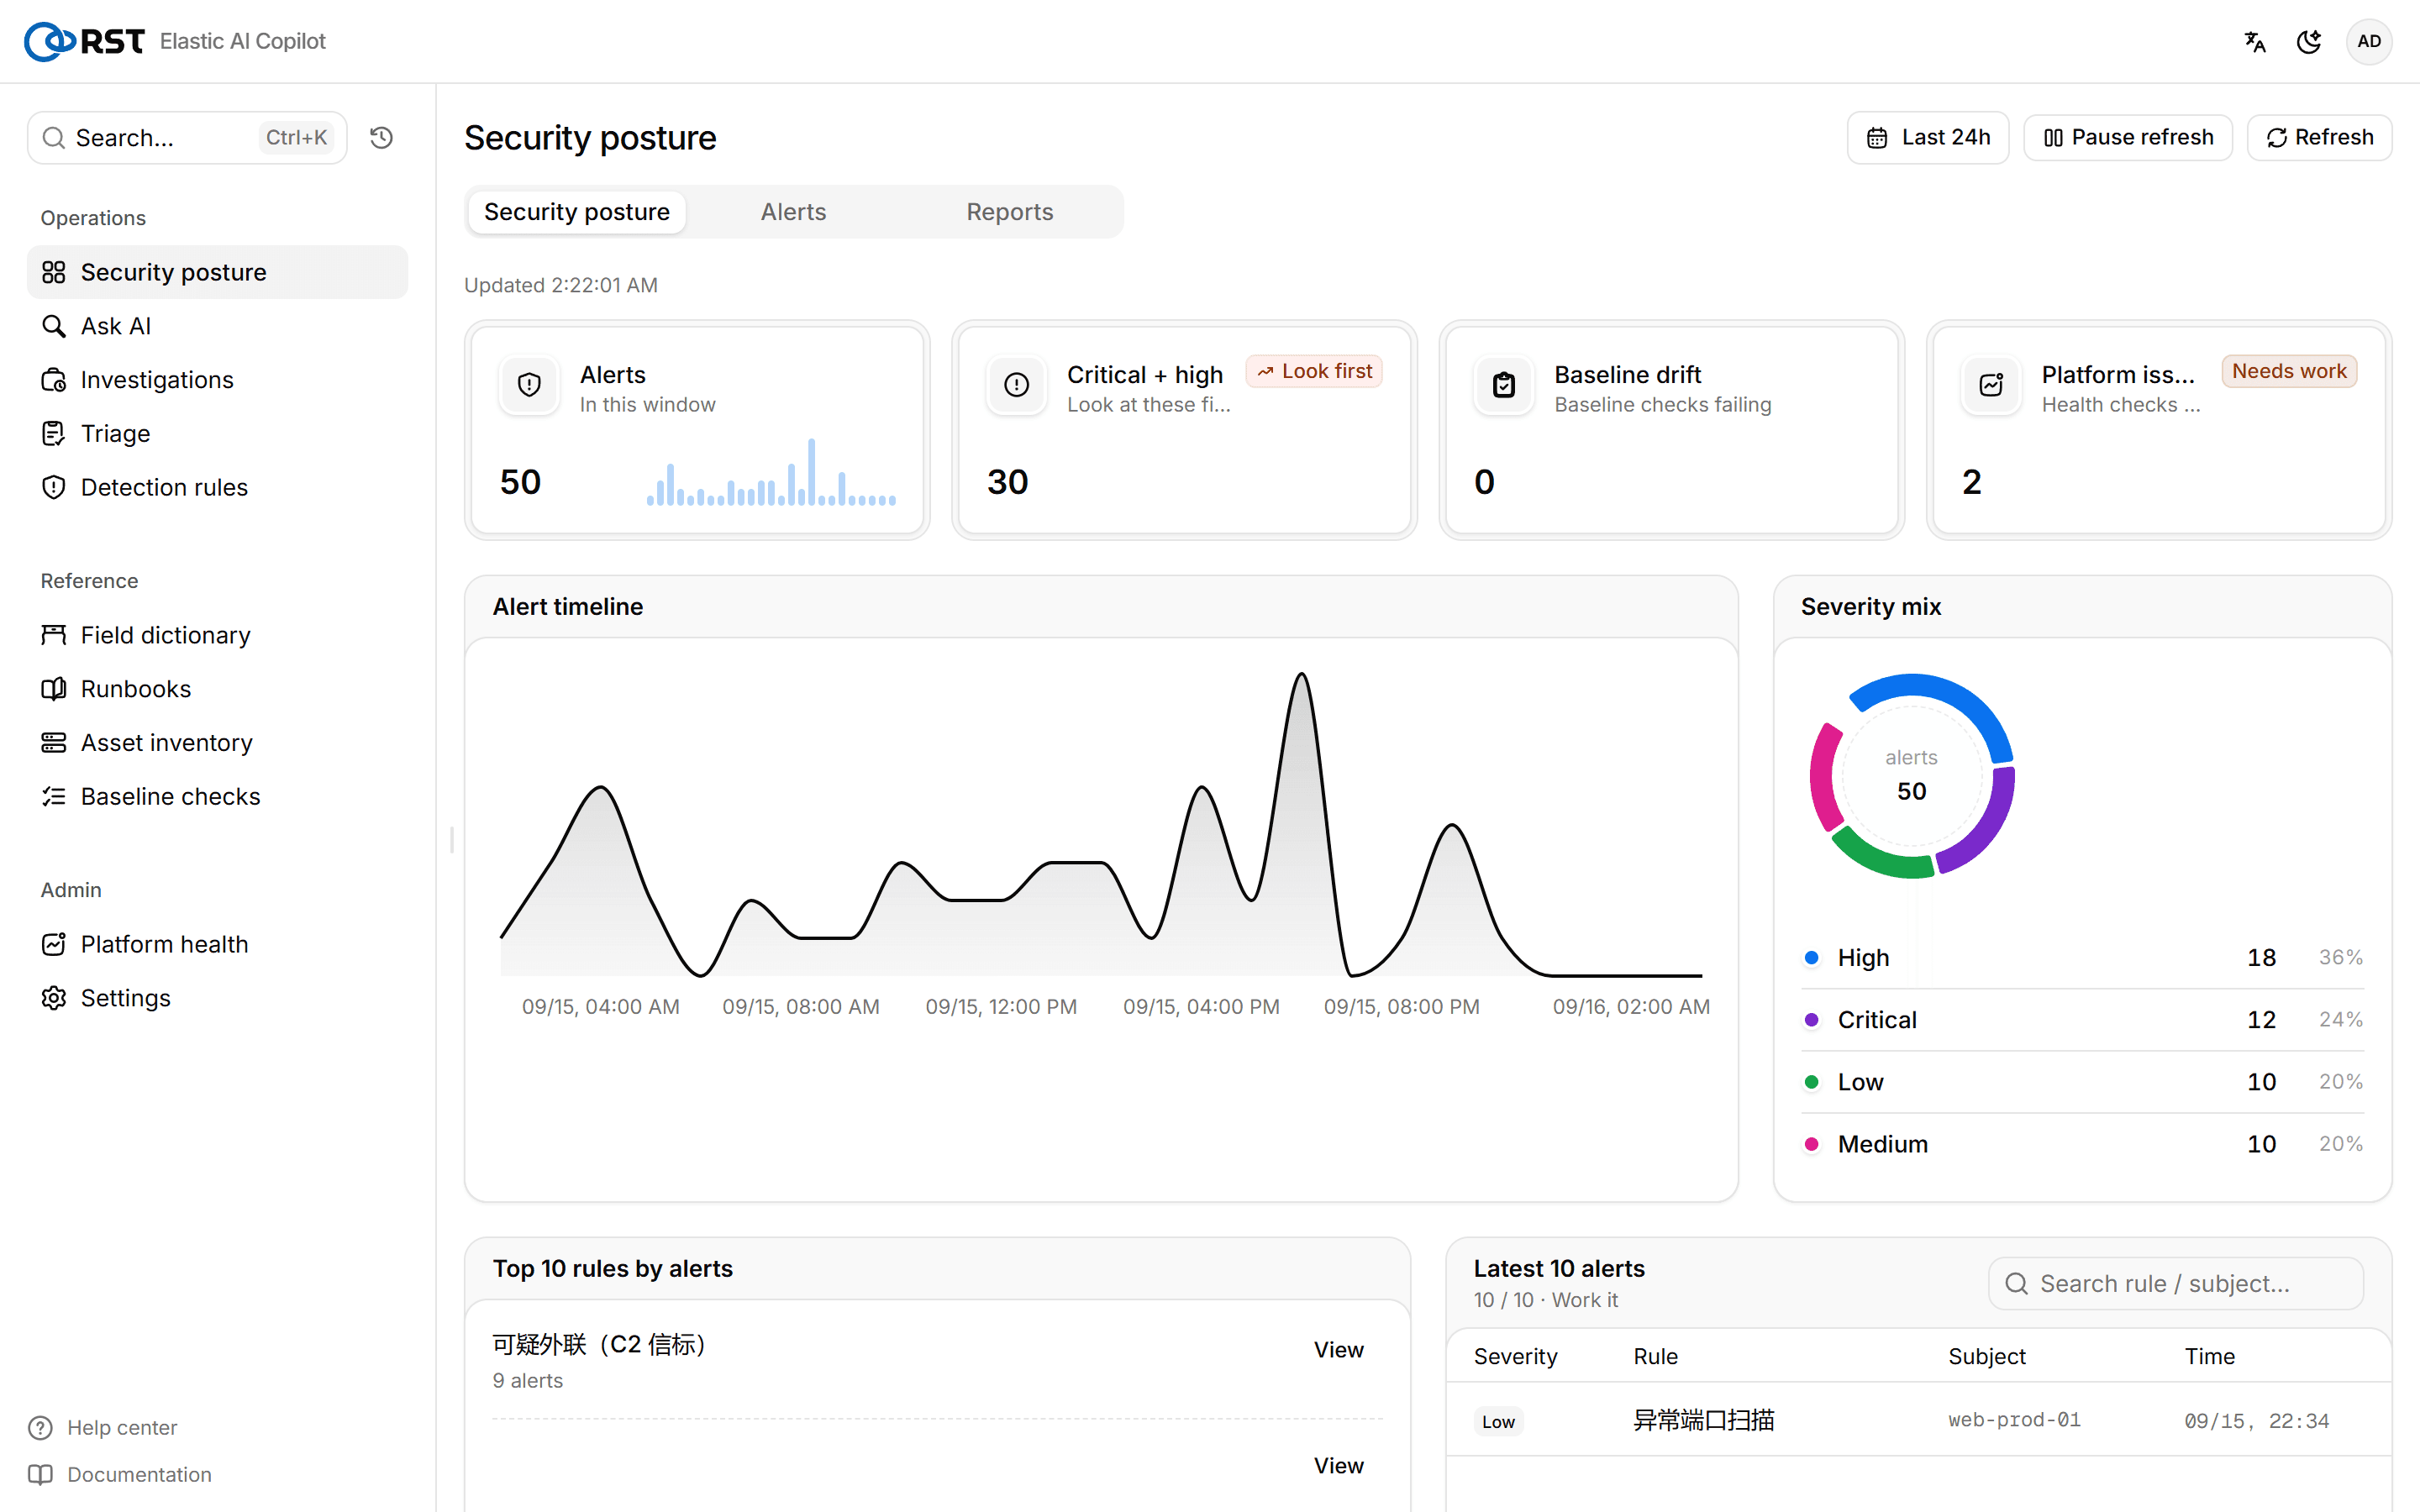
Key figures

| Card | Source | Click goes to |
|---|---|---|
| Alerts | Alerts ingested in the window | Live alerts |
| Critical + high | Same, critical and high only; badge "look first" when > 0 | Live alerts, filtered |
| Baseline failures | Failed checks in the latest run; "never run" before the first | Baseline |
| Platform issues | Non-passing checks in the latest check-up | Platform health |
The window is the time picker top right, 24 hours by default.
Timeline and severity mix
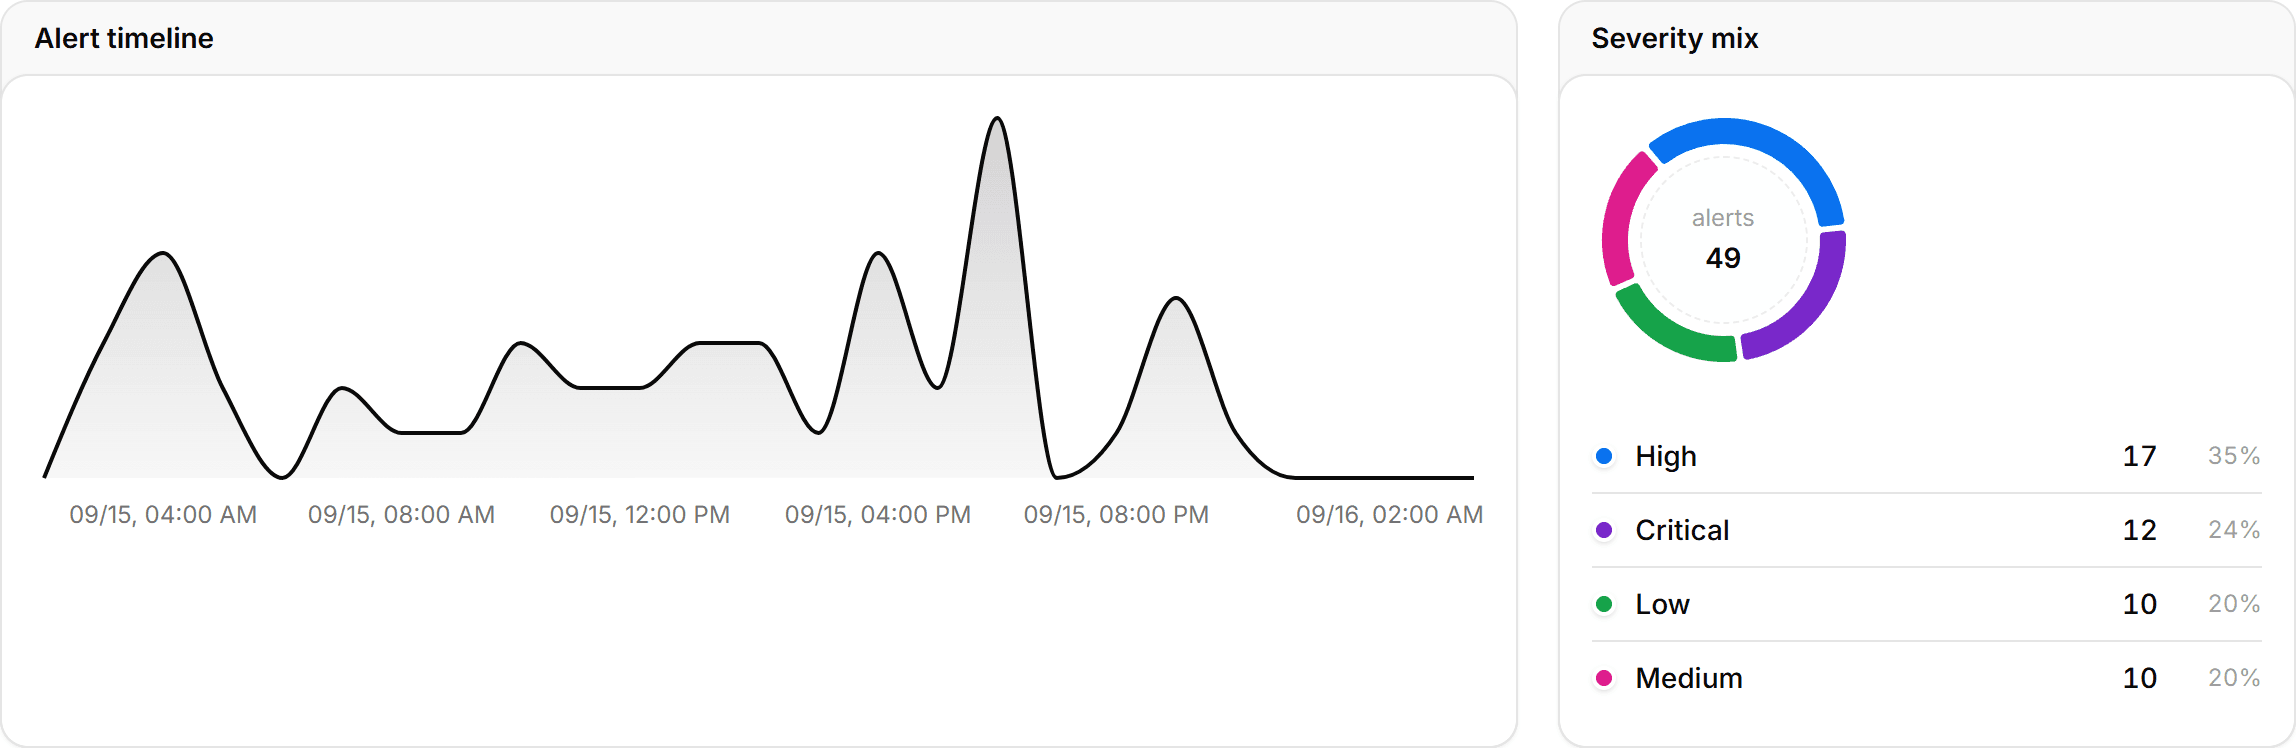
Stacked per hour (per day for wide windows) by severity; next to it the severity share of the window.
Noisiest rules / latest alerts
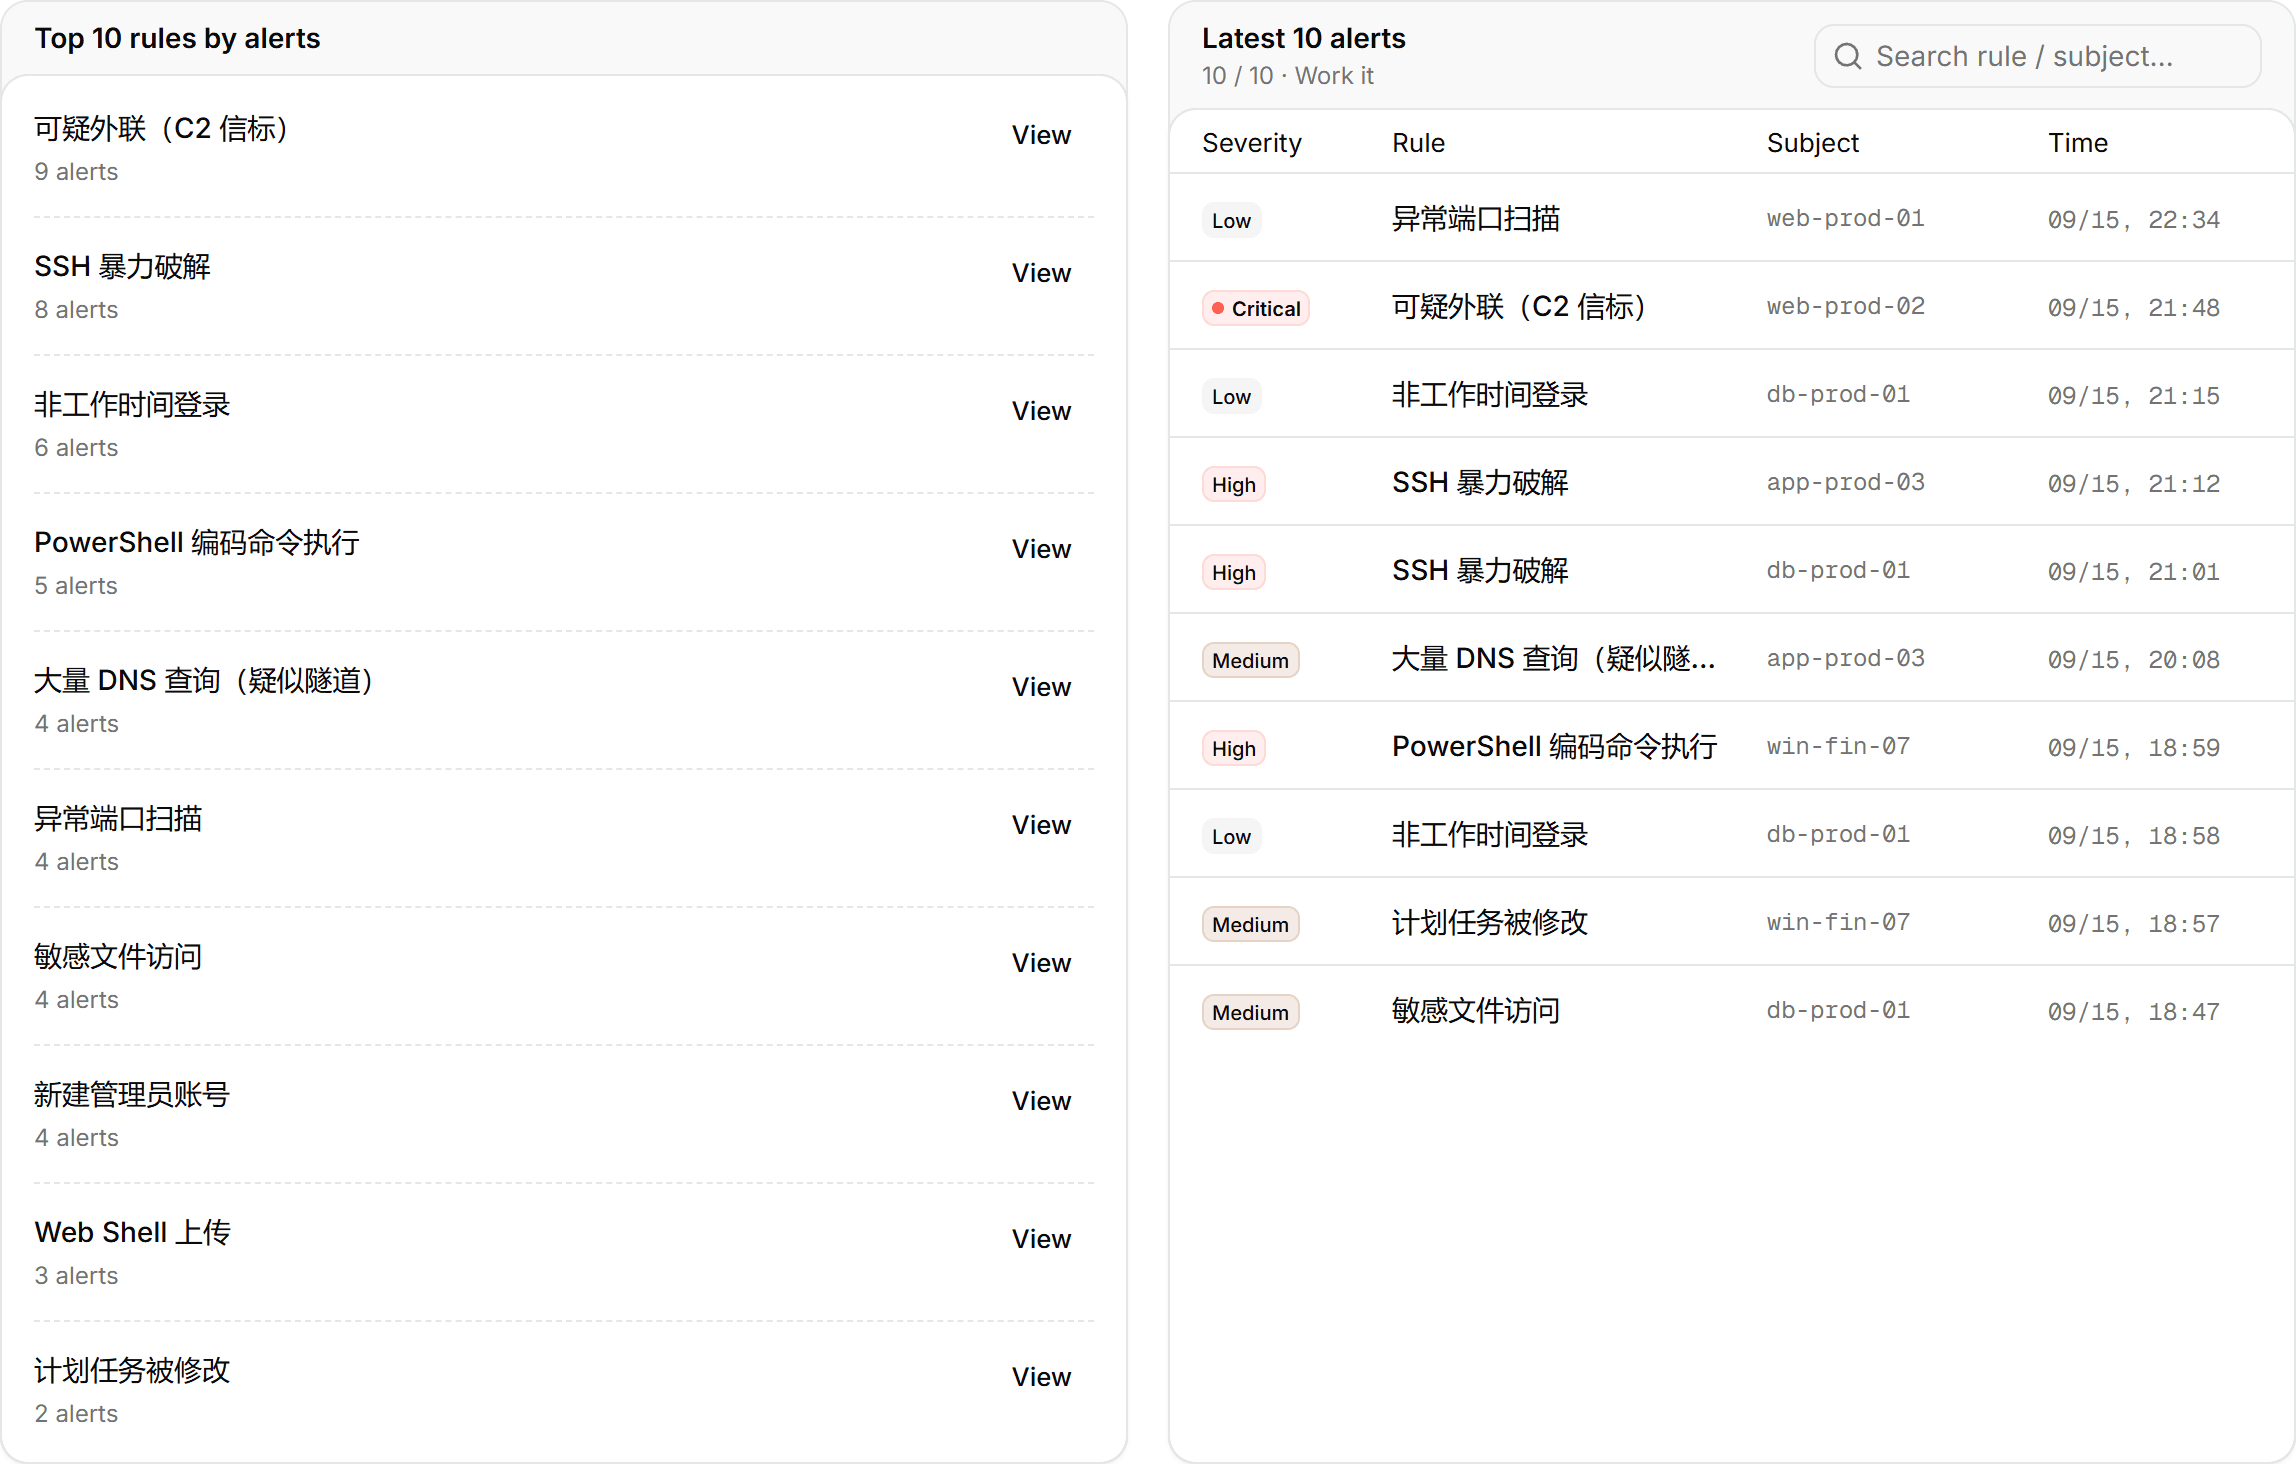
- Noisiest rules top 10: "View" jumps to Live alerts filtered on that rule. One noisy rule is often most of the queue; start here.
- Latest alerts top 10: severity / rule / subject / time, with a search box; "Handle" opens the feed.
Archive
The bottom line shows how many investigations and triages are archived, linking to Analysis records.
The four small cards on the Smart query home (open alerts, baseline failures, platform issues, records) are a compact version of this page.
Baseline
CIS / MLPS 2.0 compliance verdicts as rules over osquery results. No model involved; reproducible and usable air-gapped.
Live alerts
Ingest Elastic Security detection alerts (polling or webhook), each with an automatic summary; group, filter and disposition them in the feed; investigate a single alert.