
Platform health
QRadar deployment check-up: Console connection and version, managed hosts, EPS license usage, log-source status, ingest freshness, offense backlog, auto-discovered log sources. The AI read groups failing checks by cause and orders the fixes. Professional and above.
Platform health checks the QRadar deployment itself: whether logs keep arriving, whether the license is large enough, whether offenses are piling up. The check-up only reads QRadar APIs. Both the check-up and the AI read belong to the platform-ops copilot and need a Professional or Enterprise license (trial included). Both follow your interface language.
Run the check-up
Steps
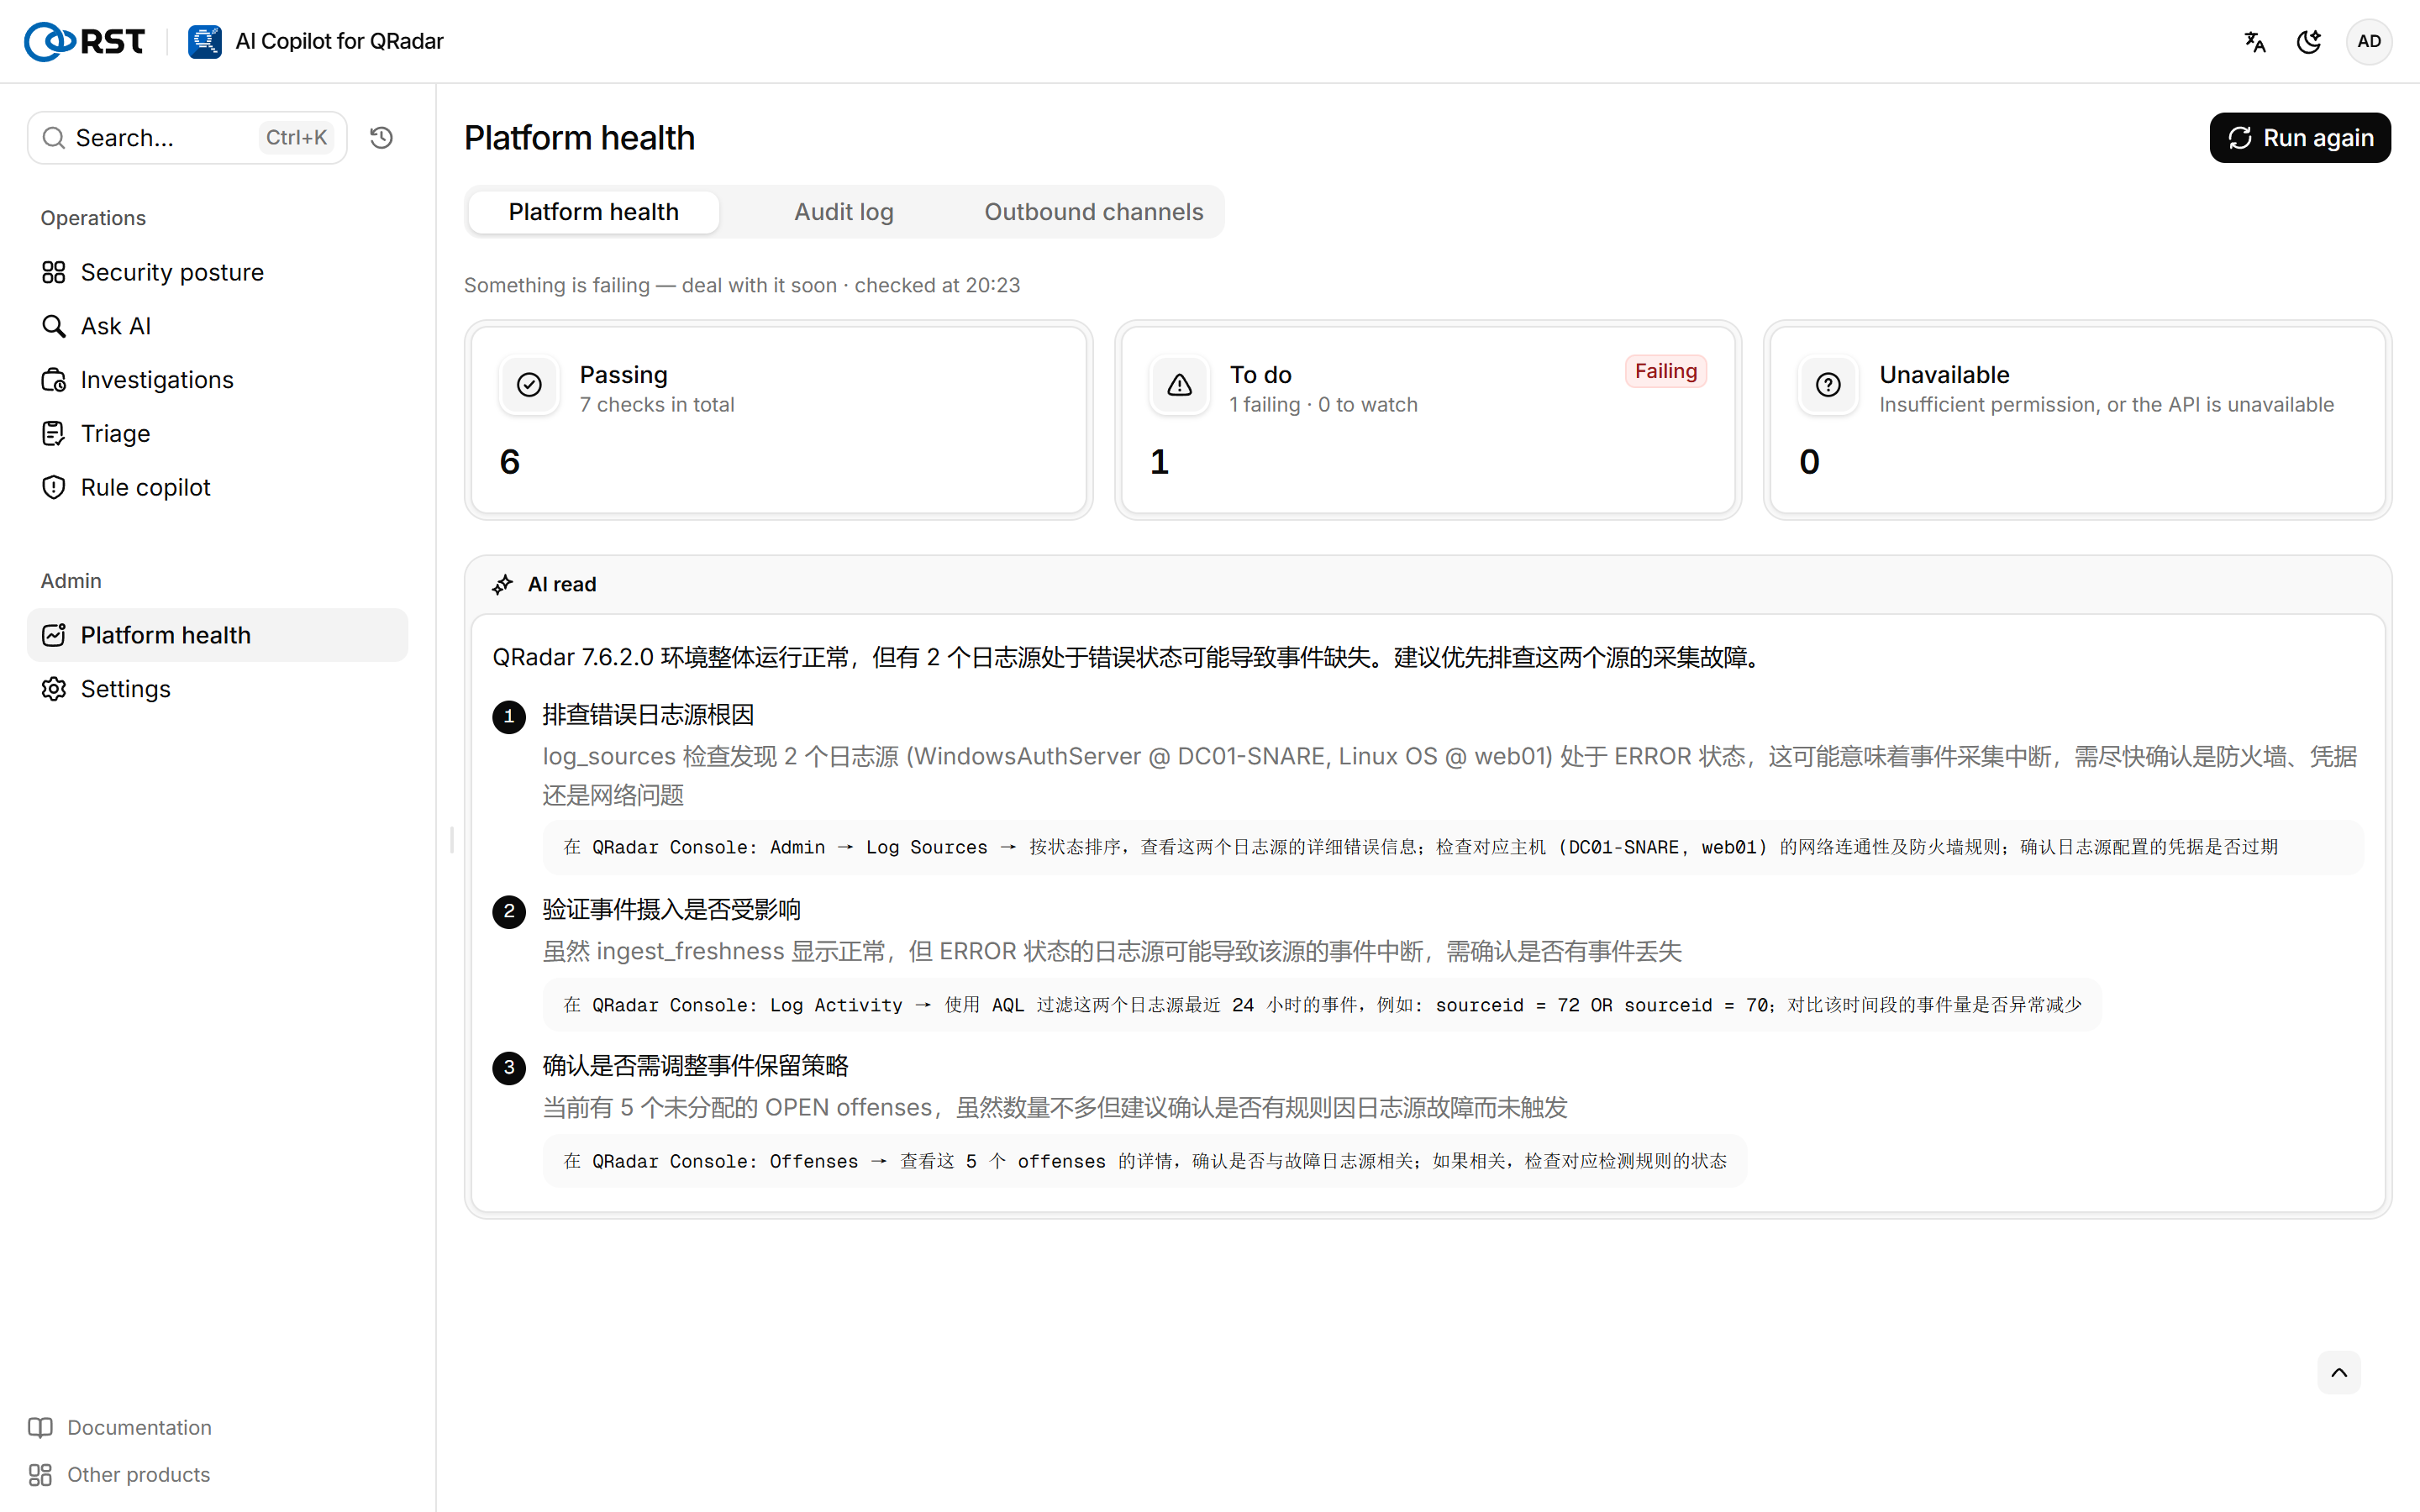
- Open Platform health; a check-up runs automatically.
- After fixing problems, select Run again.
Checkup overview gives a one-line verdict and three counts: Passing, To do (failing and to watch) and Unavailable (insufficient permission or the API is unavailable). Checks groups the checks into to do, passing and unavailable, with the verdict, result and suggested fix for each.
Unavailable is not an error. If the token's user role lacks read-only deployment administration rights, the managed-hosts and EPS checks cannot run; grant the rights and run the check-up again. See QRadar token permissions. When the Console is unreachable, every other check shows as unavailable.
Get the AI read
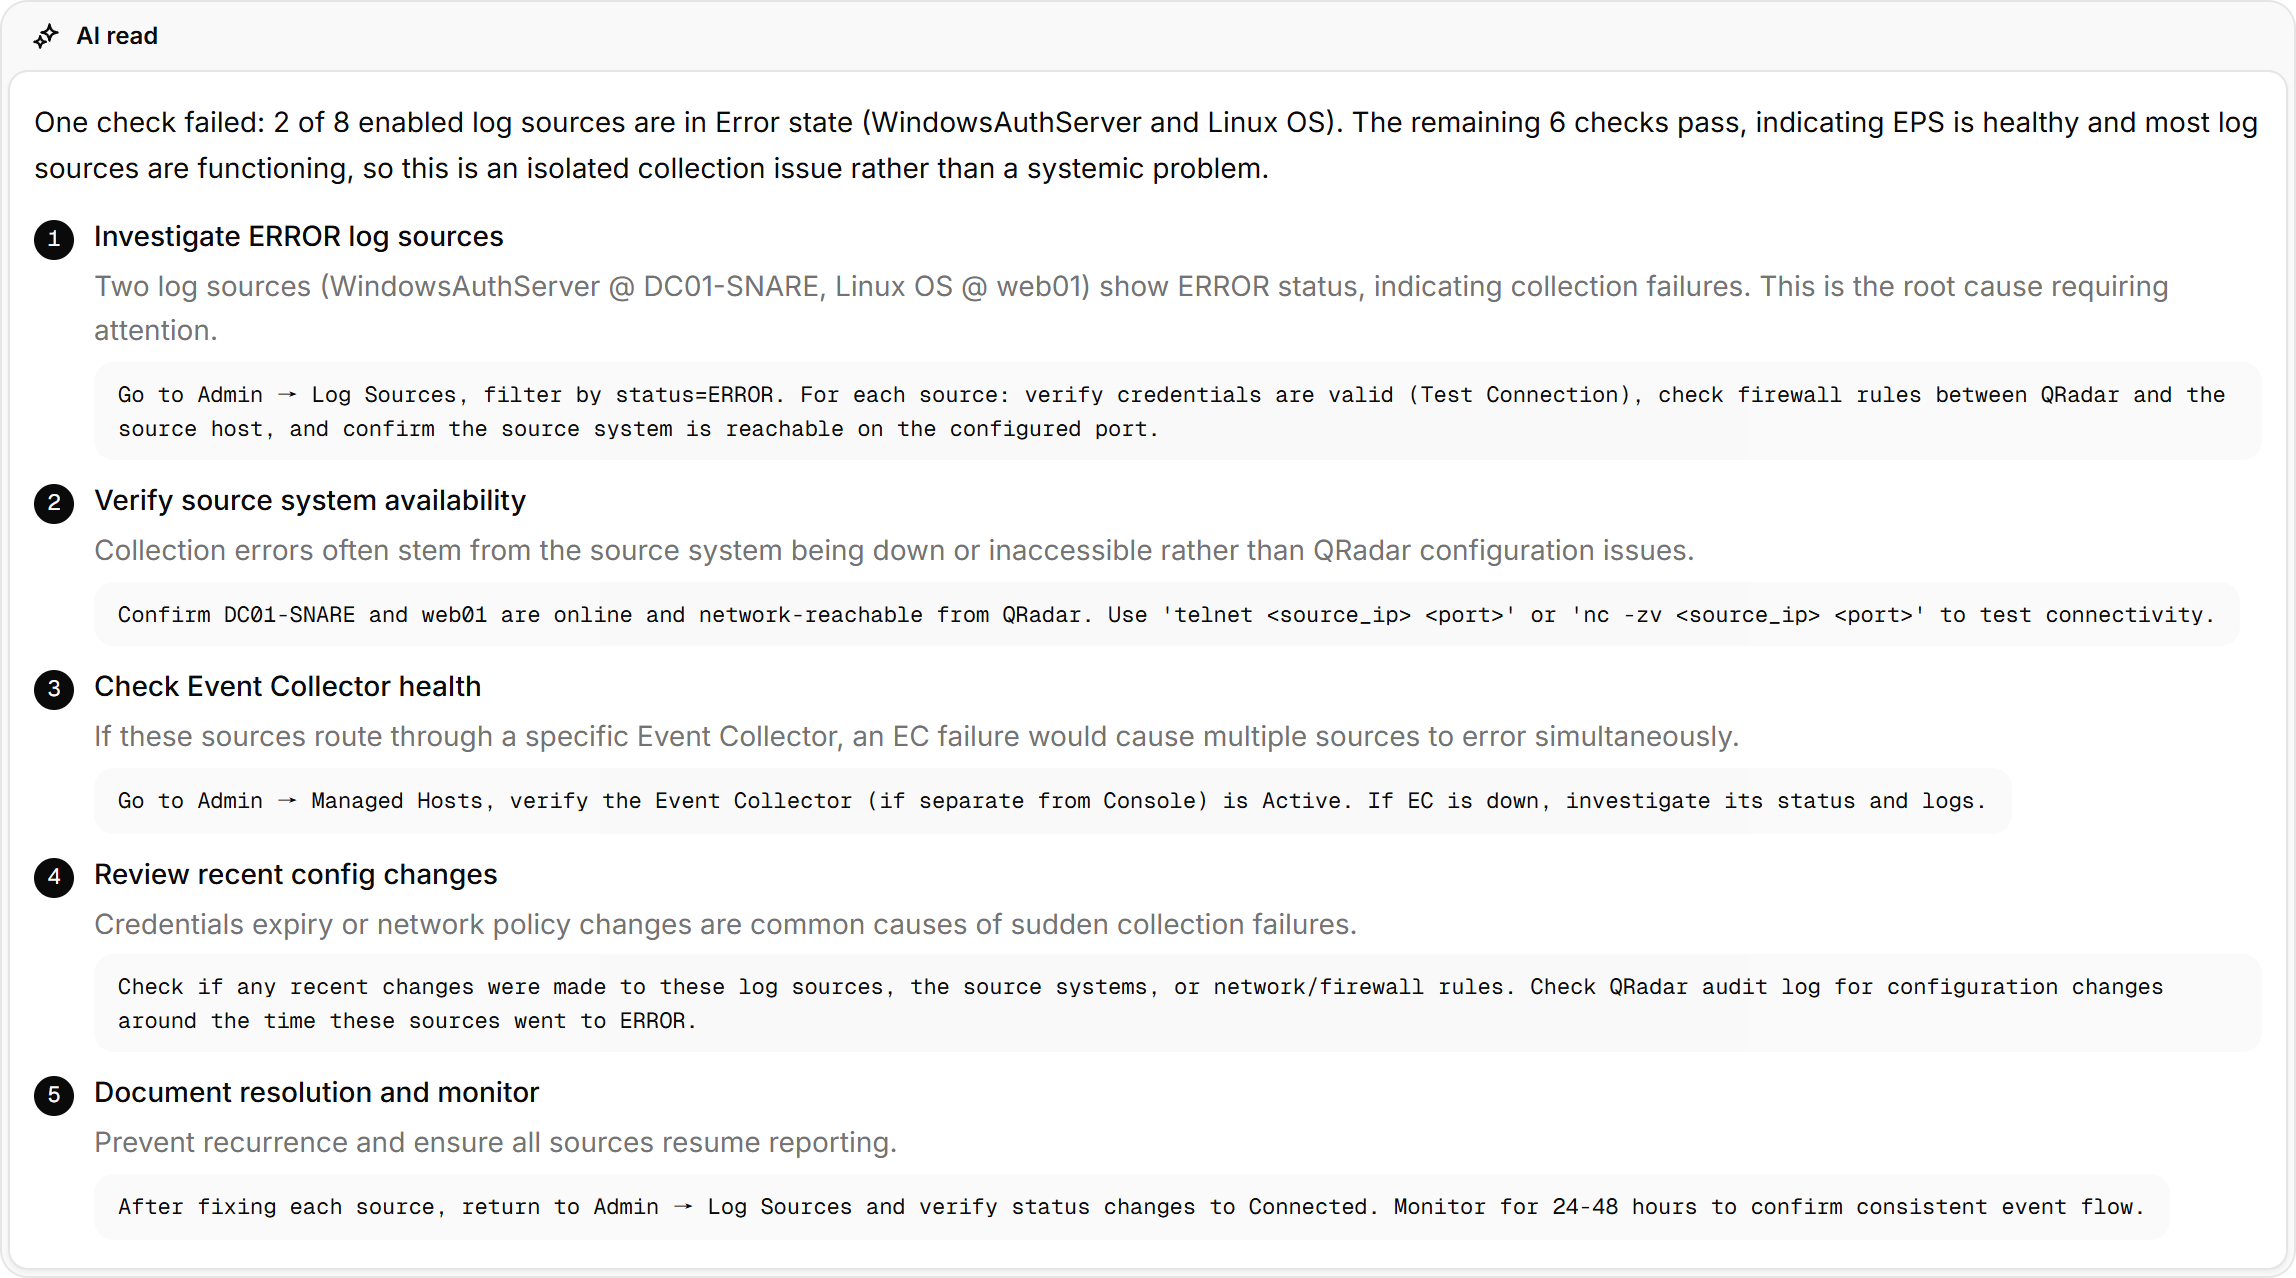
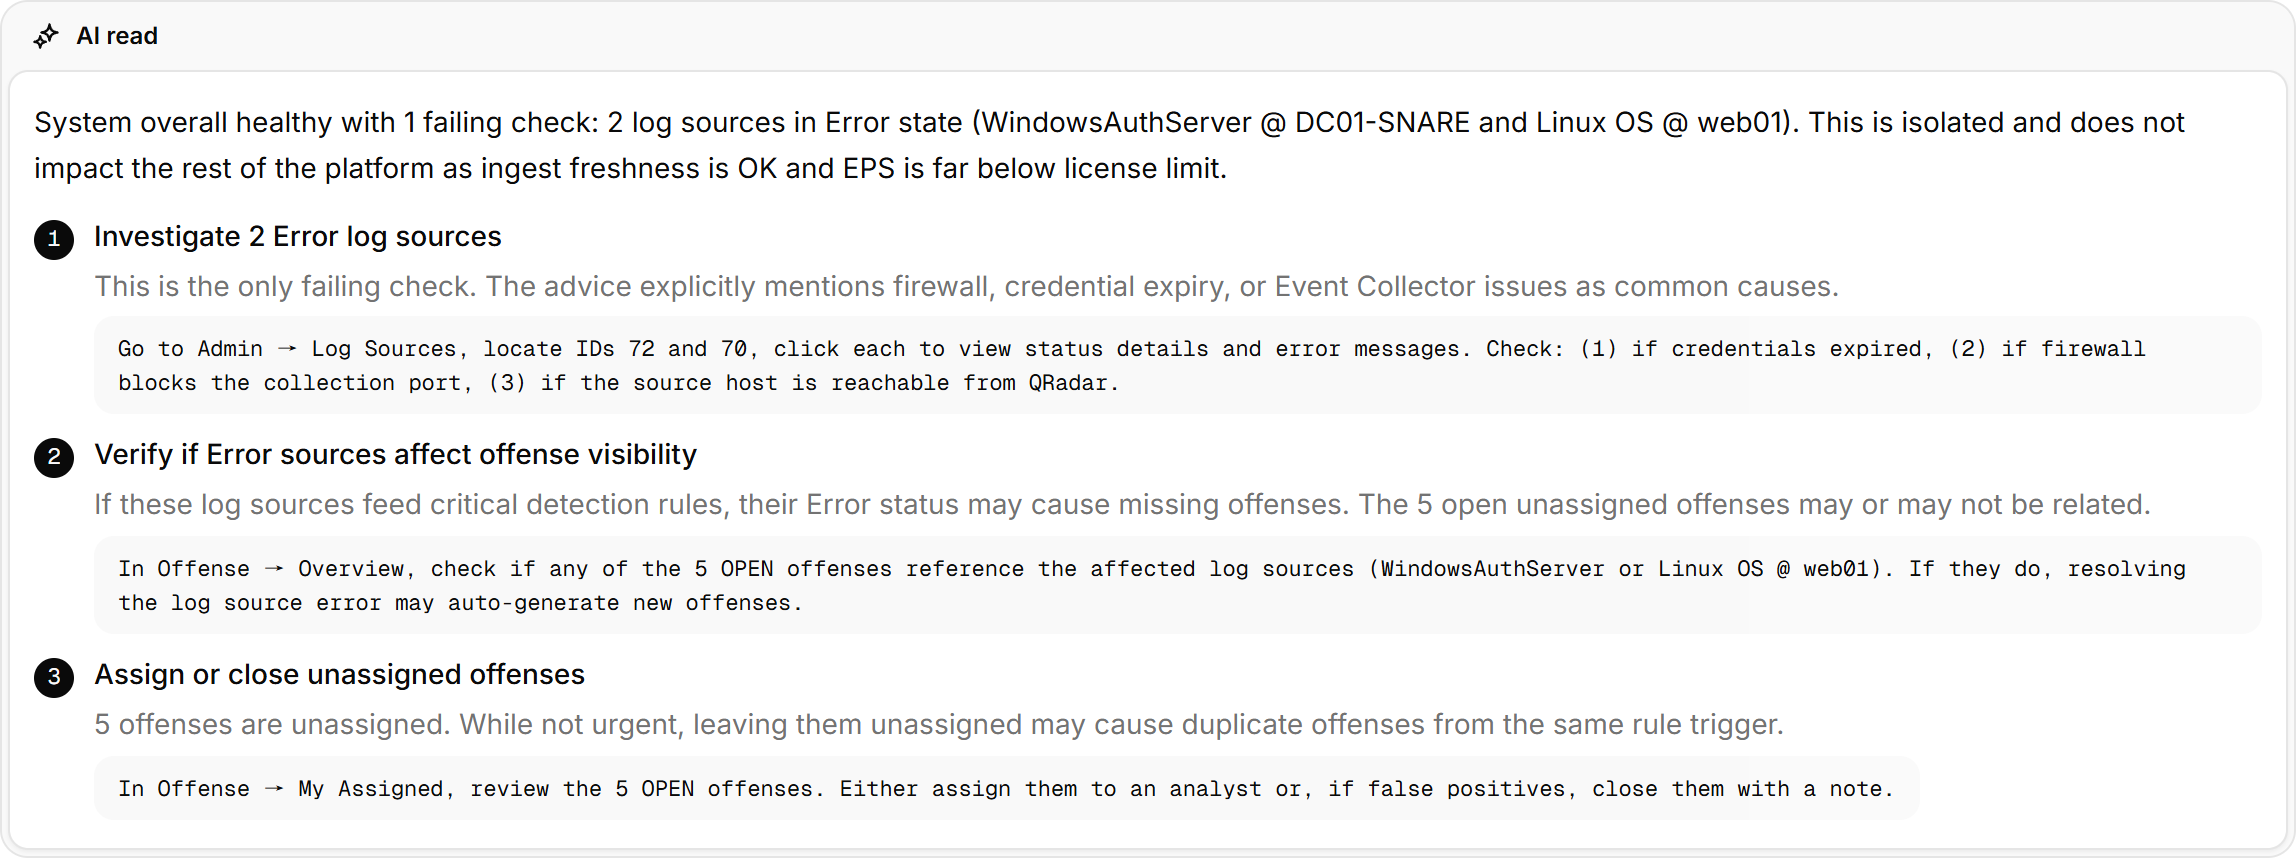
The model looks at the failing checks together: which ones share a root cause (a saturated EPS license and Disconnected log sources are often one problem), what to fix first and how, down to the place in QRadar such as System and License Management or Log Sources under Admin.
Prerequisites
- A Professional or Enterprise license, including a trial.
- At least one check did not pass.
Steps
- Under AI read, select AI read.
Checks
| Check | What it looks at | Verdict |
|---|---|---|
| Console connection and version | Whether /api/system/about answers, and the version | Unreachable is failing. Older than 7.4 is watch |
| Managed hosts | Status of each managed host | Failing if any host is in a bad state |
| EPS license usage | Average EPS as a share of each host's allocation, for the busiest host | 85% or more is watch, 100% or more is failing |
| Log source status | Enabled log sources in Error, Disconnected, Warning or NA | Any is watch. 20% or more of them, or 20 or more, is failing. No enabled log source is watch |
| Ingest freshness | Time since the last event of each enabled log source | 6 hours is watch, 24 hours is failing |
| Offense backlog | OPEN offenses, and how many are older than 7 days or unassigned | 200 or more is watch, 800 or more is failing |
| Auto-discovered log sources | Auto-discovered log sources typed Unknown or Generic | Any is watch. Their events mostly parse generically, so rules do not match them |
The thresholds are set with the RST_PLATFORM_* settings; see the Configuration reference. Platform issues on Security posture shows how many checks on this page did not pass.
Reports
Daily, weekly and monthly reports: offense posture, top rules and entities, analysis activity, log-source health, model usage. Generate on demand, or on a schedule with archiving and delivery.
Settings
QRadar Console connection, log-source whitelist, field masking mode, audit and forwarding, version and updates. Changes apply as soon as they are saved.