

Product evaluation··Sevion Xia
RST AI Copilot for Prometheus: a hands-on evaluation
A dirty optic connector, 40 minutes without a single alert, then a screen of alerts at once: how Prometheus and RST AI Copilot for Prometheus trace them to a -40 dBm root cause in under a minute.

Version v1.0 · 2026-10 · Test environment: RST AI Copilot for Prometheus 0.2.3 · Prometheus 2.53.0 · Alertmanager 0.27.0 · Grafana 11.1.0 · model MiniMax-M3
Summary
The connector on one uplink optic of aggregation switch agg-03 gradually degraded, and receive power drifted down from -2.4 dBm. For the first 40 minutes the reading stayed above the warning threshold and nothing alerted. CRC errors followed, then intermittent loss of light, interface and eBGP flapping, and a traffic detour that pushed the other uplink to 88%. Finally the light went out. By then Alertmanager held more than a dozen alerts, mixed in with unrelated alerts from five firewalls and one switch with high CPU.
The fault was injected on a schedule into a 30-device simulated campus core network (parameters in the optic_decay scenario of lab/sim/labgen.py, reproducible). RST AI Copilot for Prometheus then handled triage and investigation. All figures come from the English-UI pass of the 2026-10-12 run:
- Triage: 14 alerts grouped into 5 clusters and scored in 31 seconds. Interface down on the agg-03 ↔ core-01 link ranked first, flagged as the root cause of the BGP and bandwidth alerts.
- Investigation: both ends of the top cluster were investigated. The agg-03 end ran 10 PromQL queries in 39 seconds, found receive power falling from -11.67 to -15.49 dBm over about 15 minutes before collapsing to -40 dBm, and concluded an optic or fibre fault. The core-01 end ran 7 queries in 22 seconds and checked the far end's receive power (-40 dBm) on its own.
- Guardrails: every model-written query is validated by Prometheus and runs only through the query API. Results are capped at 20 series, hostname and IP labels are masked before reaching the model, and each investigation runs under round, time and token budgets.
Prometheus raises the alerts. RST AI Copilot for Prometheus identifies the root cause behind them in under a minute, with the queries attached. People make the call.
1. Prologue
The test network is a 30-device campus core: border router wan-01, two core switches core-01 and core-02 (Huawei CE12804, AS 65000), 10 multi-vendor firewalls, 6 aggregation and 11 access switches. Each aggregation switch has two 100G uplinks, one to each core; agg-01 to agg-04 run eBGP to the core. agg-03 is an H3C S6850-56HF, and the fault in this run is on its uplink to core-01.

At 11:37 the optic on agg-03's uplink to core-01 (HGE1/0/1) starts to degrade. Receive power falls every minute but stays above the -13.5 dBm warning line for 40 minutes. CRC errors start around minute 17. From around minute 33 the light drops out for 45 seconds in every 150; the interface and BGP session flap, and traffic moves to the agg-03 ↔ core-02 uplink, which reaches 88%. Around minute 49 the light is gone.
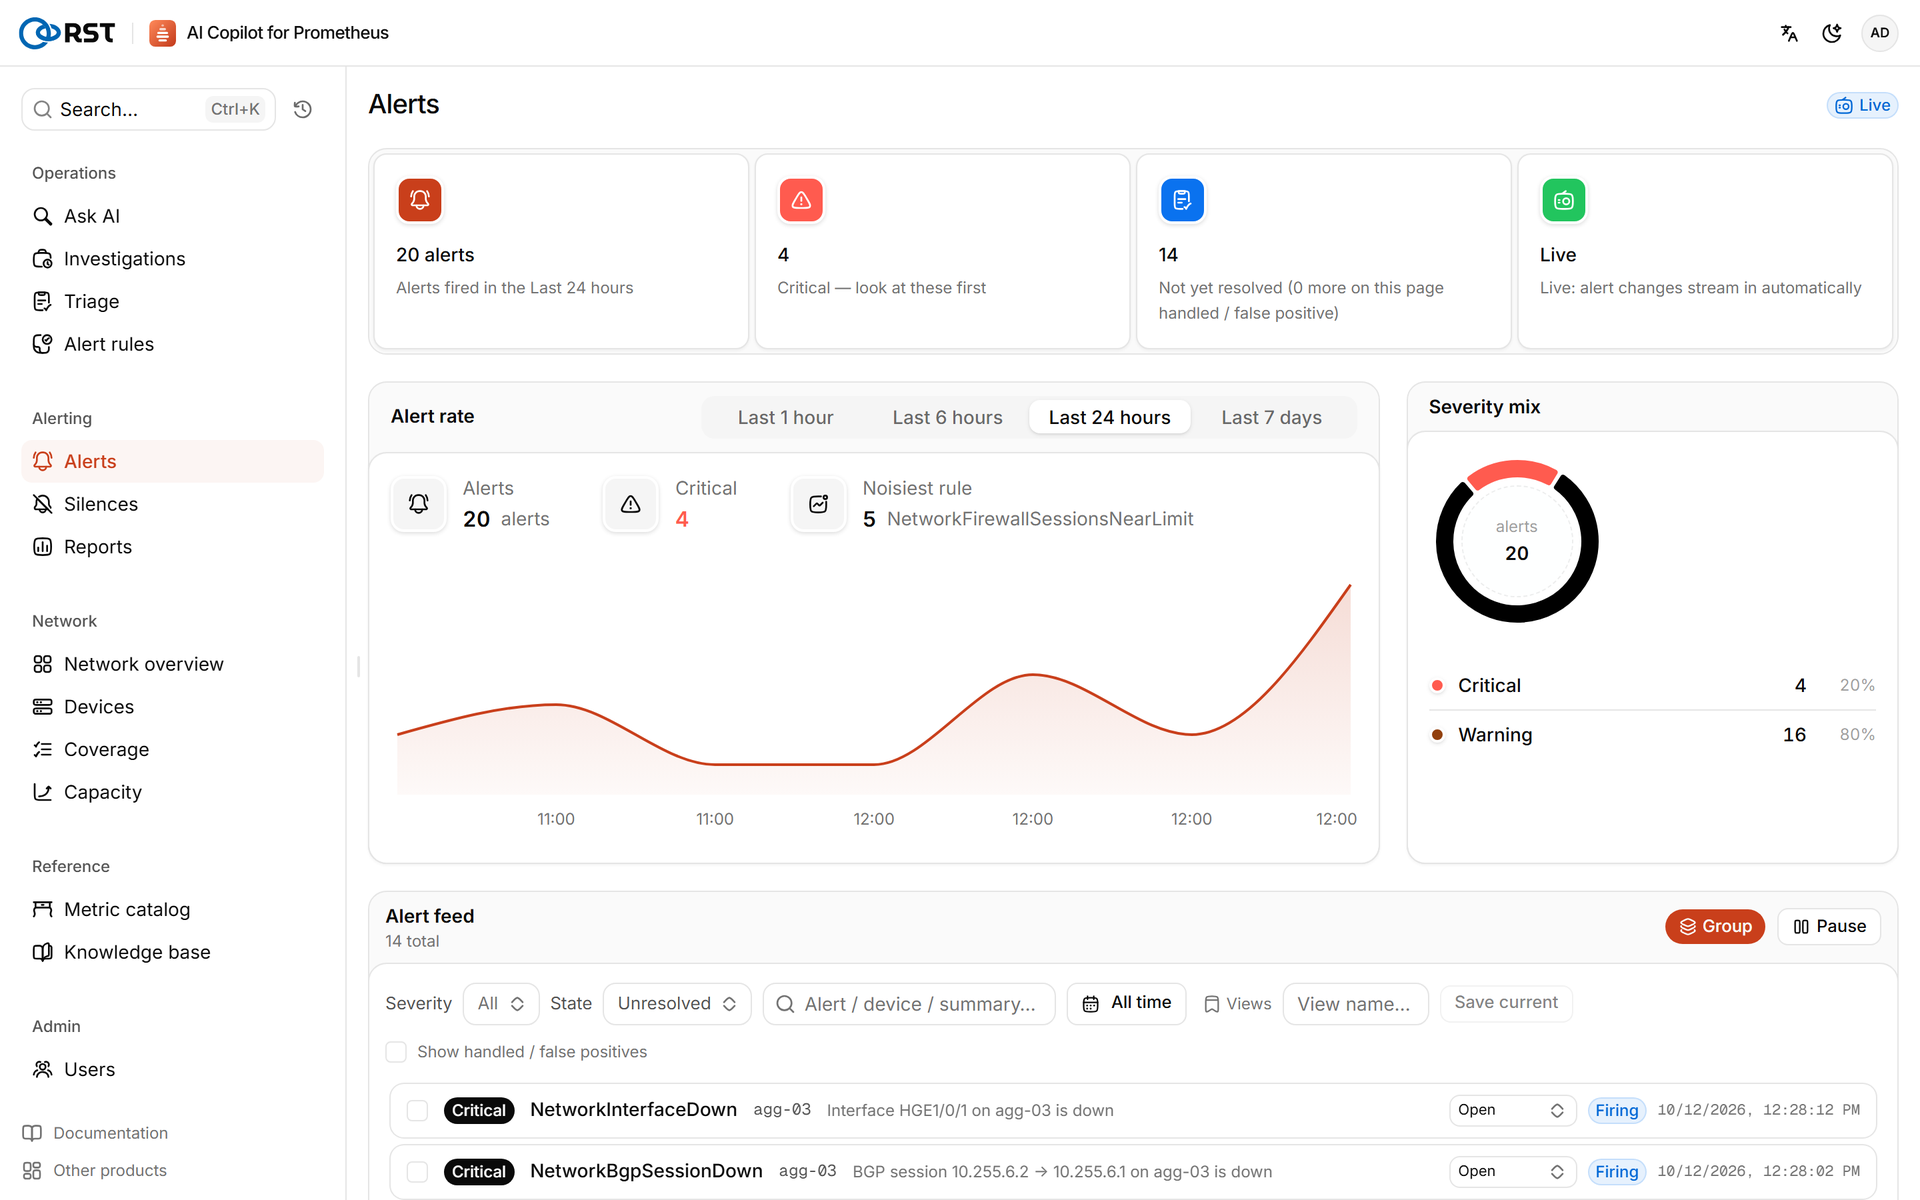
At 12:31 the on-call engineer opens Alertmanager:
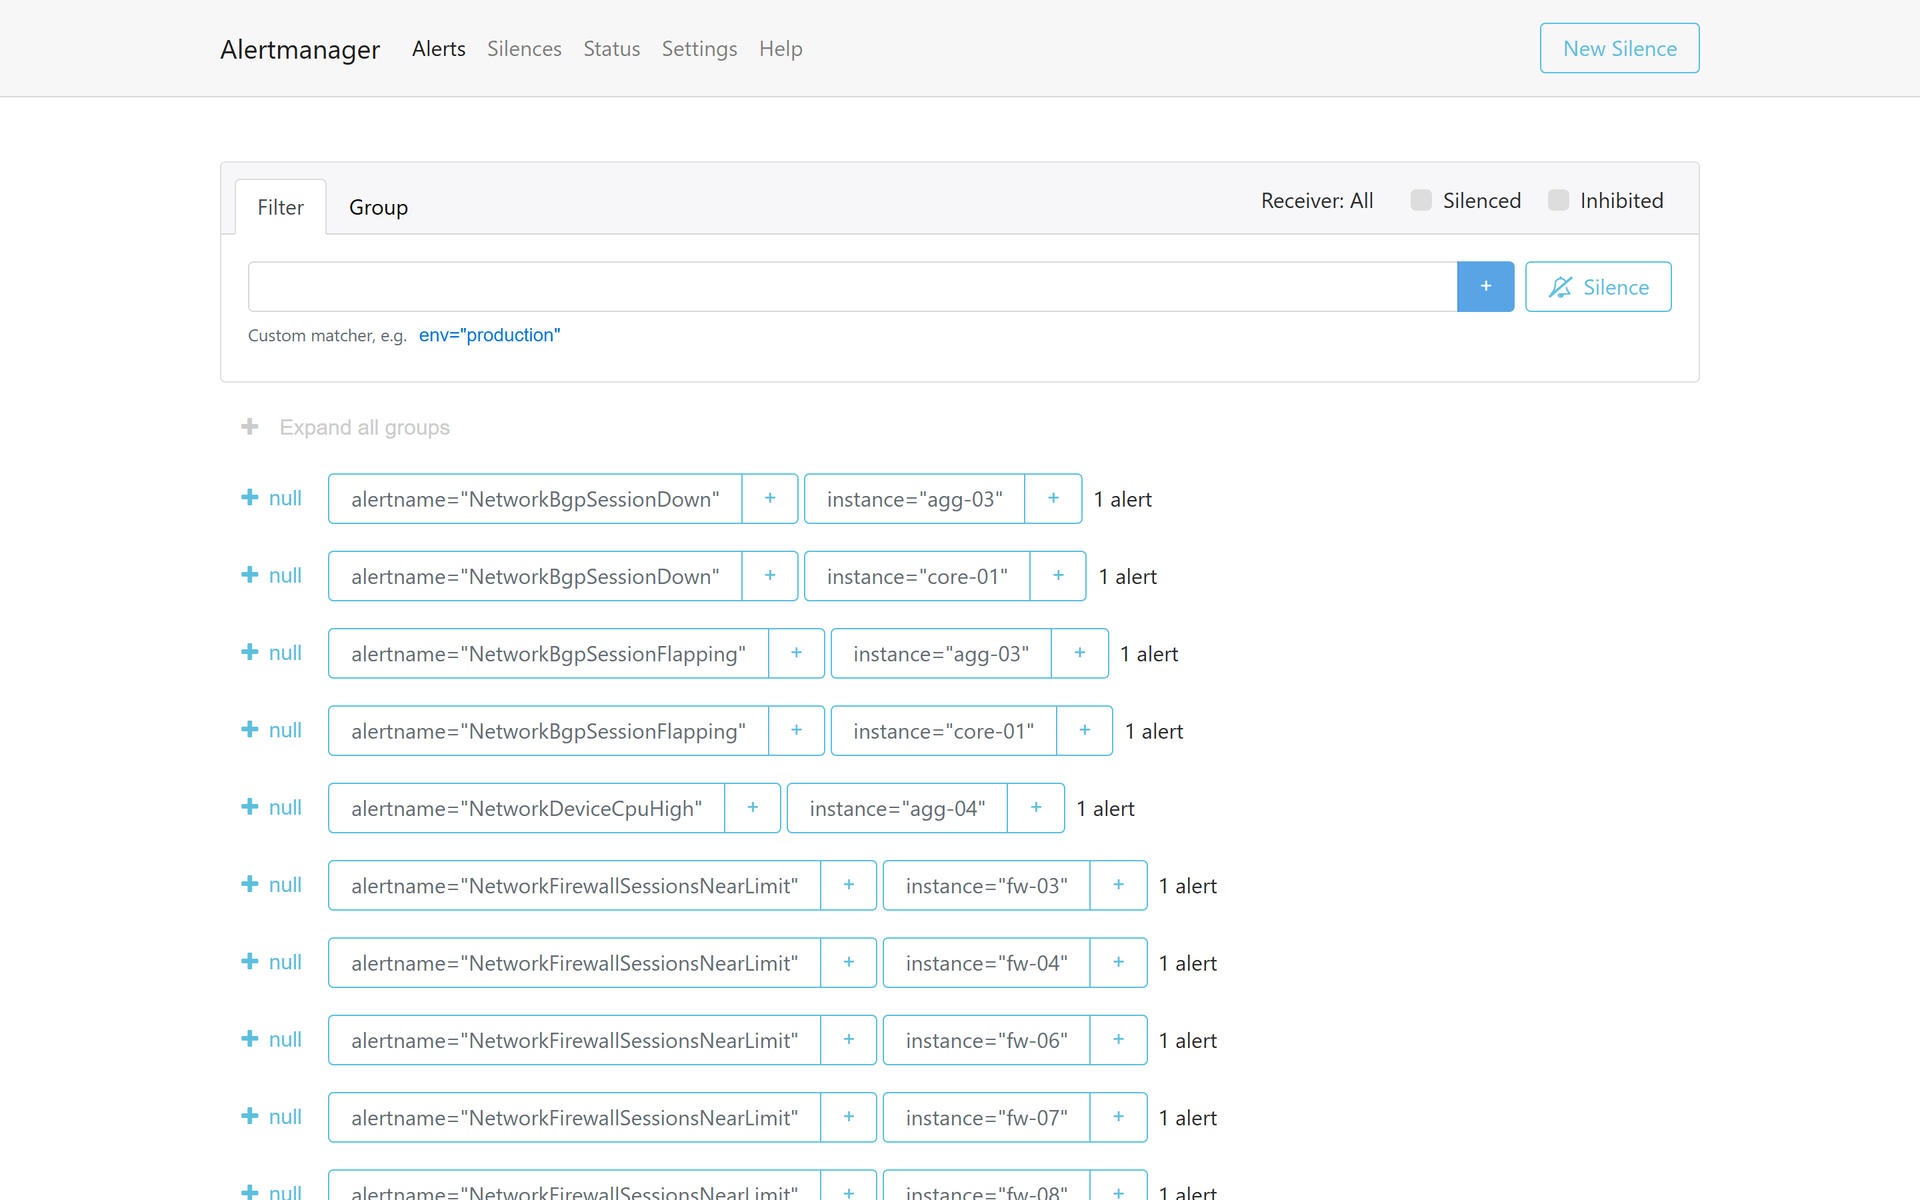
Interface down, BGP down and BGP flapping on both ends, four bandwidth alerts, five firewalls near their session limit, and high CPU on agg-04. The earliest "receive power low" alert has already cleared: readings below -30 dBm count as no light, and the interface-down alert takes over. The engineer has three questions:
- What first? Four critical alerts and several warnings; Alertmanager doesn't rank them.
- Which alerts belong together? Whether BGP down, BGP flapping and high bandwidth share a cause, and whether the firewall and CPU alerts are related.
- What is the root cause? Interface down is a symptom. The cause could be the optic, the fibre, the far-end port or a configuration error, and finding it takes a dozen hand-written PromQL queries.
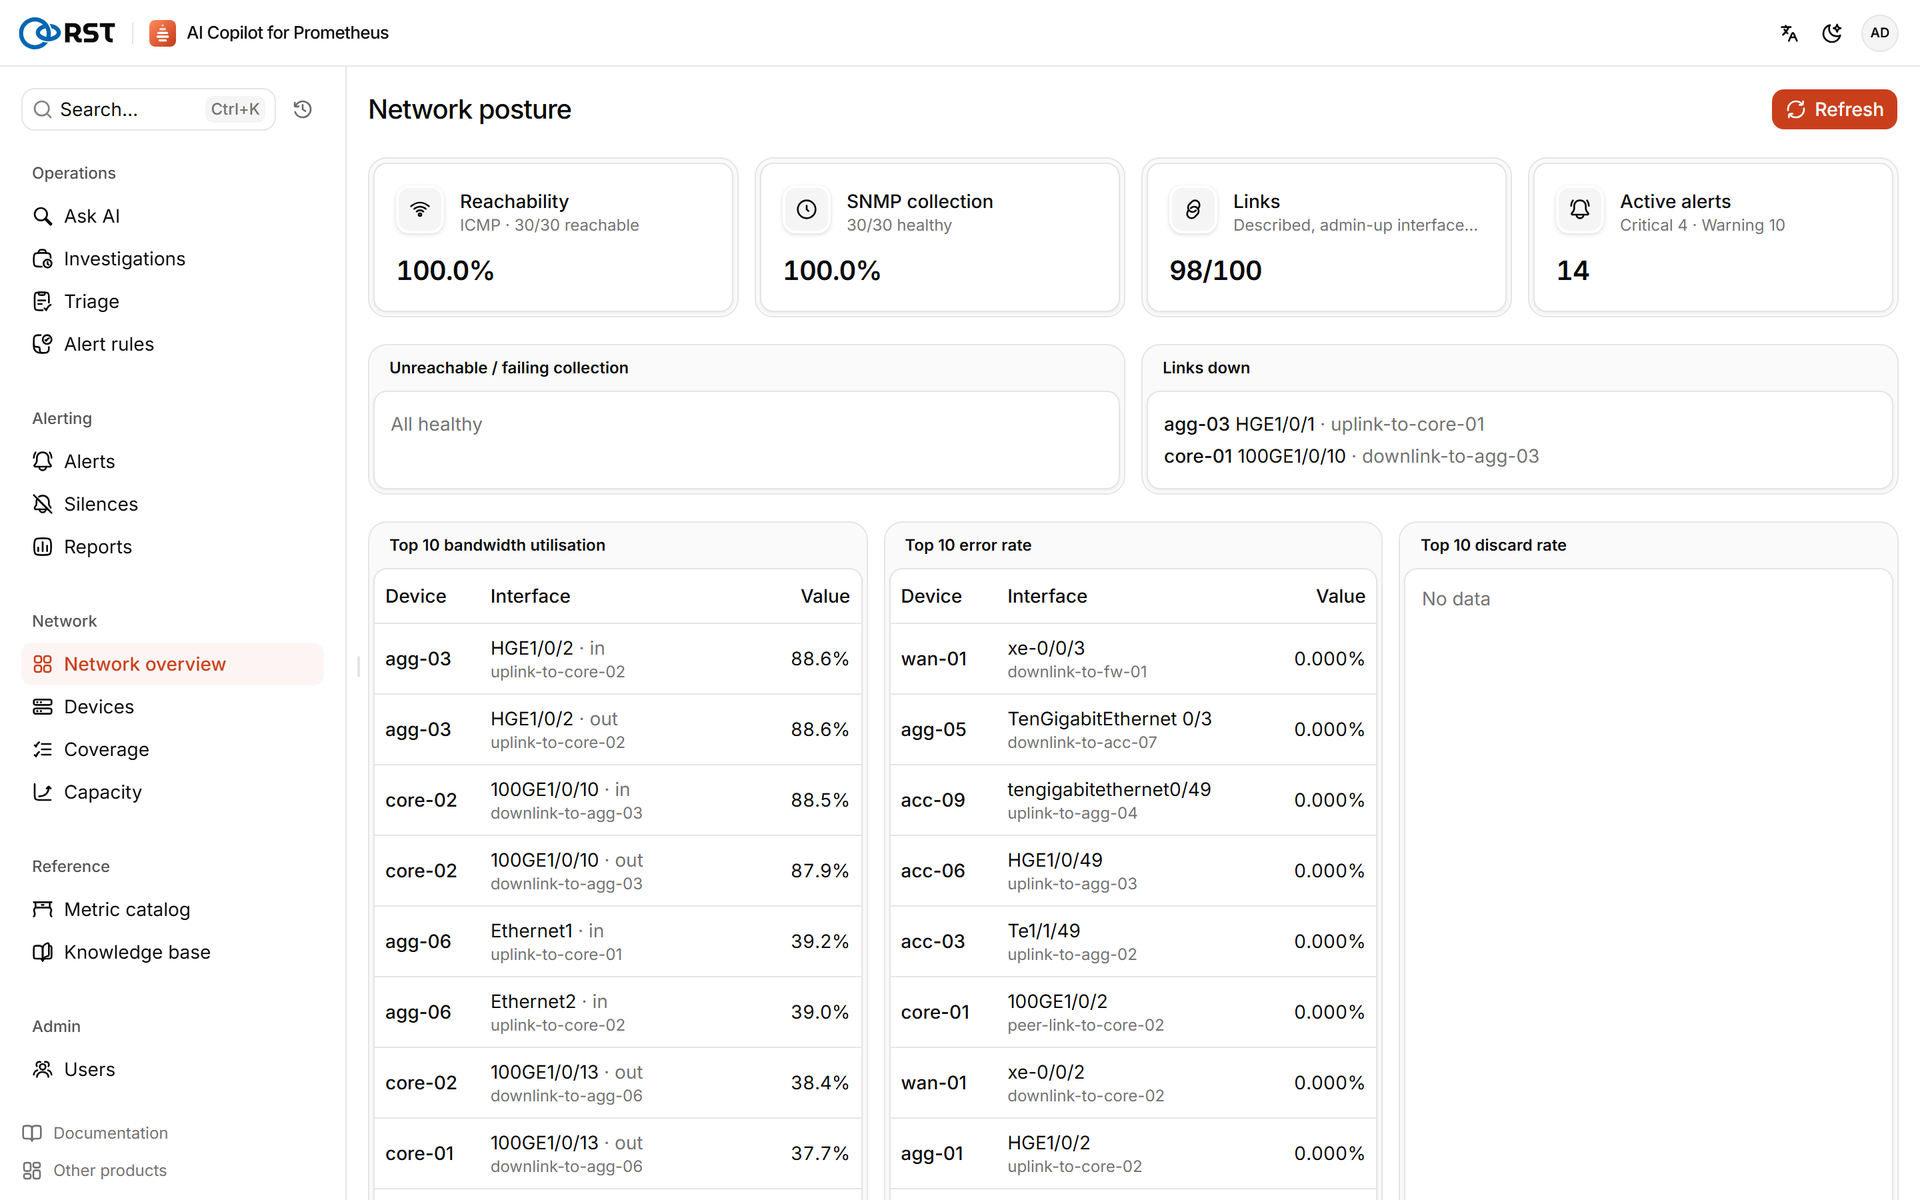
RST AI Copilot for Prometheus runs on top of Prometheus and Alertmanager and reads metrics and alerts over their HTTP APIs. It doesn't replace alerting rules; it handles the triage and investigation that follow. At the same moment its network overview has already narrowed things down: the down-links panel lists agg-03 HGE1/0/1 ↔ core-01 100GE1/0/10, and the top four bandwidth rows belong to the detour link at 88%.
2. Dual-track replay
The table sets what happened on the network against whether Prometheus alerted and what RST AI Copilot for Prometheus added.

Times are local. "Minute" counts from scenario start (11:37); alert times are when the Prometheus ALERTS series went to firing.
| Time | Event | Prometheus alert | RST AI Copilot for Prometheus |
|---|---|---|---|
| Min 0–41 | agg-03 HGE1/0/1 receive power drifts down from -2.4 dBm, always above the -13.5 dBm warning line |  None (rules check thresholds, not trends) None (rules check thresholds, not trends) | Investigation pre-fetches deriv(rx_power[1h]); Ask AI draws the curve |
| From the start | Five firewalls near session-table limit (unrelated) |  FirewallSessionsNearLimit ×5 FirewallSessionsNearLimit ×5 | Own cluster, #4 |
| Min 15 | agg-04 CPU high (unrelated) | DeviceCpuHigh | Own cluster, #2 |
| From ~min 17 | Receive power -7 dBm, inbound CRC errors | InterfaceErrorRateHigh (min 30) | Resolved before triage |
| From ~min 33 | Receive power -11.5 dBm, periodic loss of light, both ends flap | InterfaceFlapping (min 37) | Resolved before triage |
| From ~min 33 | agg-03 ↔ core-01 eBGP session flaps with the interface | BgpSessionFlapping (min 37.5) | Resolved at min 60, before the English pass |
| From ~min 33 | Traffic moves to agg-03 ↔ core-02, about 88% utilisation | InterfaceBandwidthHigh ×4 (min 48) | "Traffic re-homed onto the backup path after the primary link dropped" |
| ~Min 41 | Receive power crosses -13.5 dBm | TransceiverRxPowerLow (fired min 46.5, cleared min 49 at loss of light) | Cleared before triage; investigation recovers it from optic metrics |
| ~Min 49 | Light gone, reading -40 dBm, interface and BGP stay down | InterfaceDown ×2 (min 50.5–51), BgpSessionDown ×2 (min 51) | Ranked #1; investigation confirms no light at the physical layer |
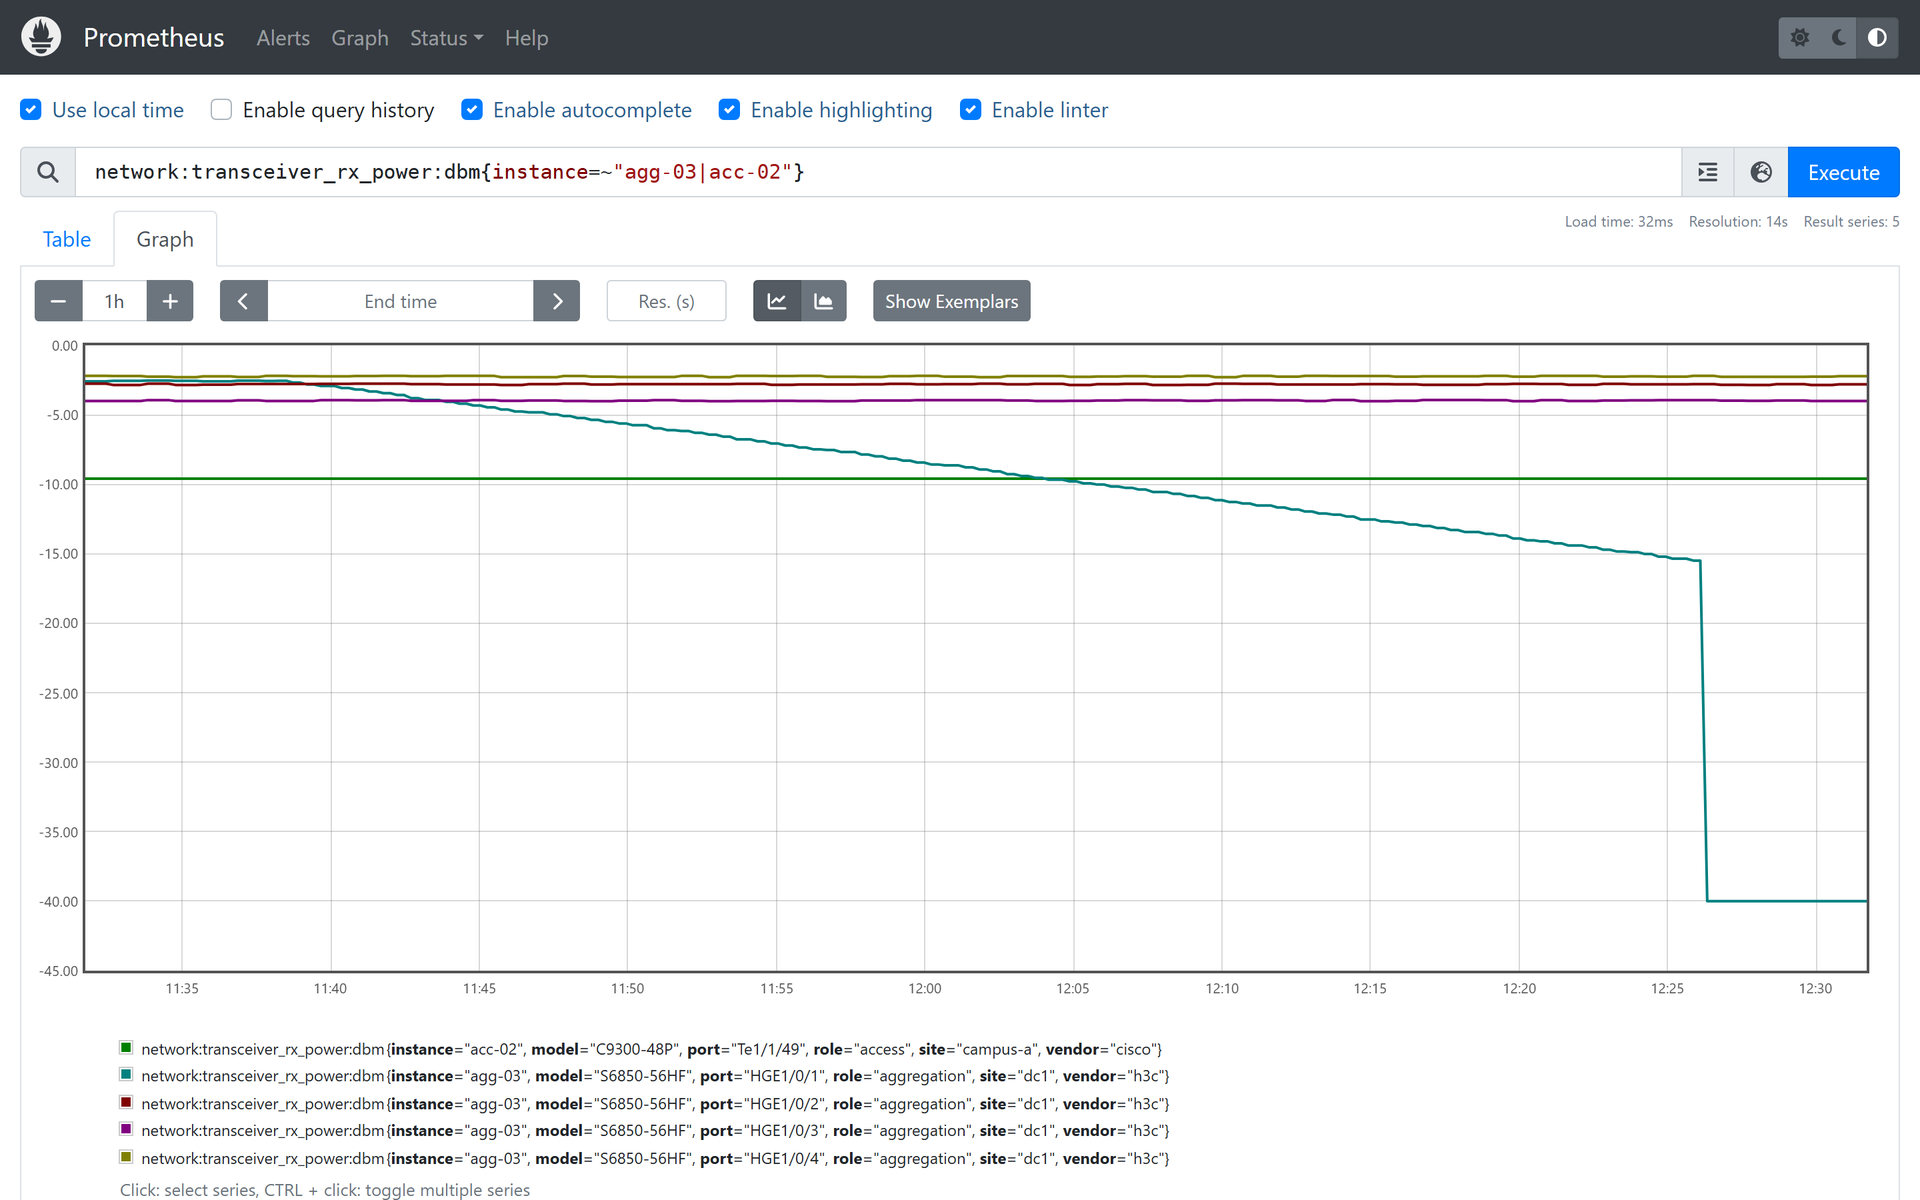
The first row matters most: the first 40 minutes of the fault produced no alert. The rule pack deliberately omits "falling but still above threshold" alerts because they are noisy in production. That stretch exists only as TSDB metrics and has to be queried to be seen.
Receive power in Prometheus (agg-03's four optics and one optic on acc-02, last hour):
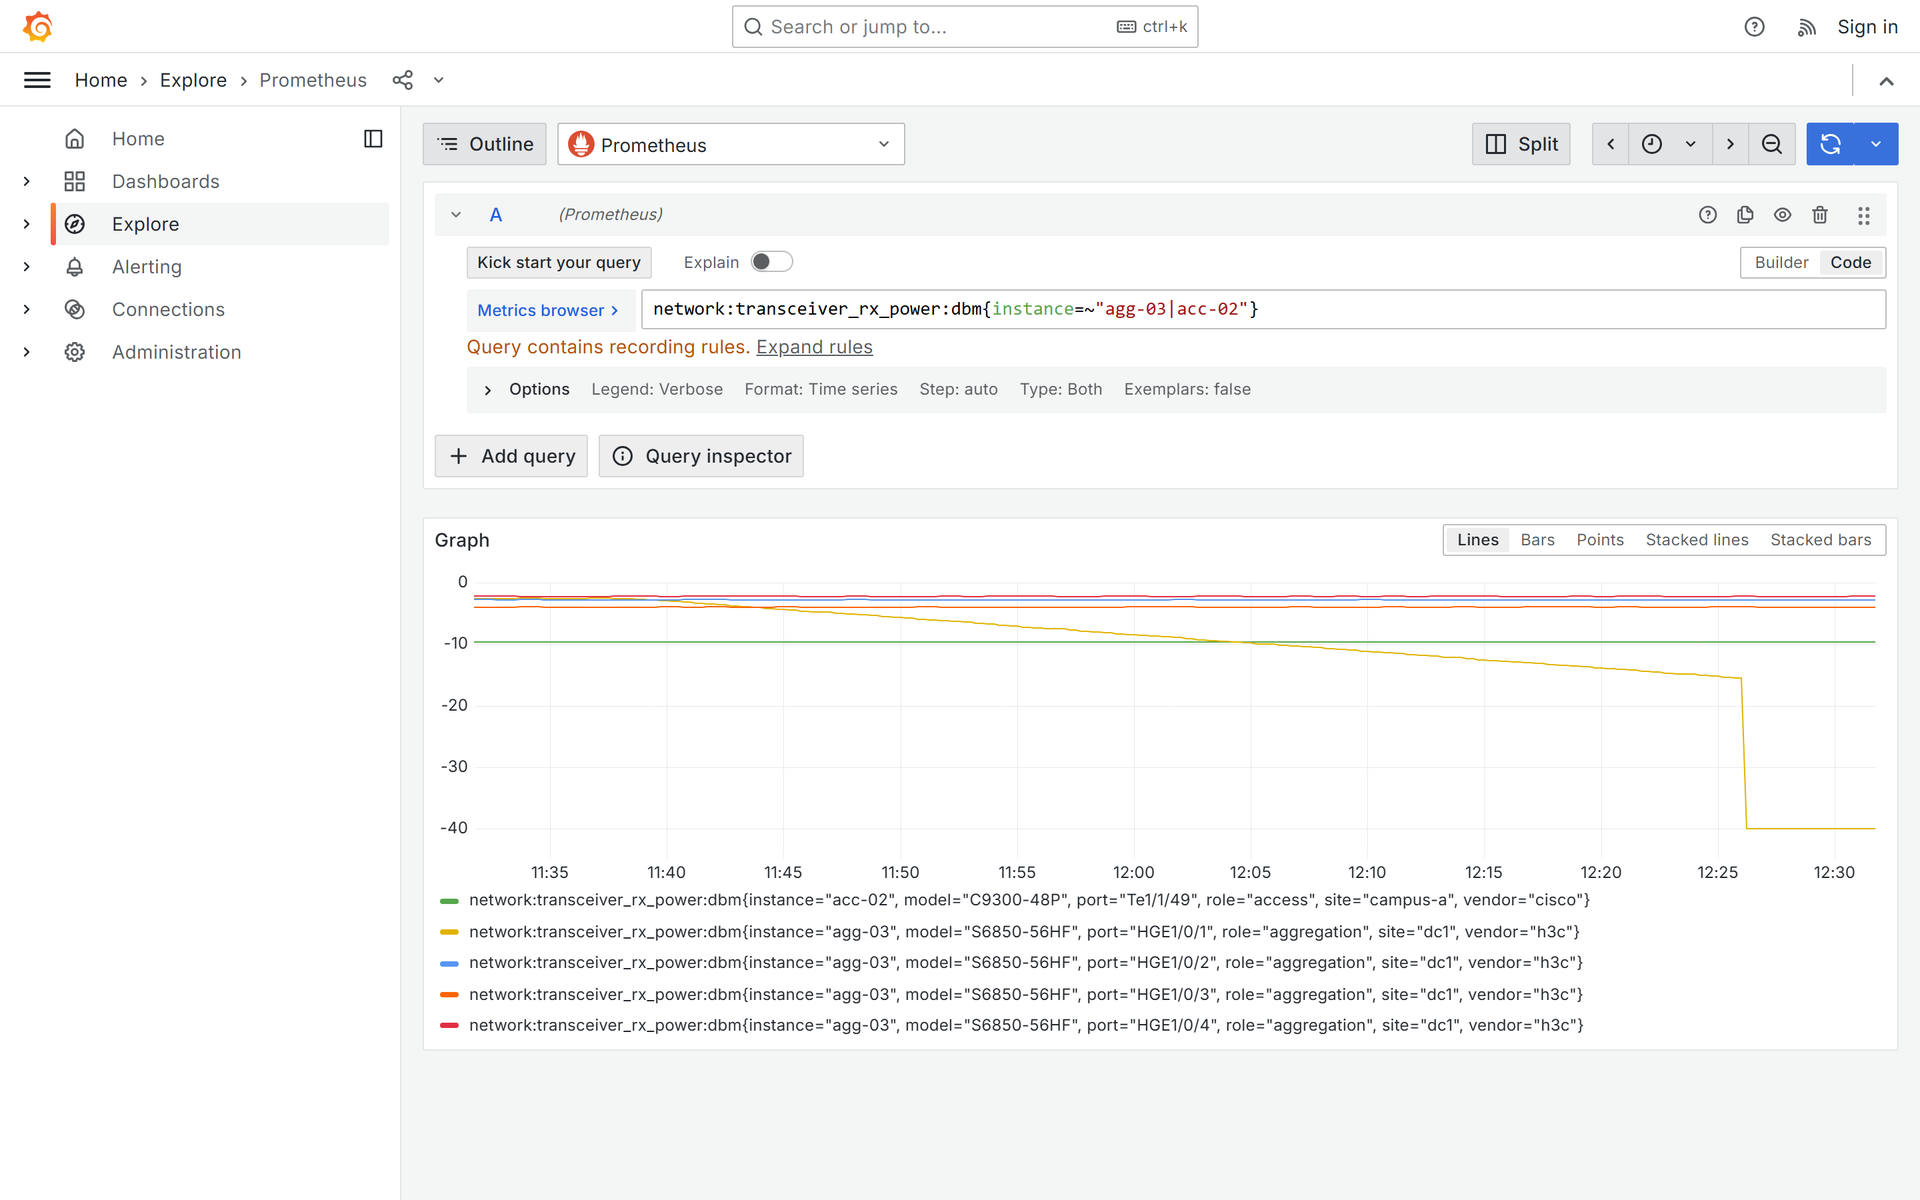
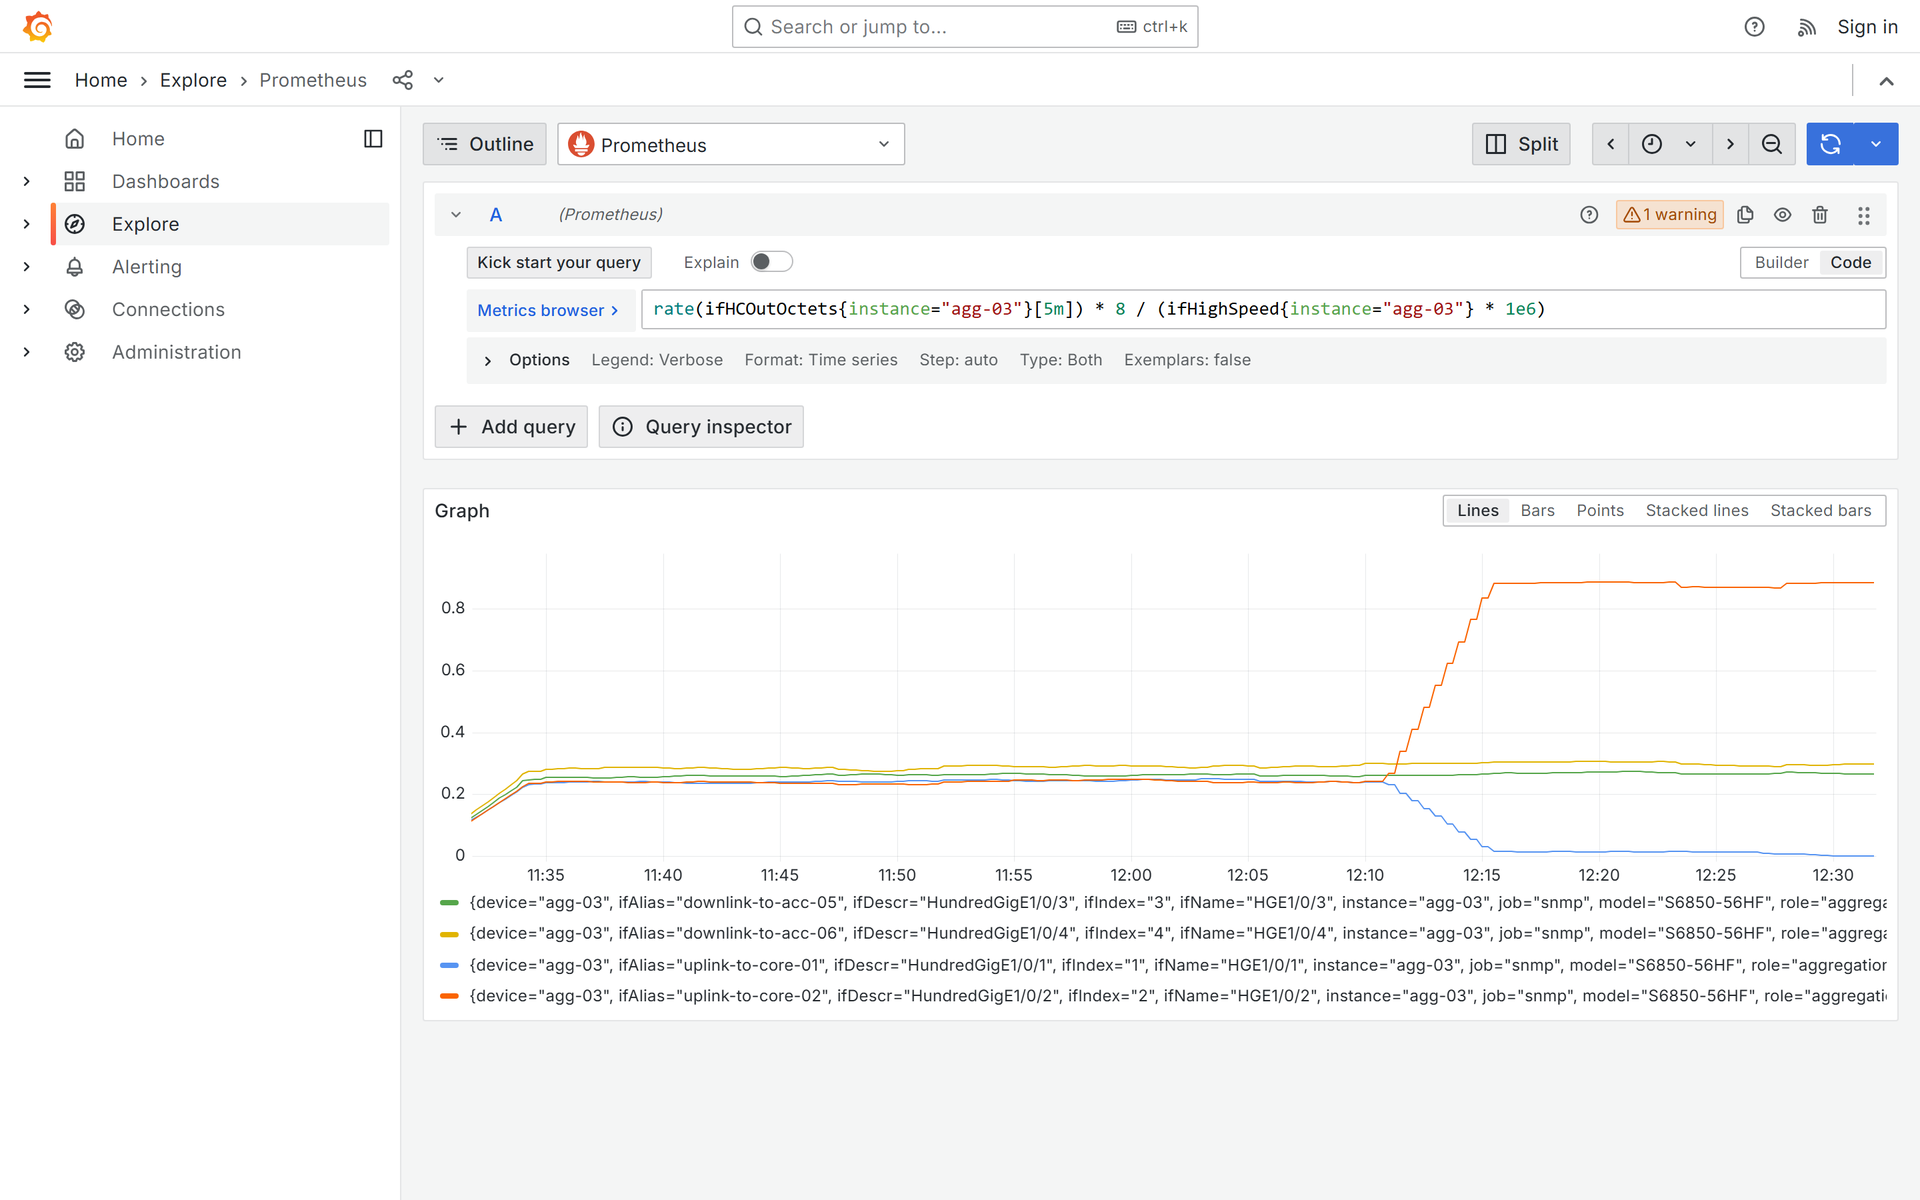
The same data in Grafana Explore:
Outbound utilisation of agg-03's two uplinks: around 12:10 the link to core-01 (blue) drops to zero and the link to core-02 (orange) rises to about 88%.
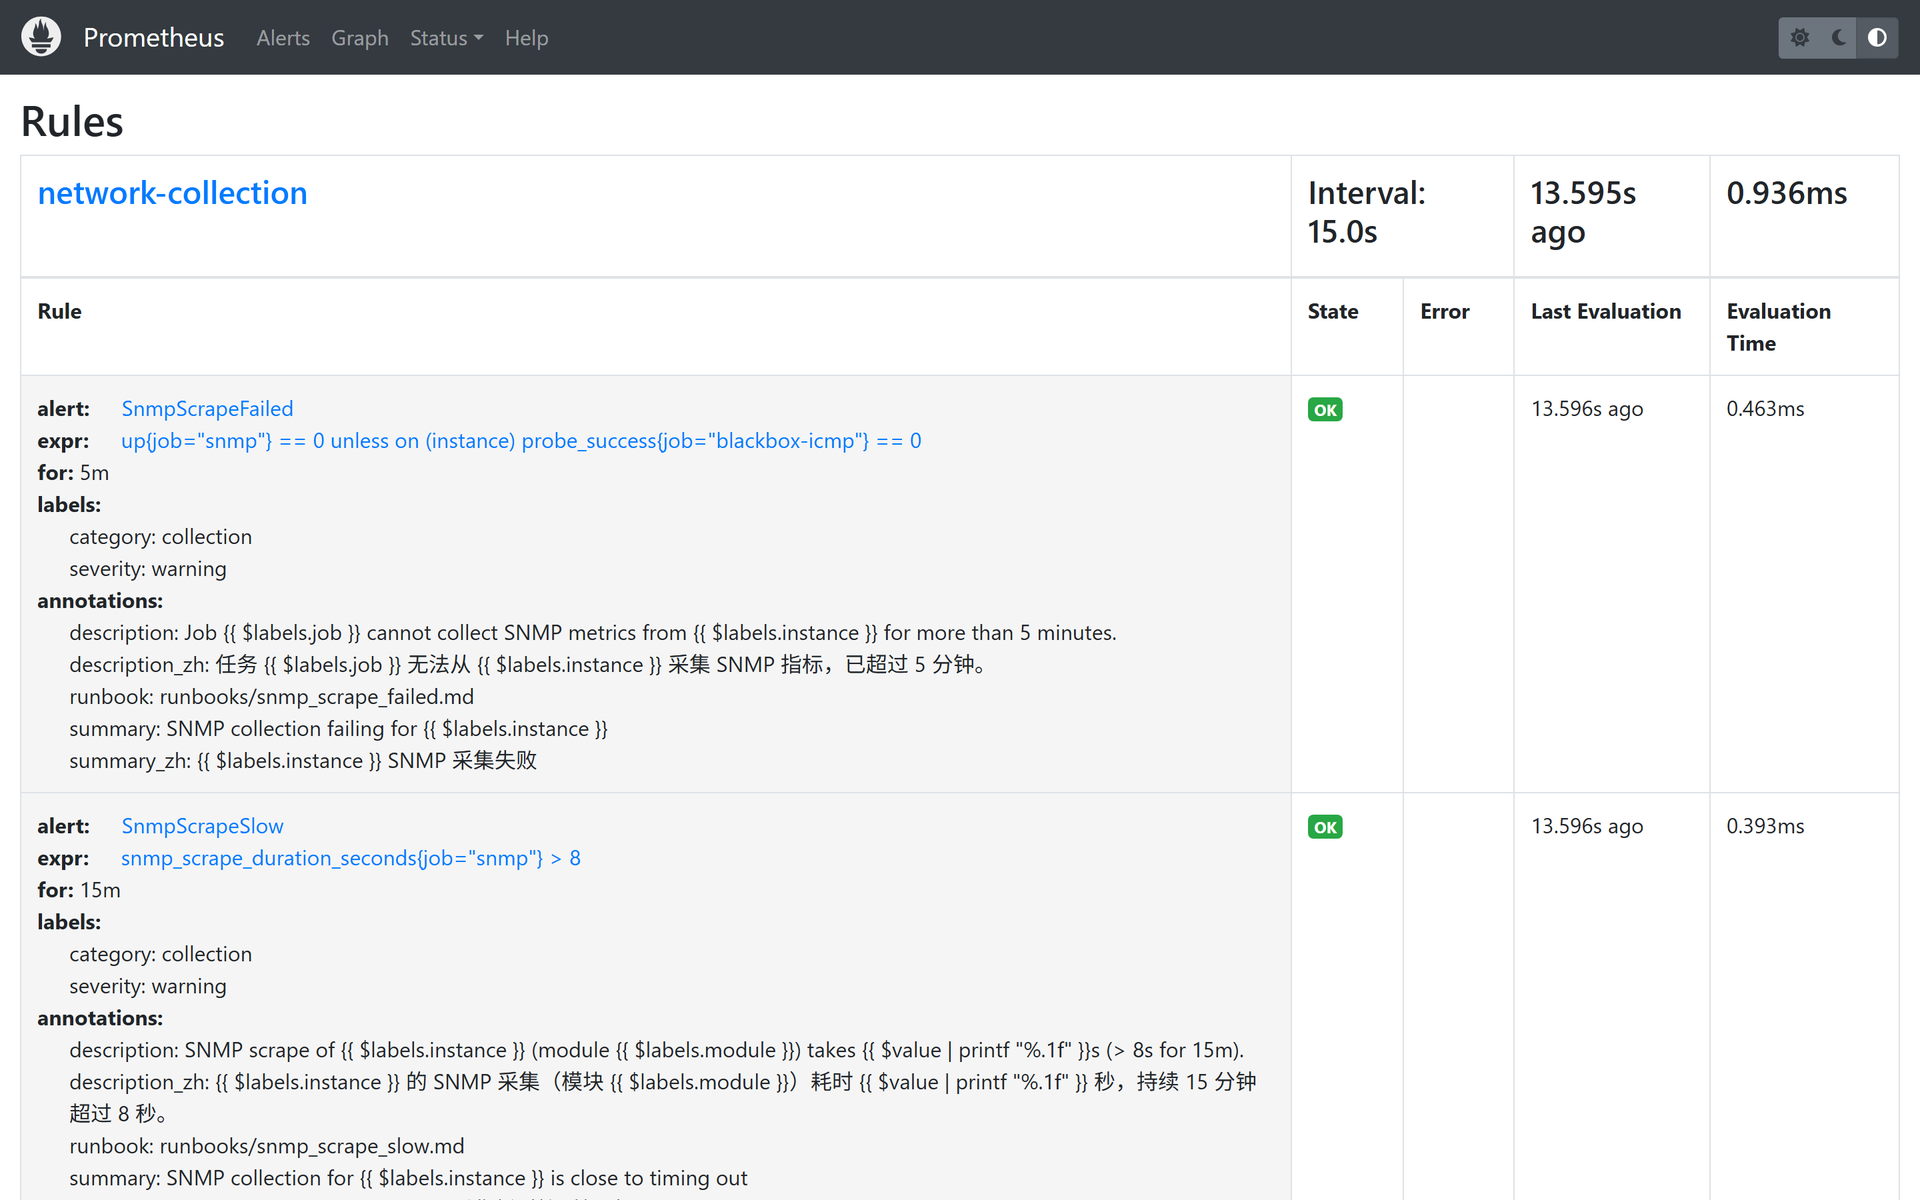
The alerting rules used in this run:
3. Triage
The Alerts page groups Alertmanager alerts by severity, timeline and rule; triage and investigation start here.
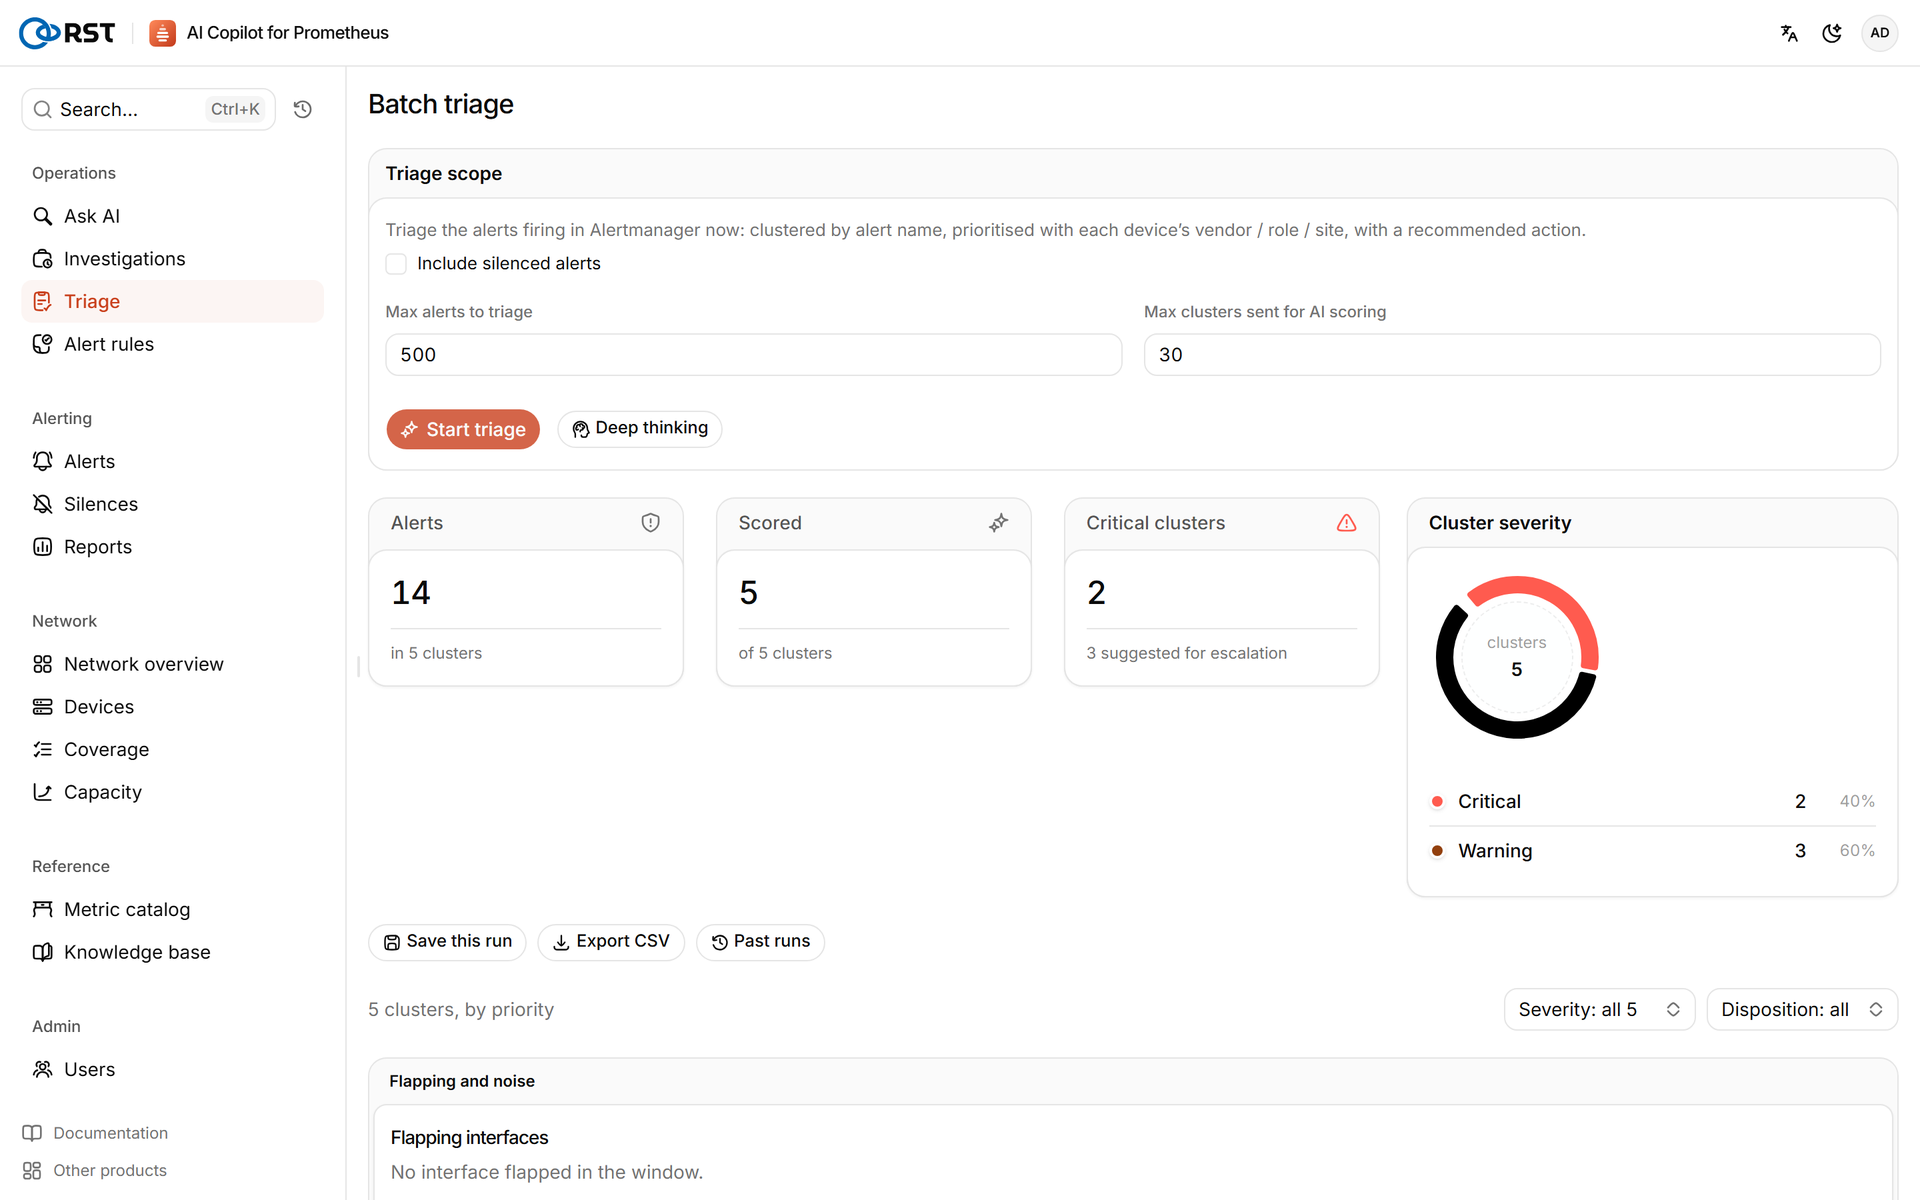
The engineer clicks "Start triage". The product pulls all current alerts, clusters them by (alert name, device), attaches vendor, model, role and site from the device inventory, and has the model rate, rank, assess false positives and recommend actions.
Result in 31 seconds. 14 alerts in 5 clusters, all scored, no degradation. 2 critical, 3 warning; 3 recommended for escalation.
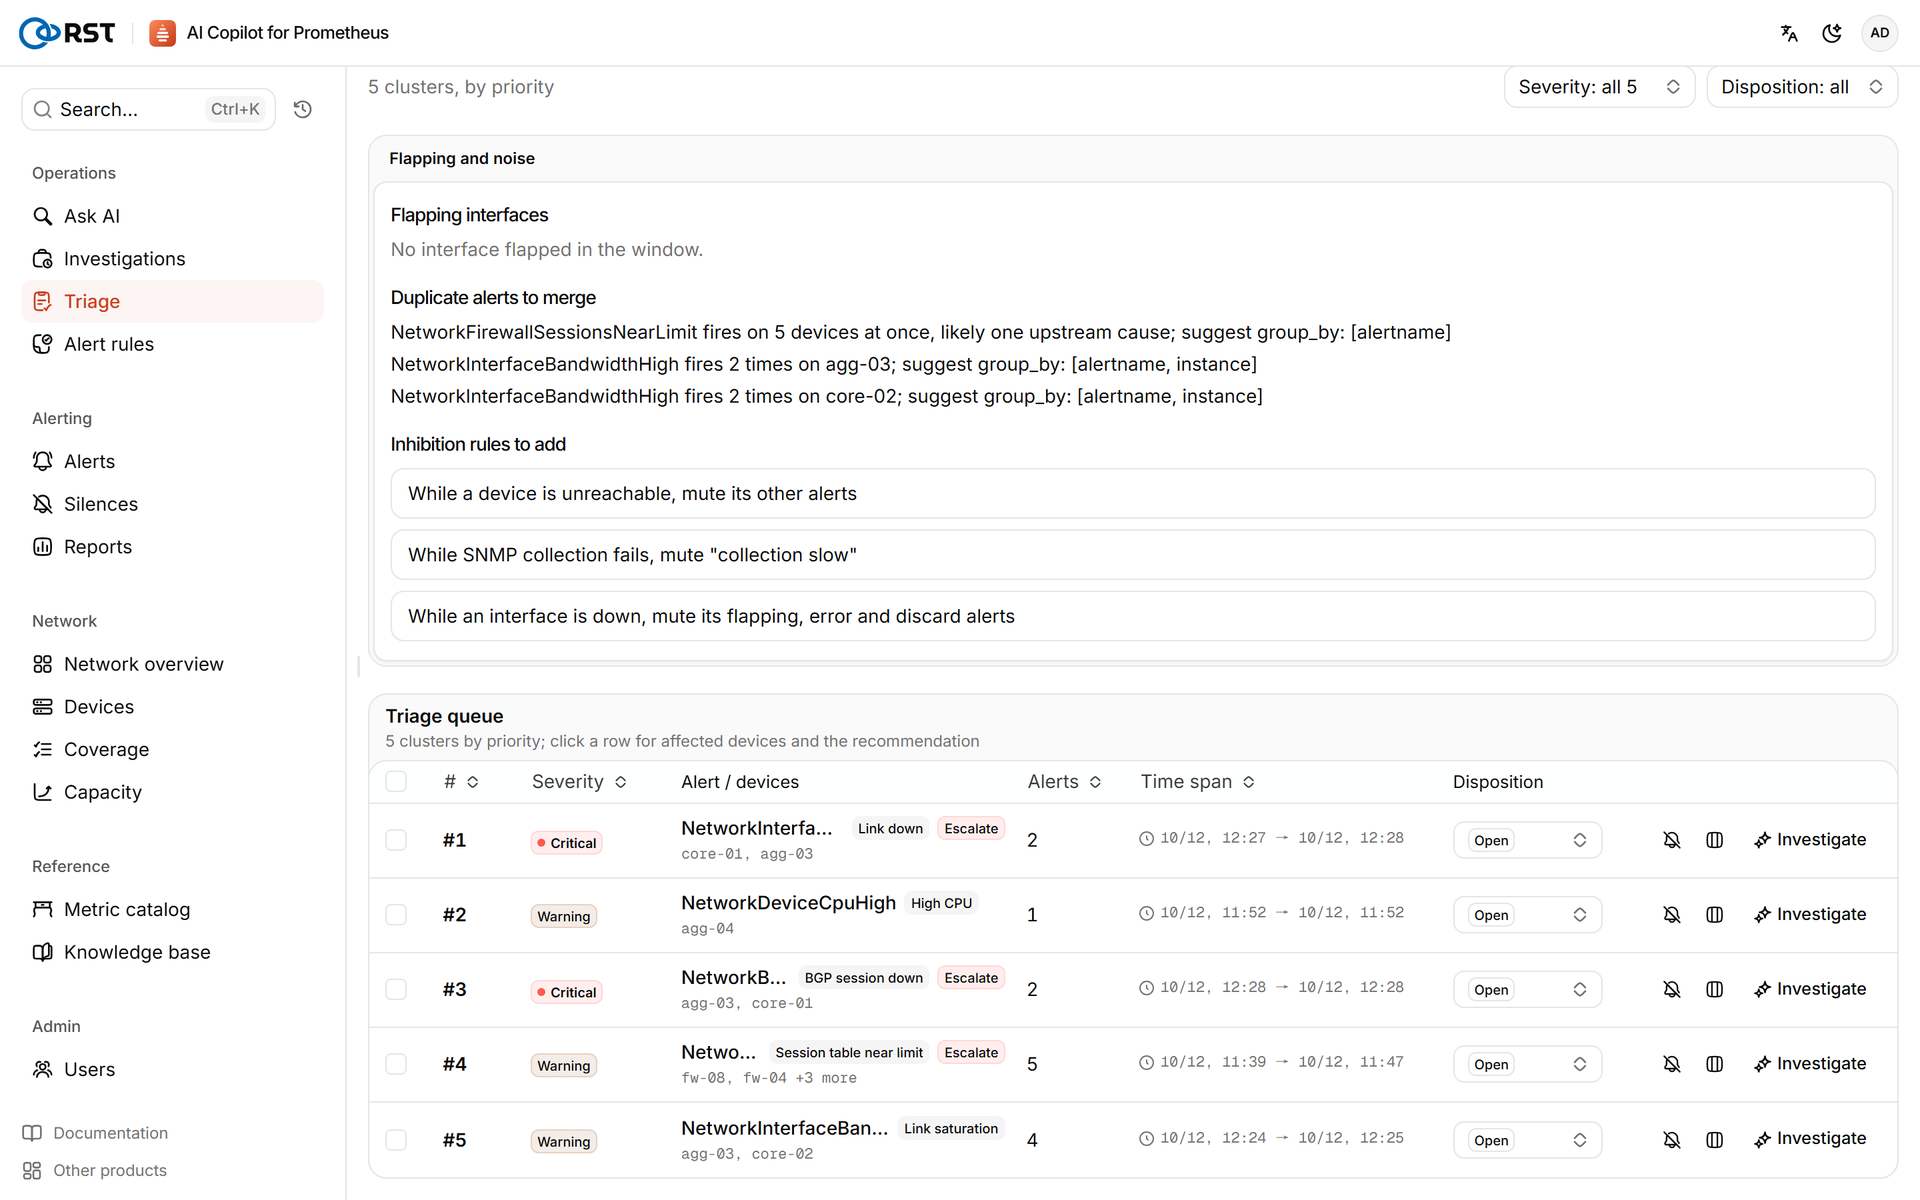
| Rank | Severity | Alert / devices | Alerts | Key point |
|---|---|---|---|---|
| #1 | Critical | NetworkInterfaceDown · core-01, agg-03 | 2 | "Root cause of the BGP session and the agg-03→core-02 bandwidth-saturation alerts, so fix it first"; check receive power on both ends and the patch panel |
| #2 | Warning | NetworkDeviceCpuHigh · agg-04 | 1 | Separate event; H3C commands to find the busy task |
| #3 | Critical | NetworkBgpSessionDown · agg-03, core-01 | 2 | "Derived symptom of the core-01 100GE1/0/10 link outage … no independent escalation needed" |
| #4 | Warning | NetworkFirewallSessionsNearLimit · 5 firewalls | 5 | fw-08 at 125.1% of session-table capacity; check the other four before assuming one cause |
| #5 | Warning | NetworkInterfaceBandwidthHigh · agg-03, core-02 | 4 | agg-03 HGE1/0/2 egress 88.66%, "most likely traffic re-homed onto the backup path after the primary link dropped" |
The ranking matches what happened: interface down first, BGP down identified as its consequence, the bandwidth alerts explained as the detour.
Triage output is a starting point for the engineer. Two details are worth checking before acting:
- Order of work: the CPU cluster on agg-04 sits at #2, but the BGP-down cluster is explicitly tied to #1, so restoring the link comes first.
- Management address: the #2 recommendation shows the agg-04 management IP as the masked placeholder "10.10.x.x"; take the real address from the device inventory.
4. Investigation
The engineer clicks "Investigate" on the top cluster. It holds the alerts from both ends of the same link; the run investigated the core-01 end first, then the agg-03 end.

An investigation has two steps:
- Fixed pre-fetch: before the model is involved, the server runs queries derived from the alert labels: device liveness, CPU/memory/temperature, port state, traffic and errors. If the alert names a port, it adds receive power, the warning threshold and the
deriv(rx_power[1h])slope; if it names a BGP peer, it adds peer state and session re-establishments in the last hour. - Autonomous retrieval: the model reads the pre-fetched evidence, writes its own read-only PromQL and decides the next query from the results. Each round can run several queries in parallel, up to 4 model rounds and 120 seconds.
The agg-03 end: -40 dBm in 39 seconds
agg-03 is an H3C switch with optic readings collected. The pre-fetch returned receive power -40 dBm, warning threshold -13.50 dBm and a one-hour slope of -41.93 dB/h.
The model then ran 10 queries: core-01 liveness and probe, core-01 ports admin-up but operationally down, matching ports by ifAlias, last-change time and admin state of core-01 100GE1/0/10, core-01 optic readings (no series; the lab does not simulate Huawei optics), and agg-03 receive power again. One query was a bare ifAlias=~".*-to-agg-03.*", which is not a valid expression. Validation rejected it, and the model rewrote it next round as {ifAlias=~".*-to-agg-03.*"}, which returned 94 series.
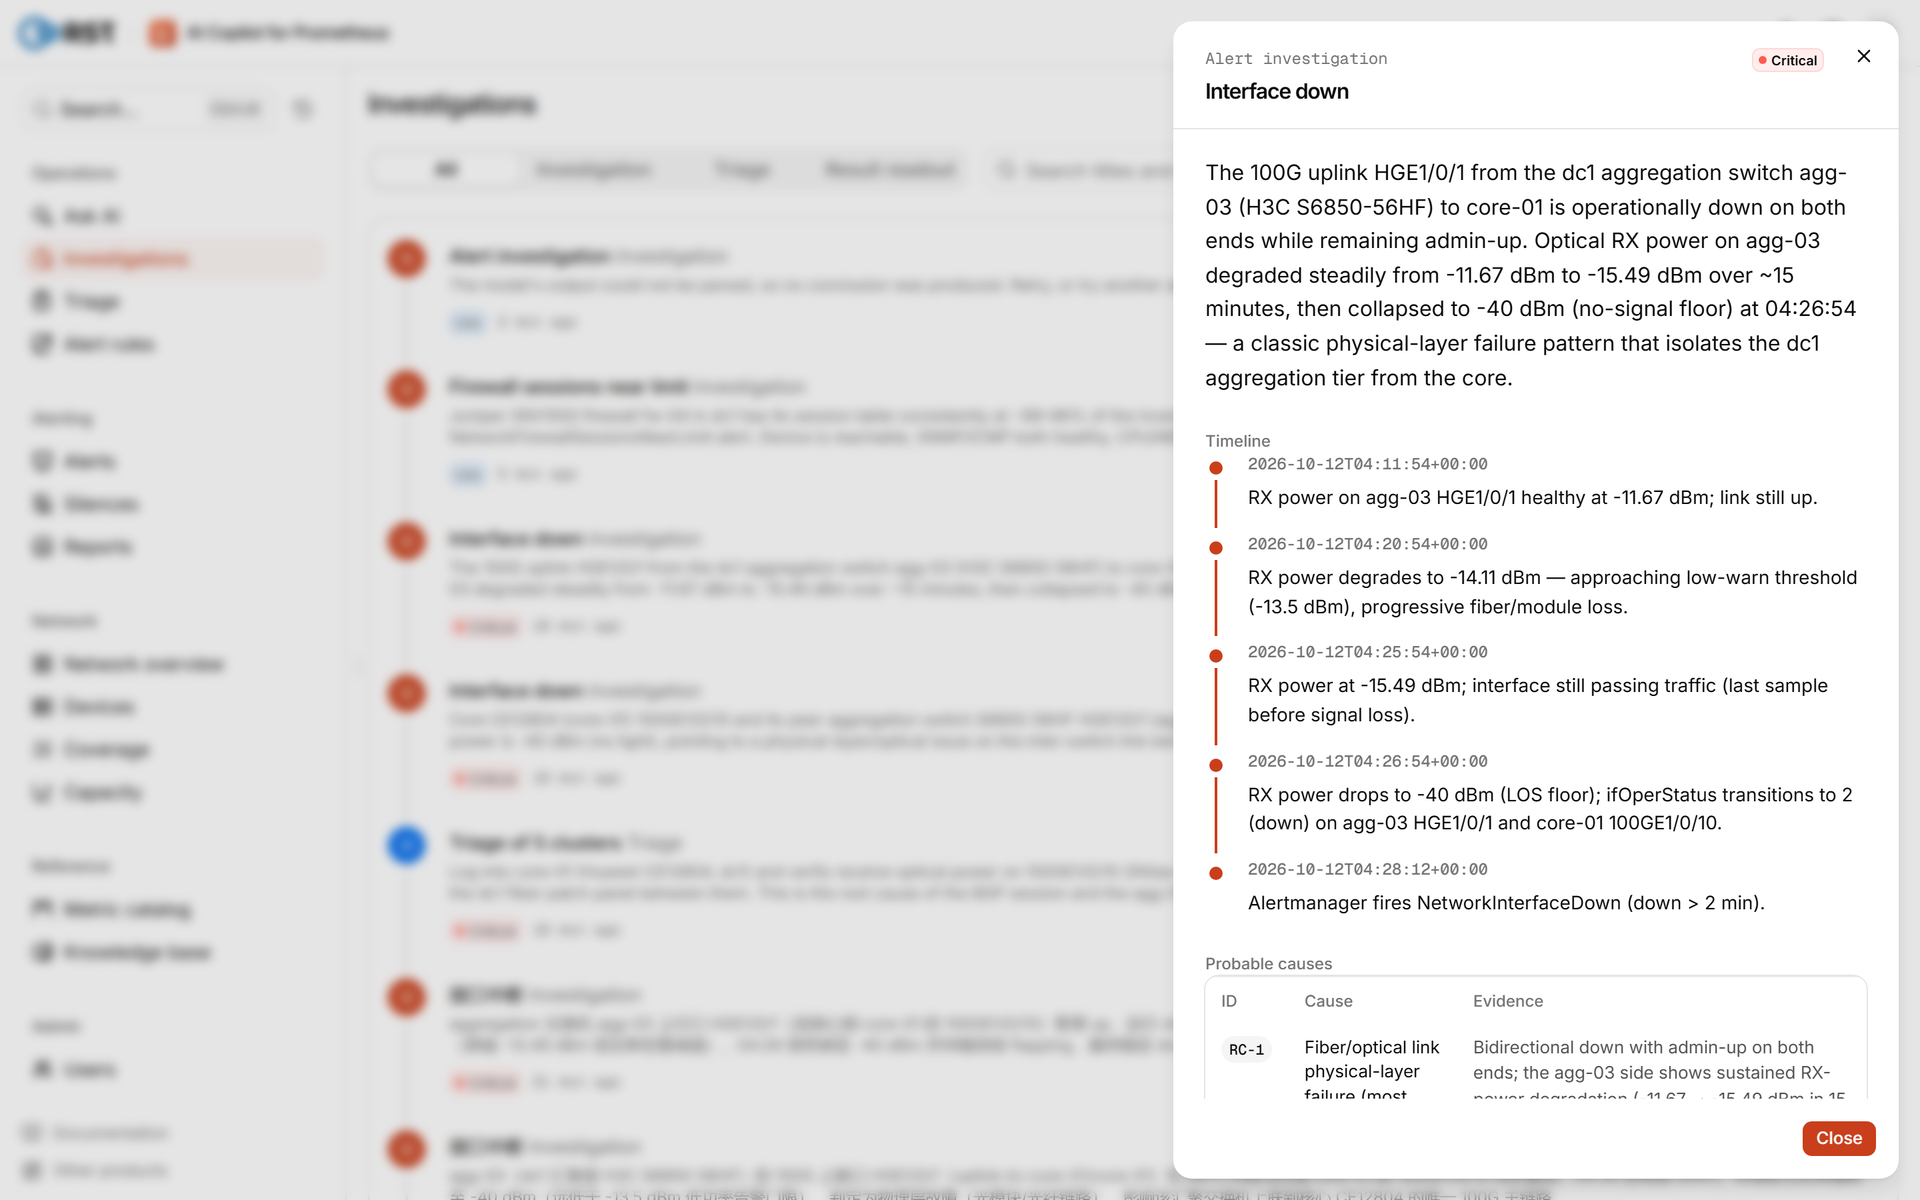
Conclusion (high confidence, not a false positive):
- Summary: HGE1/0/1 is operationally down on both ends while admin-up. agg-03 receive power fell from -11.67 to -15.49 dBm over about 15 minutes, then collapsed to -40 dBm at 04:26:54 UTC (12:26:54 local), "a classic physical-layer failure pattern".
- Probable causes: RC-1 fibre or optical link failure (most likely: dirty or damaged connector, fibre break or bend, pulled patch cable); RC-2 failed QSFP28 on either end; RC-3 port or optic event on core-01.
- Recommended actions: check the physical layer on both ends; reseat or replace the QSFP28 on agg-03 first, then on core-01; run transceiver diagnostics on the H3C.
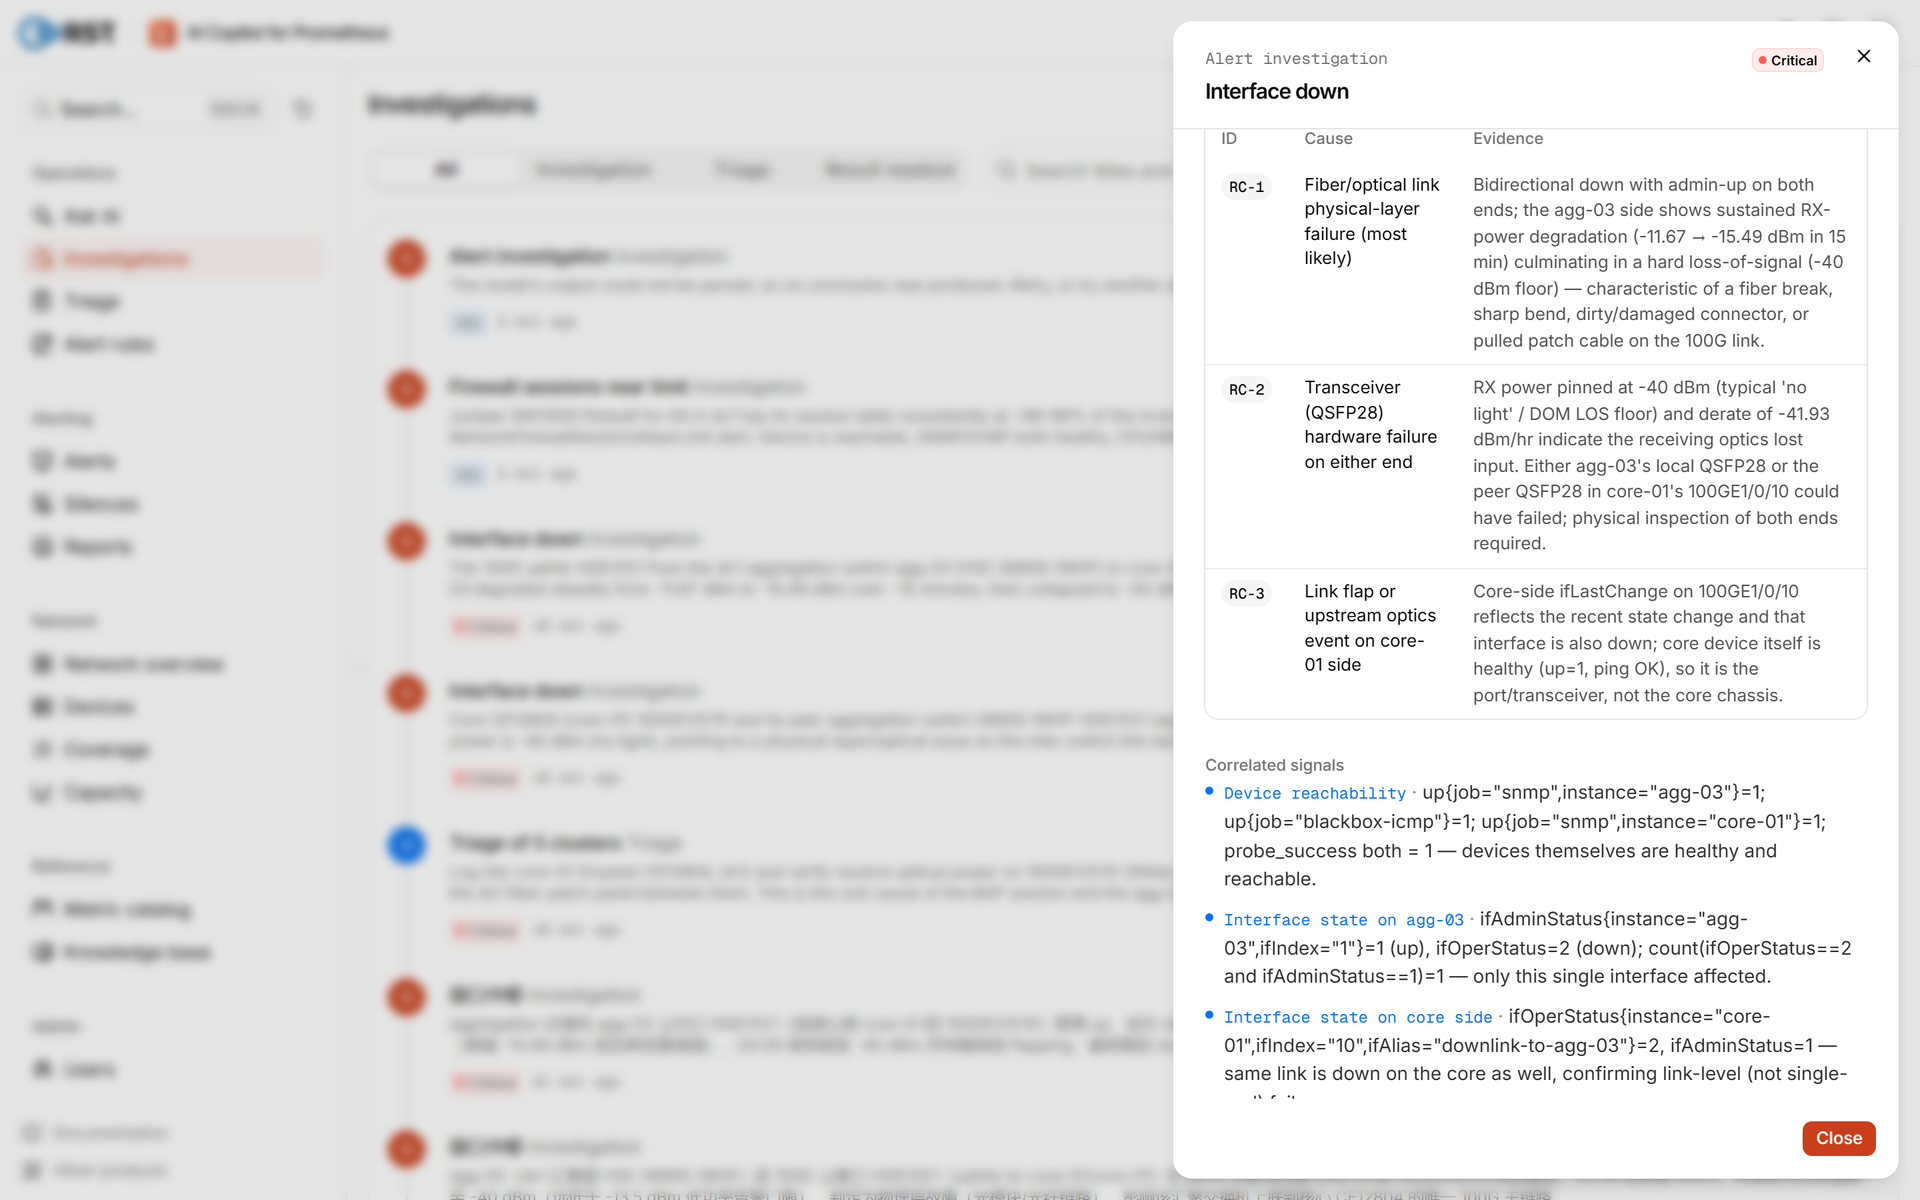
The report ends with every executed PromQL query and its series count, so each claim can be traced:
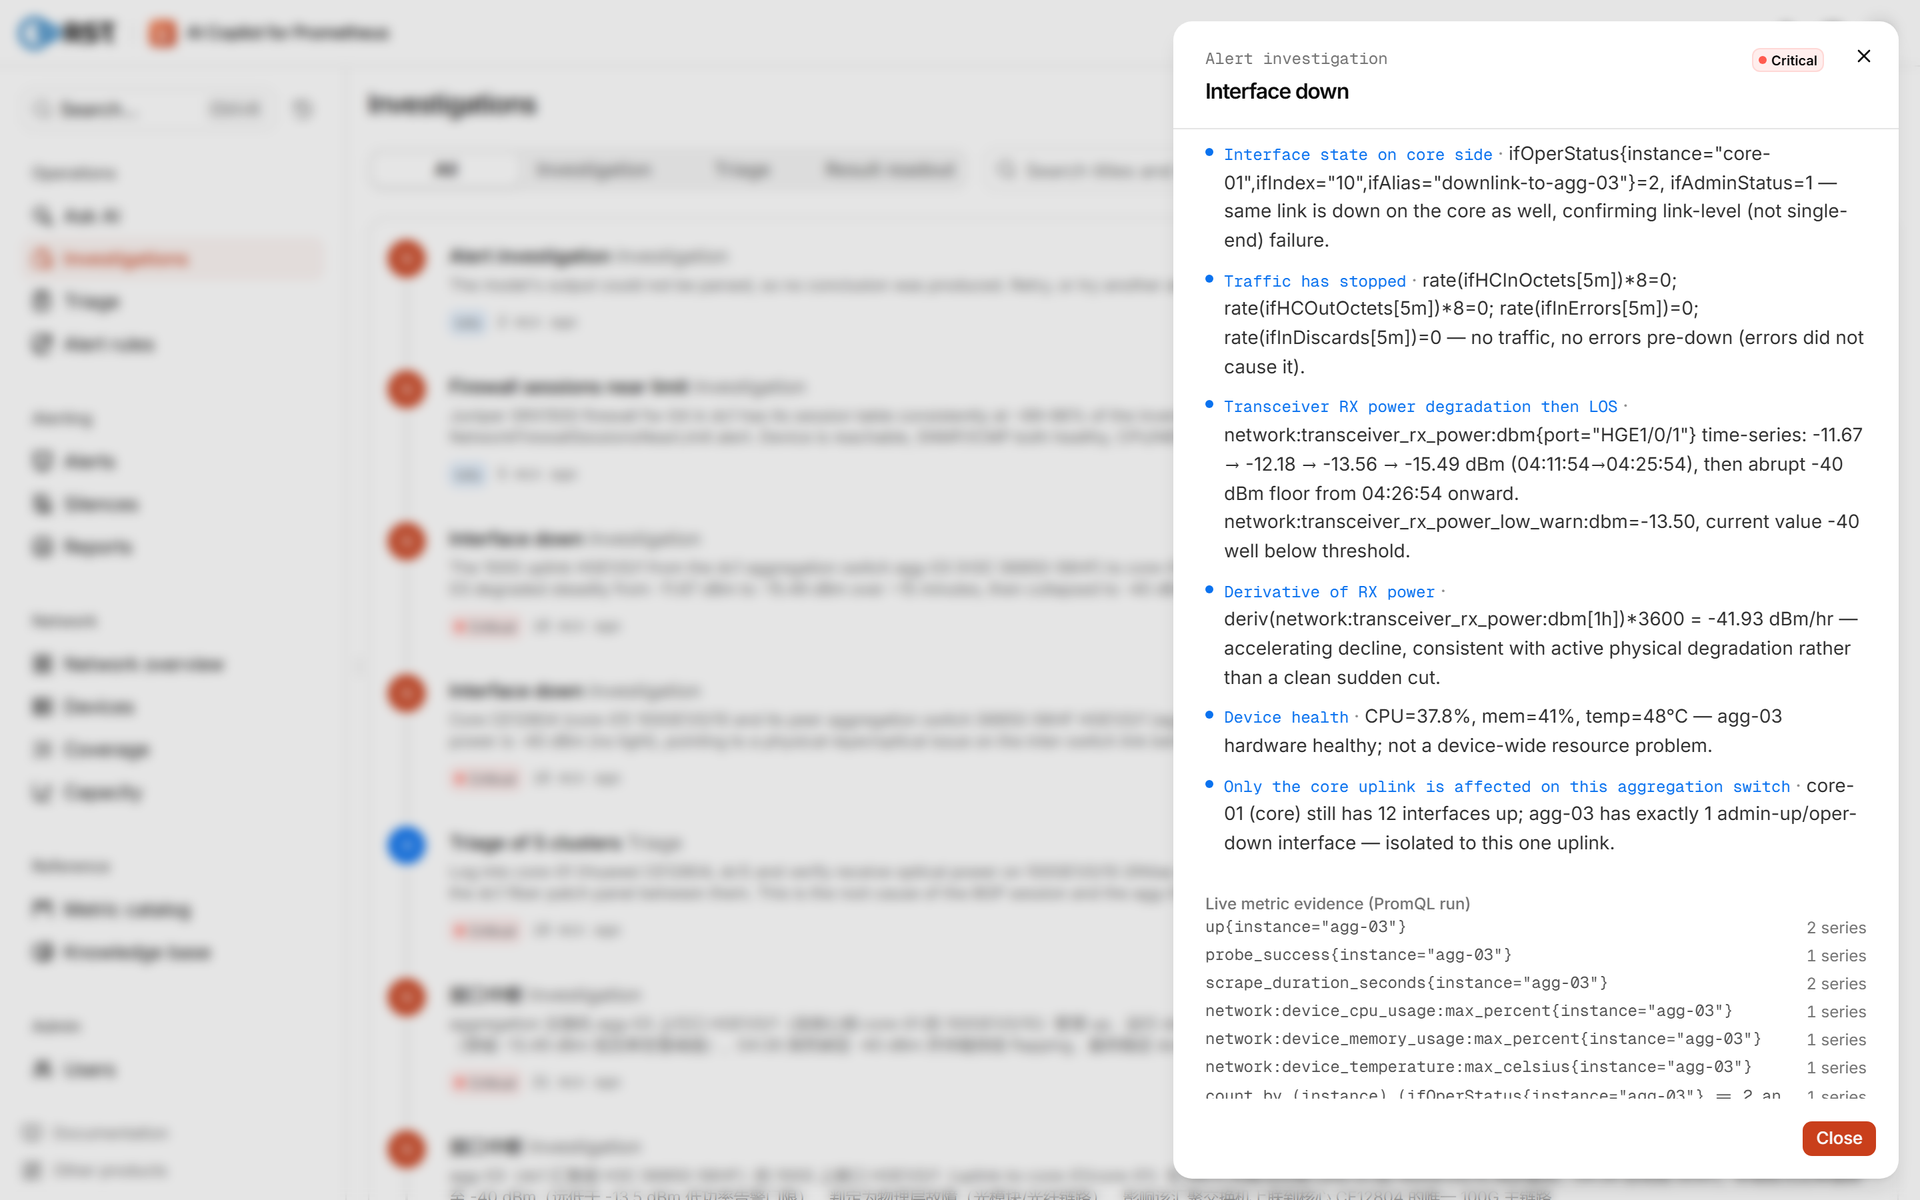
The model separated the slow decline from the final loss of light rather than reporting a single slope. The start of the decline at -2.4 dBm lies outside the 30-minute pre-fetch window; Ask AI below shows the full curve. When assessing impact, note that agg-03 still has its uplink to core-02, which carried the detoured traffic.
The core-01 end: 22 seconds, far end checked
core-01 is a Huawei switch with no optic readings in this environment, so the pre-fetched optic queries were empty. The model ran 7 valid queries. After checking core-01's ports it queried network:transceiver_rx_power:dbm{instance="agg-03", port="HGE1/0/1"} on its own and read -40 dBm. Its conclusion: both ends down after a flapping phase, "the agg-03 side RX power is -40 dBm (no light), pointing to a physical-layer/optical issue on the inter-switch link", with an optical or fibre fault as the top cause.
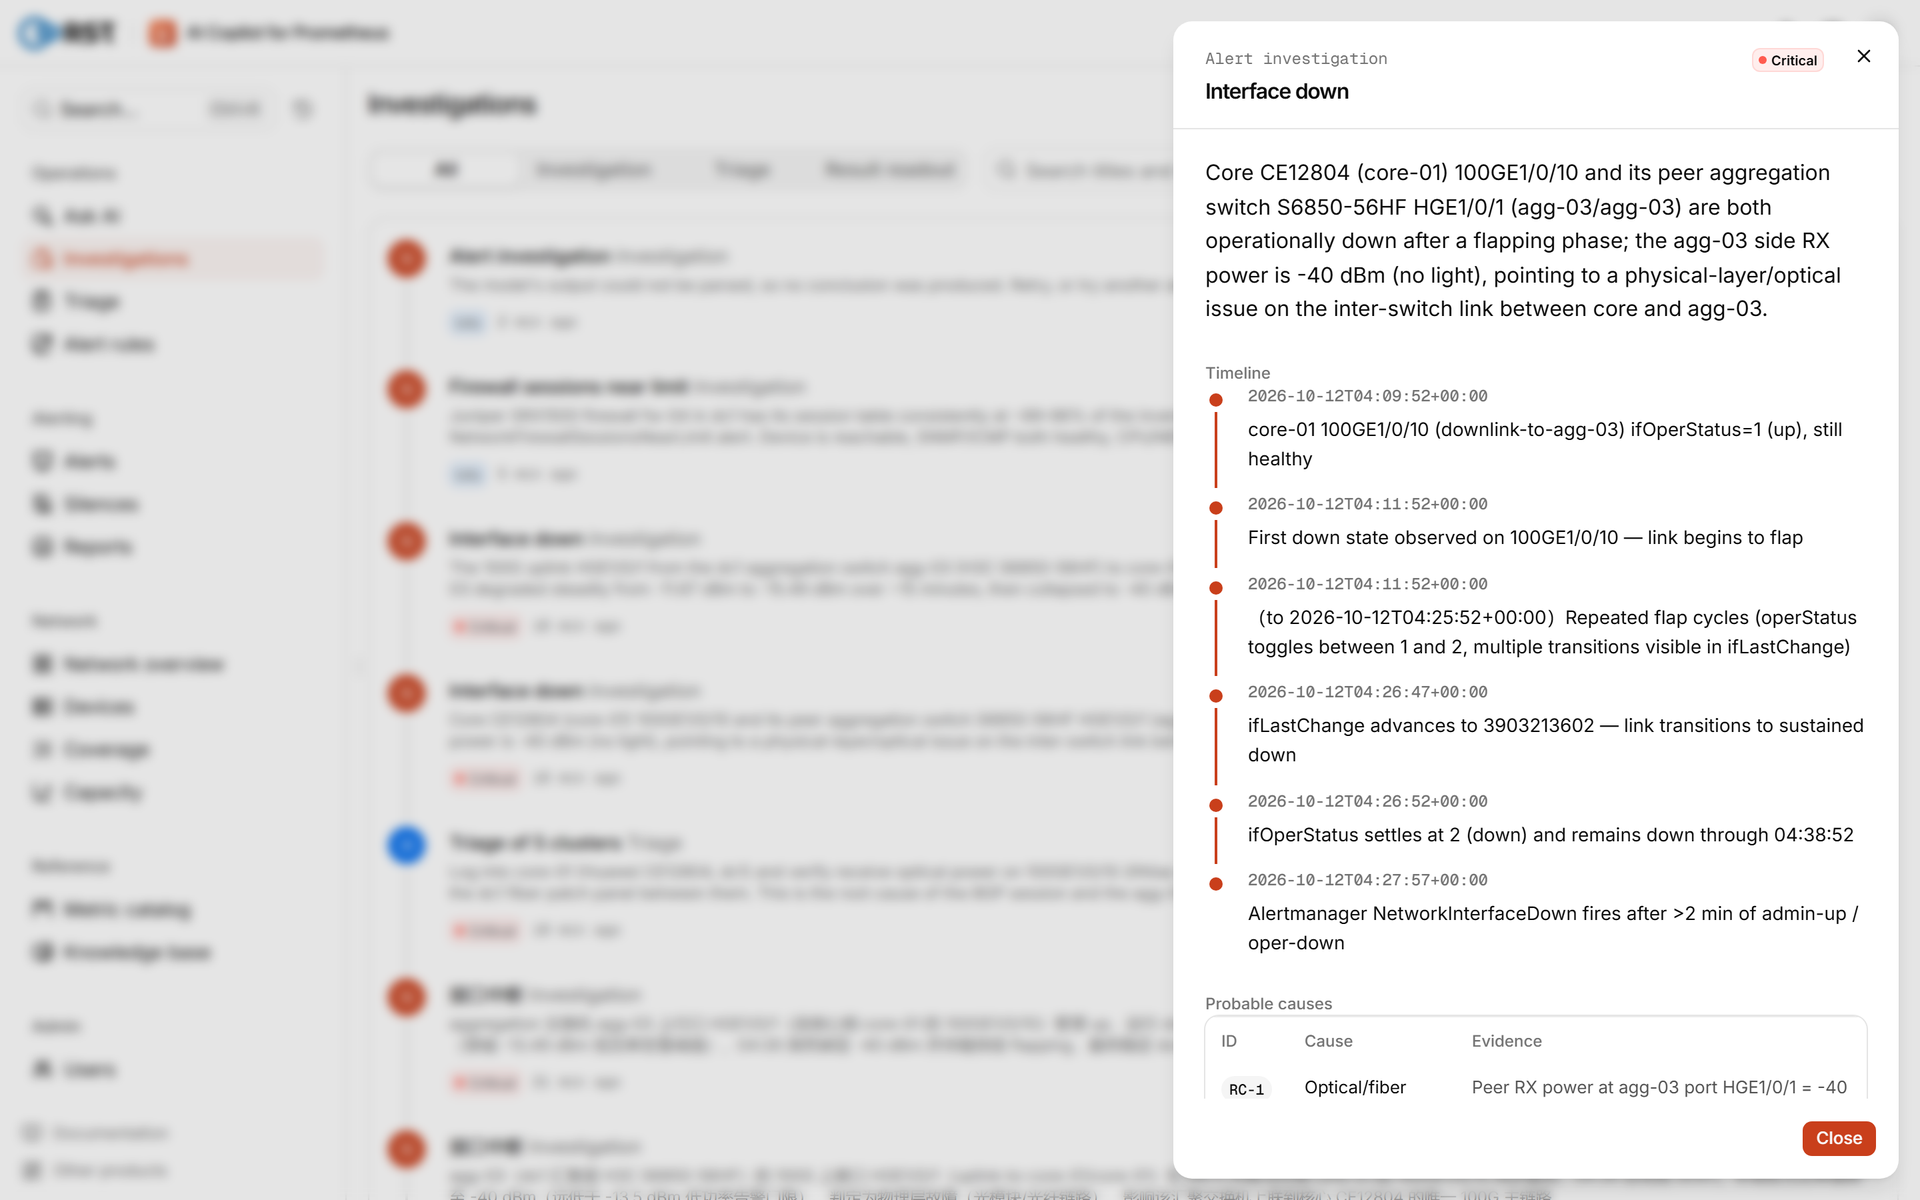
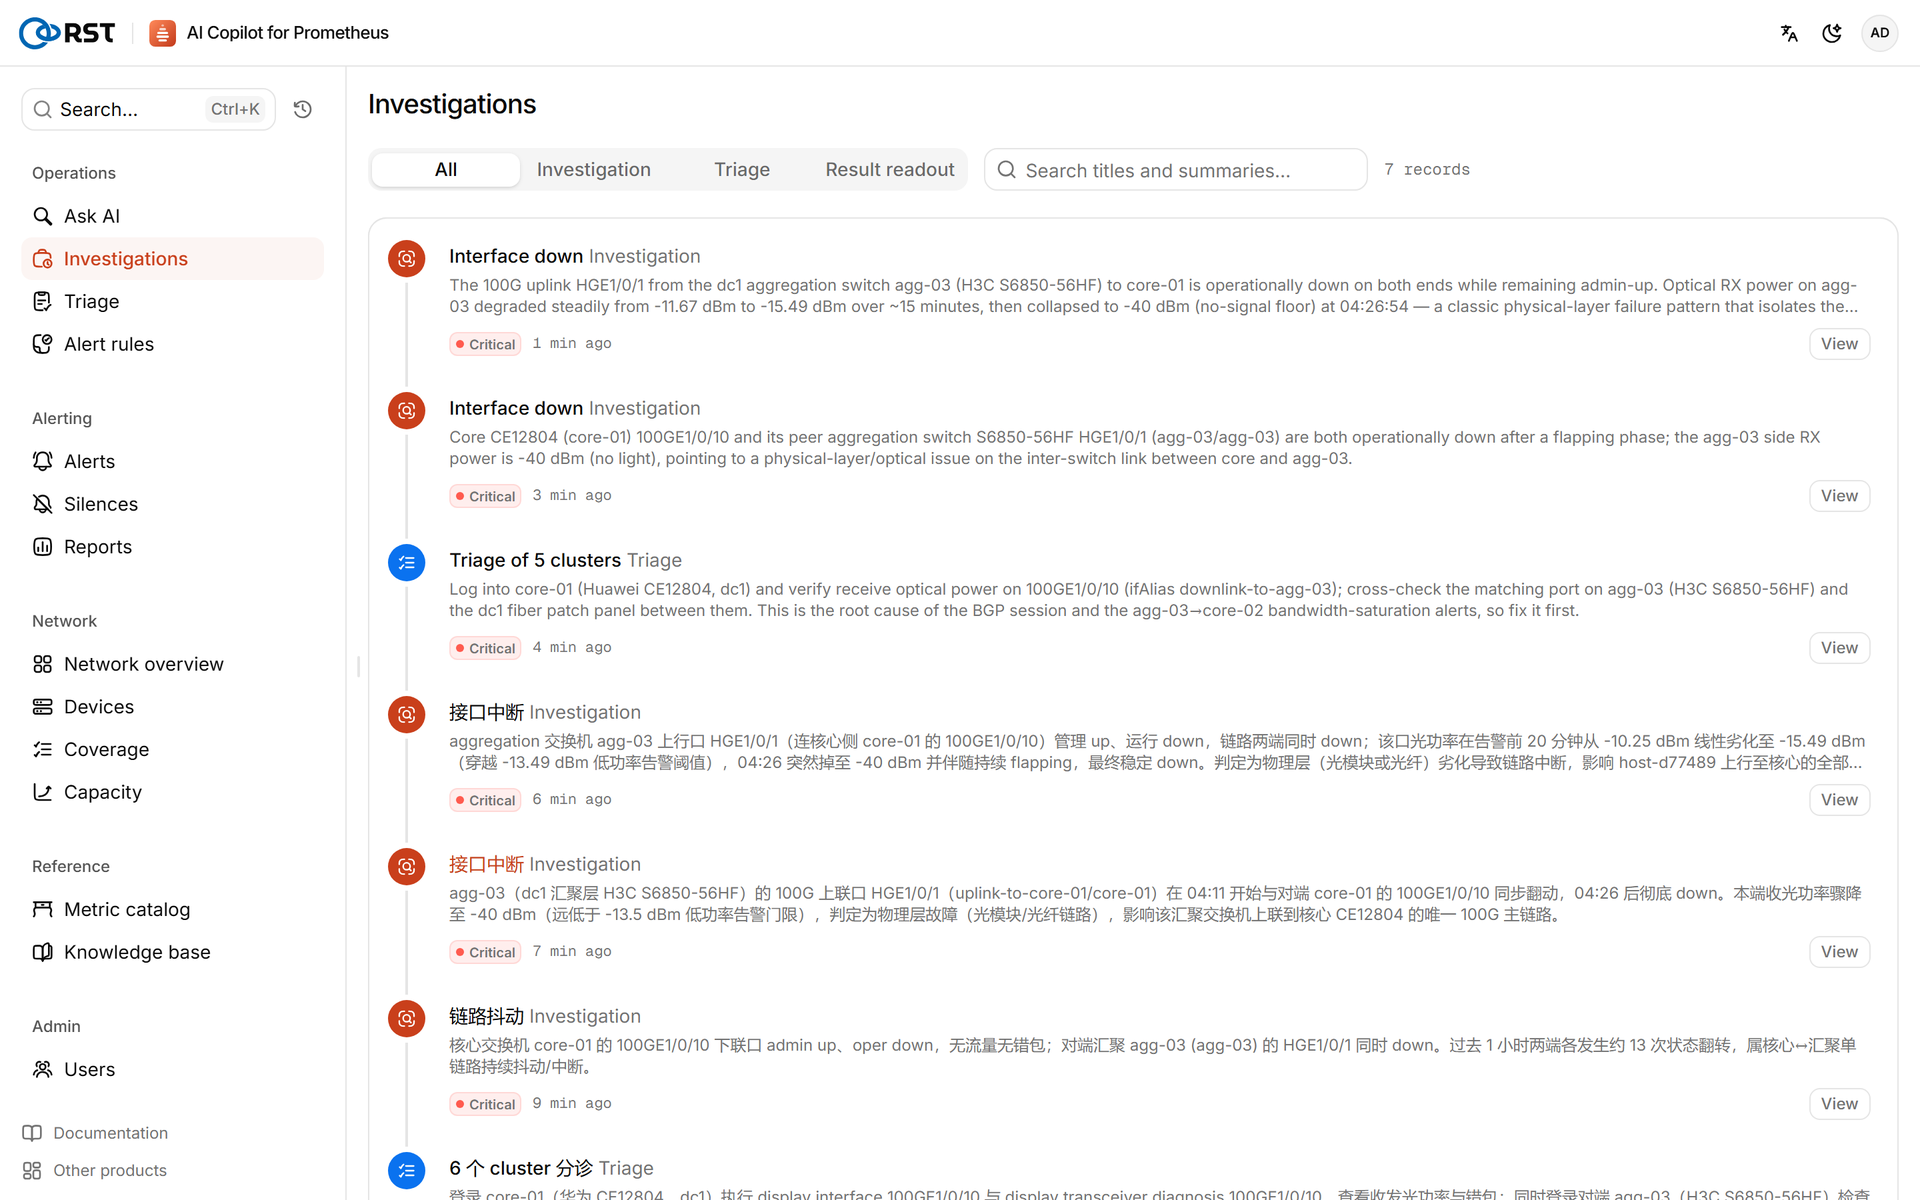
In the Chinese-UI pass, the core-01 investigation concluded "physical-layer fault, check the optics", and the agg-03 investigation supplied the -40 dBm reading. In practice, investigating both ends of a link lets the two conclusions confirm each other.
Ask AI: the 40 minutes without an alert
The investigation shows the current state: no light. To see when degradation began, ask Ask AI: "How has receive optical power changed on each agg-03 port over the last hour?" In 9.5 seconds the product generated network:transceiver_rx_power:dbm{instance="agg-03"} and plotted it: HGE1/0/1 declines from the start of the window and drops to -40 around 12:26; the other three ports stay flat.
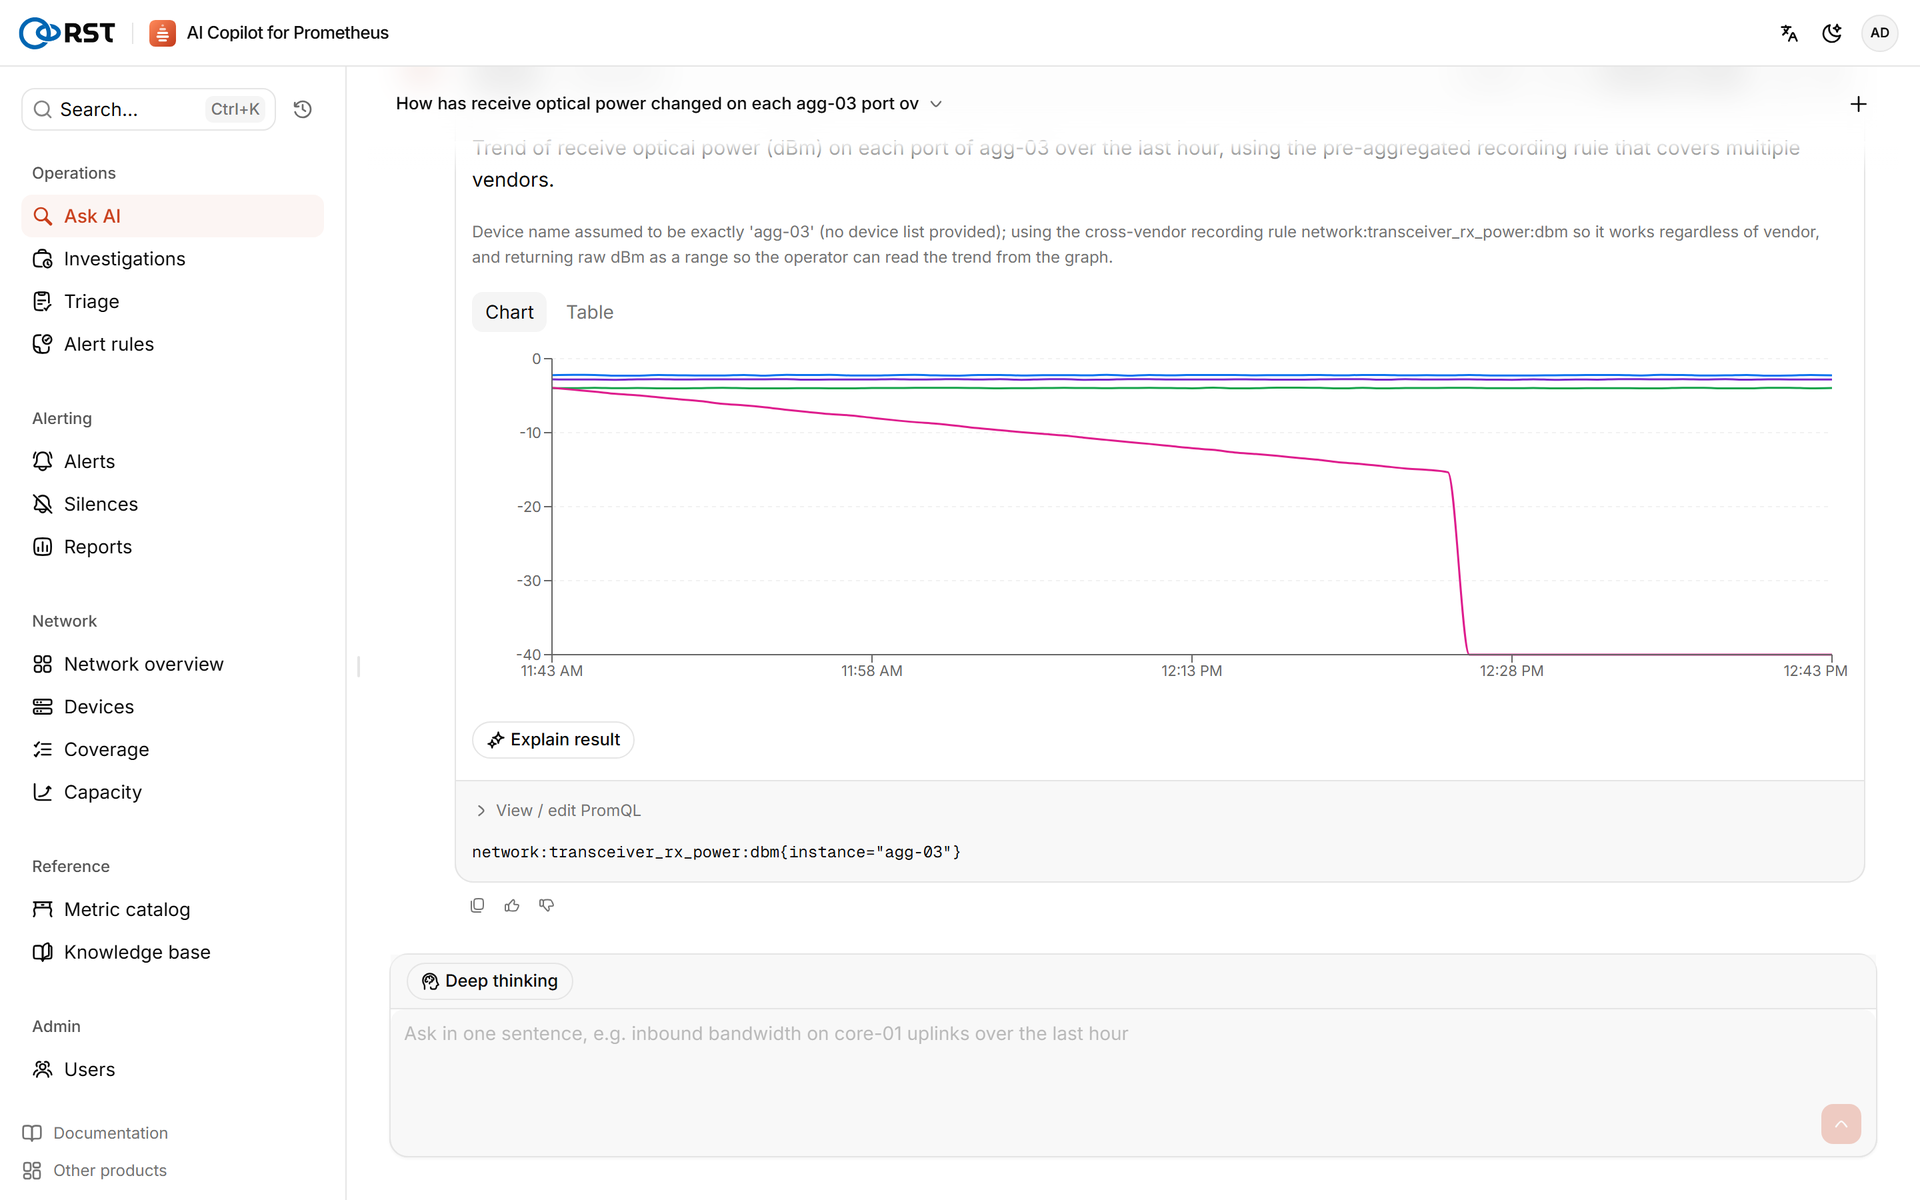
This is the unalerted decline in the first row of the timeline table, retrieved without knowing the metric name or writing the instance and port labels.
All triage runs and investigations are saved for review. The investigation report screenshots in this paper were taken from these saved analyses.
5. Guardrails
A model that writes its own PromQL must be kept from over-querying, reaching data it shouldn't, or leaking internal details. This investigation ran under the following controls:
- Read-only and validated: each query is validated by Prometheus, then executed through the query API only (
/api/v1/query,query_range); no write endpoint is used. A metric allowlist can be configured. The product writes in two places only: Alertmanager silences created by an engineer, and, after approval, the rule file it manages (with rollback). In this run one malformed query was rejected and corrected in the next round (section 4). - Result cap and masking: at most 20 series per query reach the model. Hostnames, IPs and similar labels are replaced with placeholders before entering the prompt and restored in the conclusion. Queries that filter on a masked IP are refused.
- Budgets: at most 4 model rounds and 120 seconds per investigation, with an optional token budget. On overrun the result is returned and marked as degraded. Both ends here finished within a minute, without degradation.
- Evidence: the report lists every executed query and its series count, and each probable cause states its evidence. An engineer can check each conclusion against it.
6. Value and conclusion
Most of the labour in network operations comes after the alert: reading a screen of alerts, working out which belong together, and investigating each one. That work is slow, varies by engineer, and depends on senior staff.
Faster: ranking 14 alerts with recommended actions took 31 seconds; tracing interface down to "the optic sees no light" took 39 seconds.
Repeatable and auditable: the pre-fetch (port state, traffic and errors, optic power and slope, BGP peer) runs on every investigation, and every query and result is saved.
Lower expertise barrier: "for interface down, check optic power, then the far end, then the slope" used to be a senior engineer's habit. A first-line engineer now gets those results from one click, and the trend from one plain-language question.
| Step | Manual | RST AI Copilot for Prometheus |
|---|---|---|
| Prioritise | Alertmanager doesn't rank; open alerts one by one | 5 ranked clusters in 31 seconds, derived alerts marked |
| Correlate | Match devices and times across BGP, bandwidth and interface alerts by hand | Both ends of a link clustered, cause and effect stated |
| Root cause | A dozen hand-written PromQL queries over ports, optics and the far end | Pre-fetch plus autonomous retrieval, -40 dBm found in 39 seconds |
| Trend | Know the metric names and labels, write deriv | One question, curve in 9.5 seconds |
| Data safety | — | Read-only queries, validation, result cap, label masking |
In this run, Prometheus and Alertmanager raised every alert they could. RST AI Copilot for Prometheus ranked 14 alerts and identified the derived ones in 31 seconds, traced the top interface-down alert to "agg-03 HGE1/0/1 receive power -40 dBm, optic or fibre fault" in 39 seconds, and recovered the 40-minute decline from a single question.
Every conclusion carries the queries that were actually run and what they returned, so an engineer can check it against the evidence before acting. The product does not remediate; replacing an optic or moving traffic remains a human decision. Prometheus raises the alert, RST AI Copilot for Prometheus explains it, people decide.