

Product evaluation··Sevion Xia
RST AI Copilot for Elastic: a hands-on evaluation
A phishing invoice, one Kerberoast and a DCSync domain takeover run entirely on legitimate credentials: how Elastic Security and RST AI Copilot for Elastic turn 9 isolated alerts back into one attack.

Version v1.0 · 2026-10 · Test environment: Elasticsearch + Kibana 8.15.3 (trial license, Security detection engine)

Summary
An attacker walks into the network with a single phishing invoice and never touches another exploit. The whole intrusion runs on legitimate credentials: grab a domain account from one workstation, Kerberoast a service account password out of the DC, use it to run DCSync on the domain controller and walk off with every hash in the domain (krbtgt included), stand up a backdoor Domain Admin, and clear the DC's security log on the way out. This kind of living-off-identity attack is among the hardest things a SOC has to see clearly today.
Elastic Security faithfully detected the parts it could reach. Using rule logic consistent with Elastic's official detection-rules, it produced 9 alerts over the night: 5 RC4 Kerberos tickets (high), 2 DCSync (critical), 1 encoded PowerShell (high), 1 log clear (high). But when those 9 land in front of an analyst, they are alerts across four different rules, different subjects, different MITRE tactics, and they look like several isolated events. Which to look at first, whether any are false positives, and whether they are in fact one attack: all of that is left for a human to dig out.
We replayed this intrusion on a real Elastic 8.15 (the Windows security events are synthetic telemetry, with fields matched verbatim to Elastic's official detection-rules so the rules genuinely fire), then handed RST AI Copilot for Elastic the work that comes after Elastic's detection:
- Triage: cluster, rate, rank, and recommend actions for all 9 alerts, end to end in 7.8 seconds, 4 clusters, priorities 2 critical, 1 high, 1 medium, none misjudged as a false positive. It pushed the largest, noisiest cluster, the 5 Kerberoasting alerts, to the bottom of the queue and ranked the 2 DCSync alerts first, ordered by attack intent rather than alert count.
- Investigation: launch an autonomous investigation on a single high alert, the unassuming "Macro-based initial access." The model writes its own read-only ES query and, in one agentic retrieval round, under a minute, 13 pieces of evidence, reconstructs the whole cross-host chain
phishing macro → encoded PowerShell → Kerberoasting → DCSync → backdoor Domain Admin → robocopy exfil of finance files, walking by identity from the foothold WS-FIN-07 to the domain controller and on to the backdoor account, and escalating that high alert to a critical domain compromise, with a timeline, MITRE ATT&CK mapping, affected assets, and graded remediation. - Guardrails: a false-positive verdict only stands with counter-evidence; any entity that appears in the conclusion but cannot be found verbatim in the evidence rows is flagged as unverified; access to Elastic is read-only with an index whitelist, and outbound content is masked by mode.
Elastic detects; the Copilot explains, inside a minute, whether these seemingly unrelated alerts are the same attack and what actually happened, including the large half of the context a detection rule will never stitch together for you.
Product at a glance
RST AI Copilot for Elastic is an AI security-operations assistant that sits on top of Elasticsearch + Kibana. Through a single Docker gateway it connects to your existing Elastic read-only: polling .alerts-security to ingest detection alerts, running index-whitelisted read-only searches over logs-*, and gathering the triage, investigation, and rule work an analyst does after detection into one UI. No agent to install, no changes to your rules, no automated response.
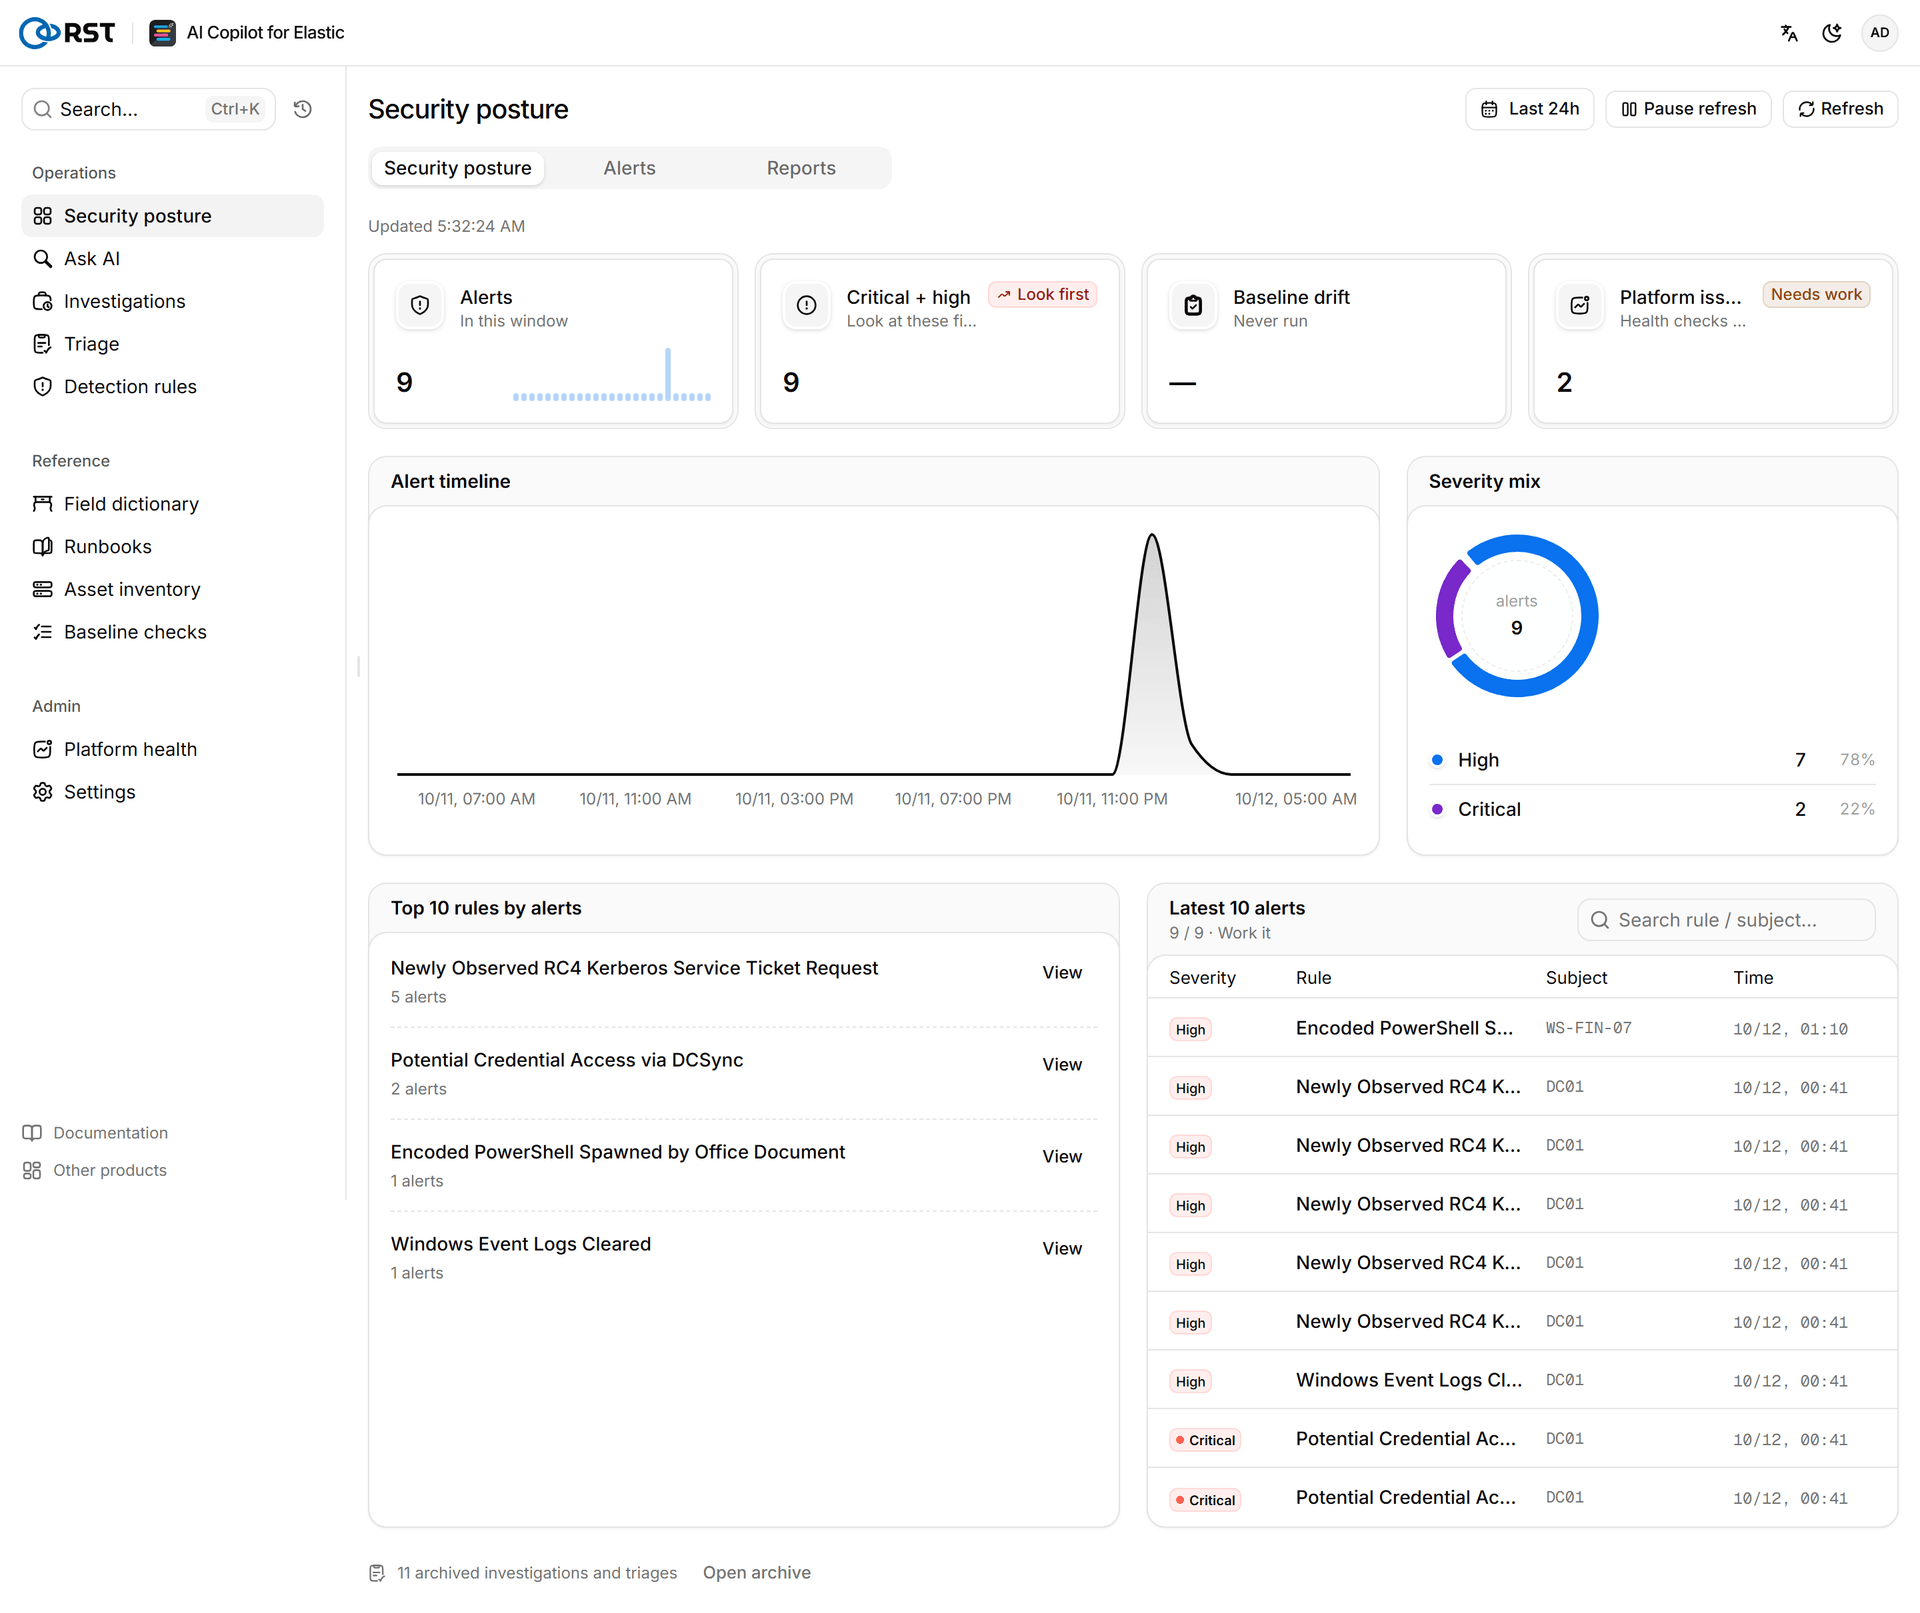
After login, one screen shows current alert volume, severity distribution, the alert timeline, and the noisiest rules and latest alerts.
Smart Query is the analyst's most-used entry point: say what you want to see in a sentence, and the Copilot returns the ES query together with the results.
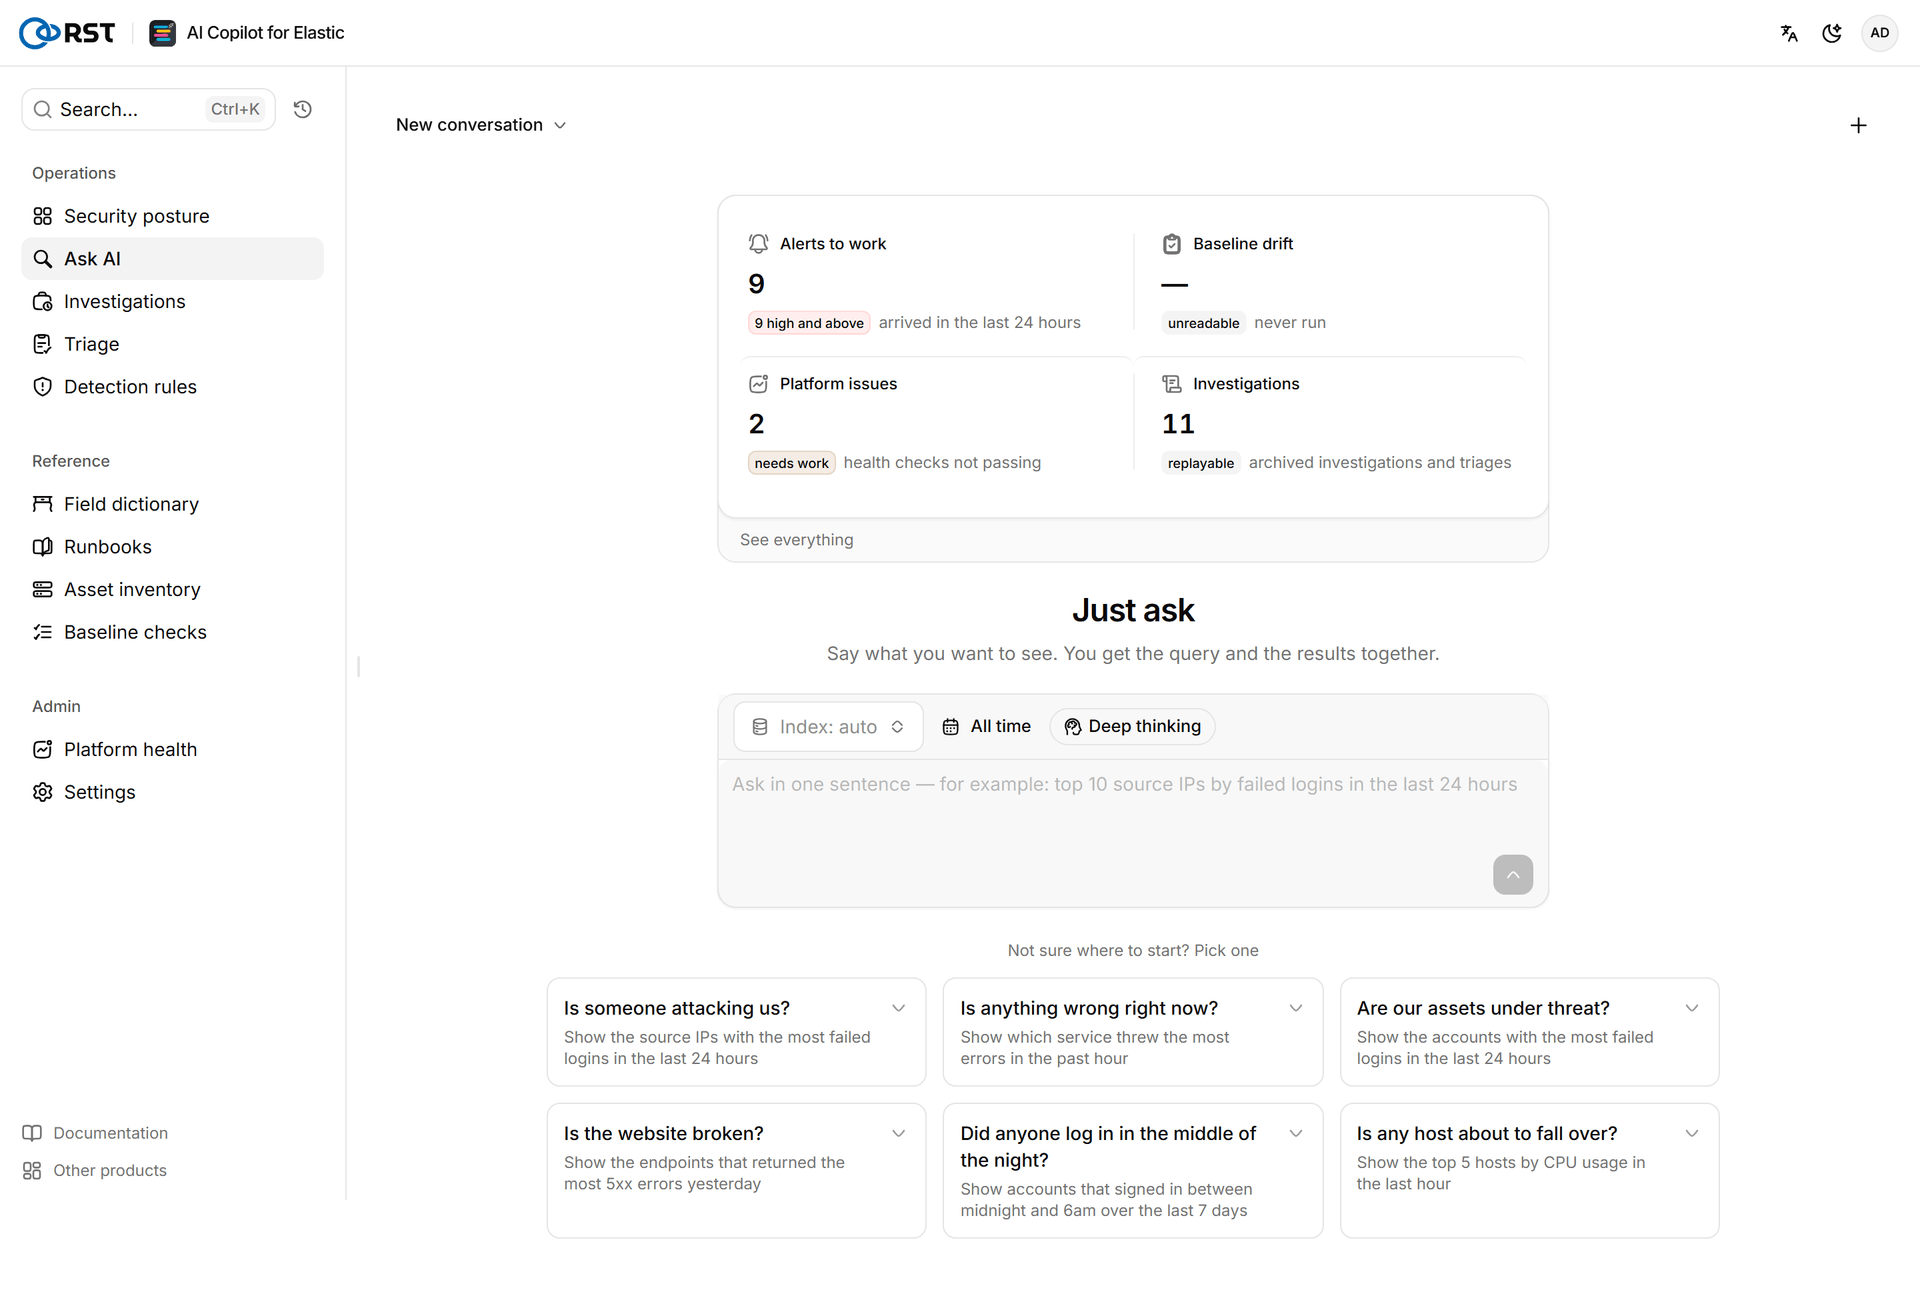
The sections below use one real intrusion to show how far the triage and investigation behind this UI can go.
1. Prologue
One afternoon, Finance's j.chen receives an overdue-invoice email and opens the macro-laden .docm on workstation WS-FIN-07. Word launches an encoded PowerShell, the attacker's foothold.
Over the next two hours the attacker never touches another exploit, living entirely off identity: using the domain account j.chen on this machine, they bulk-request Kerberos tickets for service accounts from the DC (Kerberoasting, cherry-picking weak RC4 encryption), crack the tickets offline, and recover the password for service account svc_sql; they use it to log into file server FILE01 and app server APP01; back on domain controller DC01 they run DCSync, impersonating a DC to abuse directory replication rights and walk off with every hash in the domain, krbtgt included; they create an account named svc_health and drop it into Domain Admins, log back in remotely from an overseas C2 to read the Finance share, and clear DC01's security event log on the way out.
Elastic was watching the whole time. Using rule logic consistent with the official detection-rules, it denoised this flood of events, and by the next morning the Kibana Alerts page held 9 alerts:
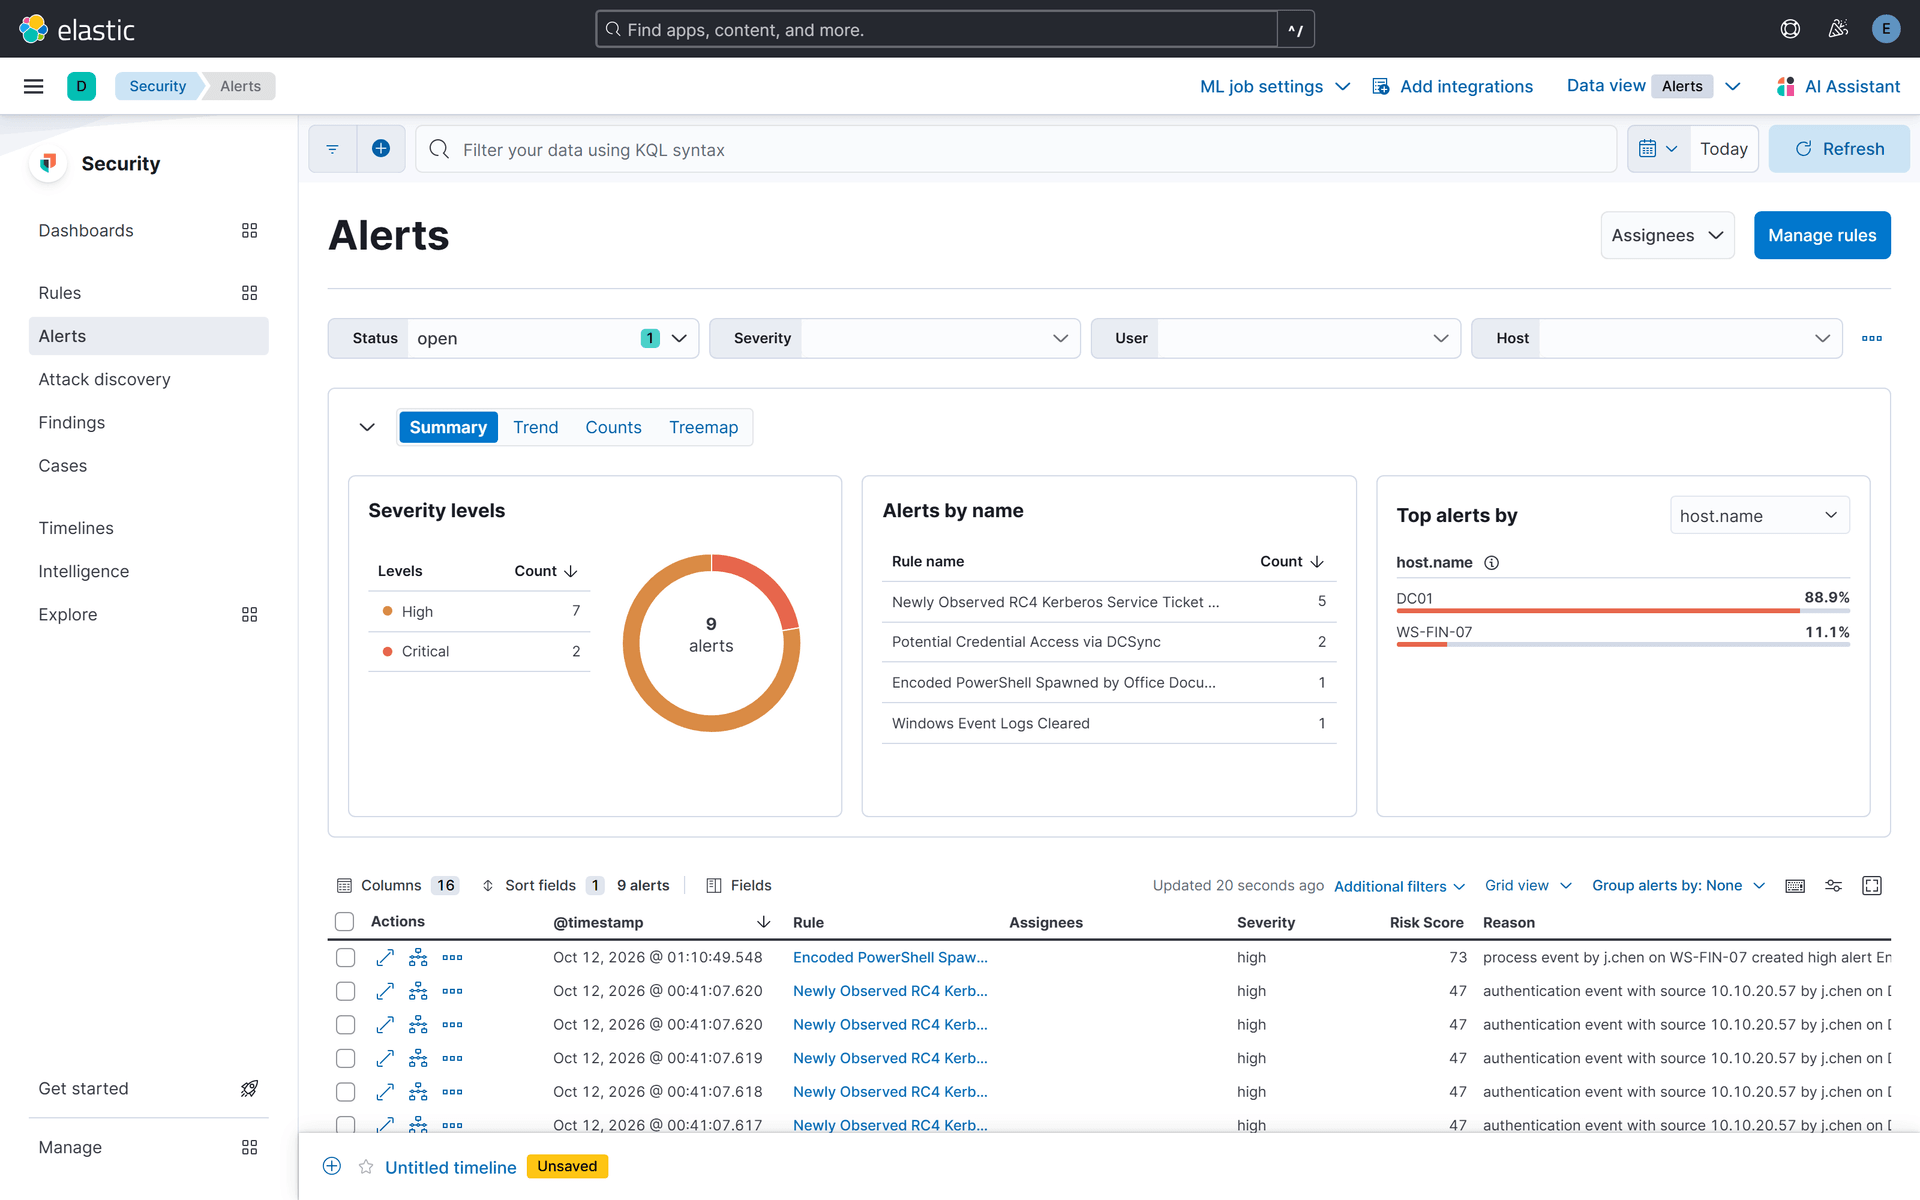
This is the screen the analyst opens in the morning. The denoising is done, but the time-consuming half is only just beginning:
- Which first? 5 of the 9 are the same RC4 Kerberos ticket (high), the largest group, yet that is the earliest, least lethal step of the chain; the 2 truly dangerous DCSync alerts (critical) are buried among them.
- Same attack? The 9 belong to four rules and three subjects (
DC01,WS-FIN-07, source IP10.10.20.57) and span credential access, execution, and anti-forensics tactics. One chain, or several unrelated events? The rules will not tell you. - What actually happened? A single encoded PowerShell high alert could be some ops script, or the opening move of a domain takeover. To decide, you hand-write a stack of ES queries and walk them down by host, by account, by time window.
That second half is exactly RST AI Copilot for Elastic's arena: not to replace Elastic's detection, but to take over the triage and investigation that come after.
2. Dual-track replay
The clearest way to read this intrusion is as two parallel tracks: on the left, each step the attacker took; on the right, what that step left (or did not) in Elastic, and what the Copilot ultimately filled in.

| Stage | Attacker action (MITRE) | Elastic native detection | Context the Copilot filled in |
|---|---|---|---|
| 1 Initial access | j.chen opens the macro doc; WINWORD launches powershell -enc (T1566/T1059) | Alert: encoded PowerShell (high) | Investigation pulls the full process chain and download string off WS-FIN-07 |
| 2 Credential theft | bulk RC4 service-ticket requests against DC01 (Kerberoasting, T1558.003) | Alert: RC4 Kerberos ticket ×5 (high) | Triage identifies it as a Kerberoasting precursor; investigation links it to tooling on the foothold |
| 3 Offline cracking | svc_sql hash cracked offline | No telemetry | Investigation infers it as the credential-cracking step from the chain |
| 4 Lateral movement | svc_sql logs into FILE01/APP01 (T1021) | No alert (looks like a legitimate logon) | Cross-host evidence; investigation traces it back by service account |
| 5 Credential access | DCSync on DC01 replicating the domain + krbtgt (T1003.006) | Alert: DCSync ×2 (critical) | Triage raises to critical, ranks first; investigation confirms it via cross-host identity pivot |
| 6 Persistence | create svc_health, add to Domain Admins (T1136.002/T1098) | No alert | Investigation folds it into the chain (backdoor Domain Admin) |
| 7 Exfiltration | backdoor account logs in from C2, reads Finance (T1048) | No alert | Cross-host evidence; investigation marks it as the exfil path |
| 8 Anti-forensics | clear DC01 security log (T1070.001) | Alert: log clear (high) | Triage breaks it out as an anti-forensics cluster, linked to DCSync |
Two kinds of rows in this table matter most. One is the rows with no native alert: offline cracking, lateral movement, persistence, exfiltration, the living-off-legitimate-identity steps that generate no alert of their own (the dashed stages in the attack-chain diagram). They sit in the index only as raw events, visible only if someone pulls them out. The other is subtler: the rows that do have alerts do not connect to each other. Elastic gave you 4 kinds of alerts but never told you they are the same j.chen, the same chain. That is precisely the gap between detection and comprehension.
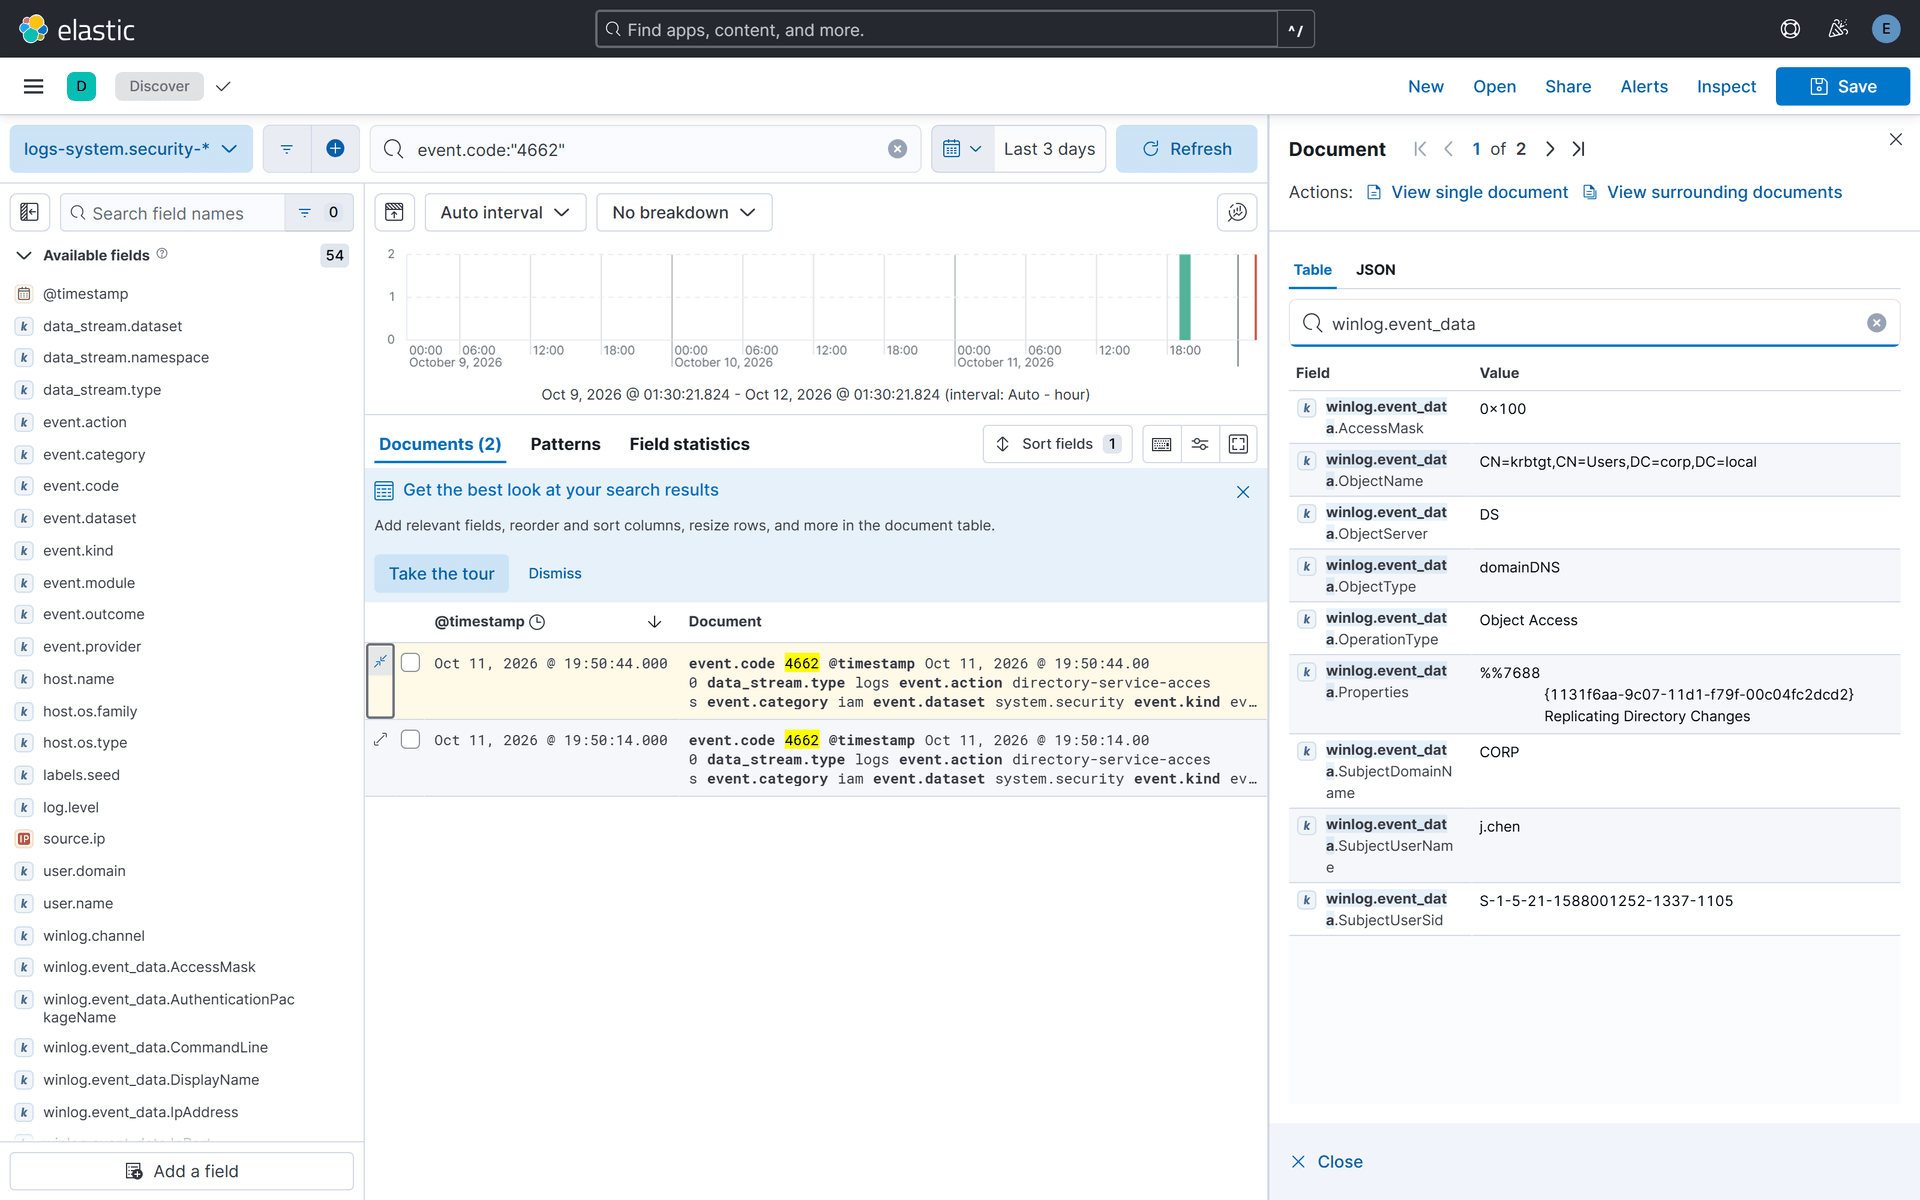
The detection rules behind these alerts are built on Elastic's official detection-rules logic (DCSync matches event.code:4662 plus the replication-rights GUID plus AccessMask:0x100; RC4 tickets match 4769 plus TicketEncryptionType:0x17; log clear matches 1102):
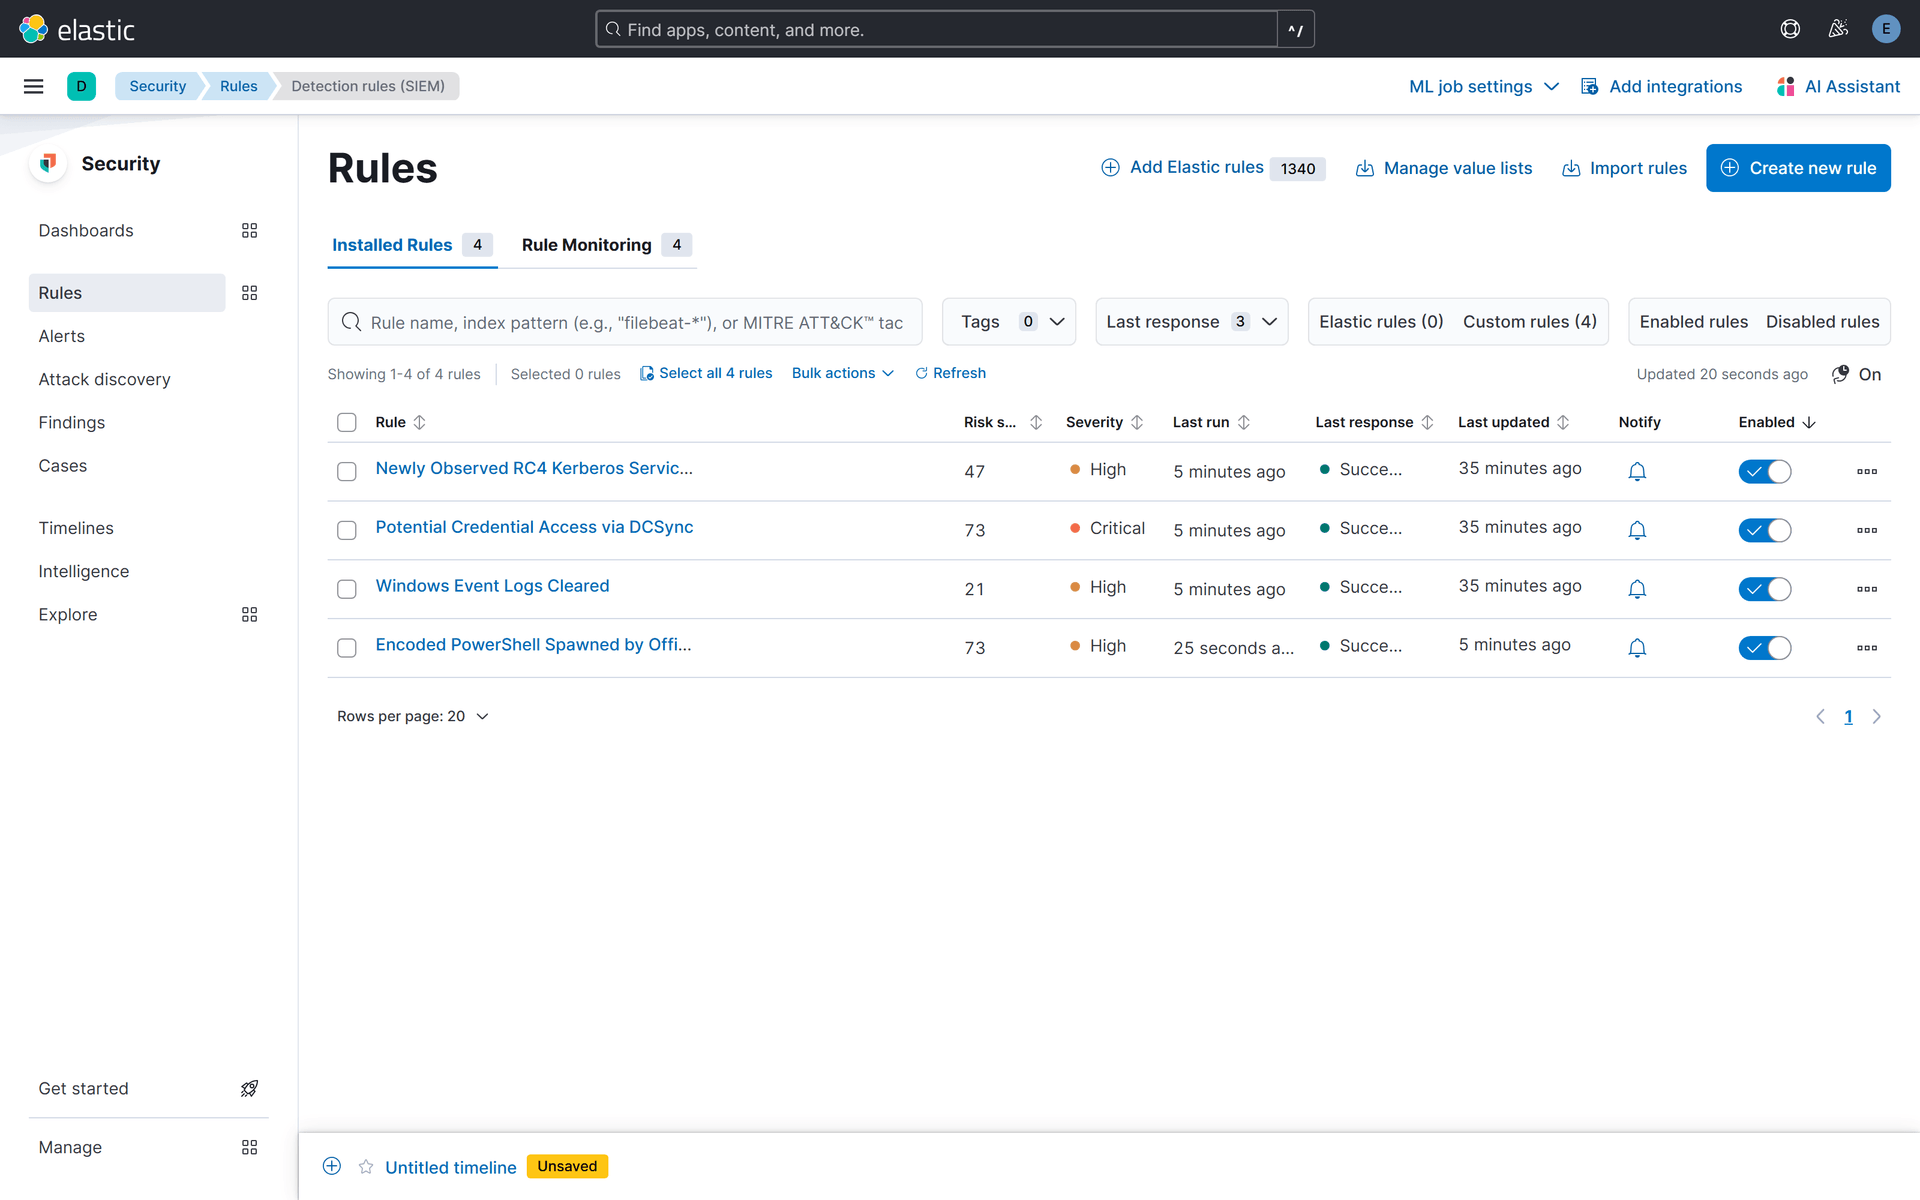
The raw evidence for the attack sits in logs-system.security-*. Below is a 4662 event in Discover, j.chen requesting Replicating Directory Changes against a domain object (replication GUID 1131f6aa-…, AccessMask 0x100), the smoking gun of DCSync, and exactly what you have to expand the raw event to read behind the rule name "Potential Credential Access via DCSync":
Open that DCSync alert and Kibana gives you the rule name plus MITRE mapping, accurate, but the story behind it is still yours to dig out: where did the credentials for this DCSync come from? Who ran it, from which machine? And what did they do afterward?
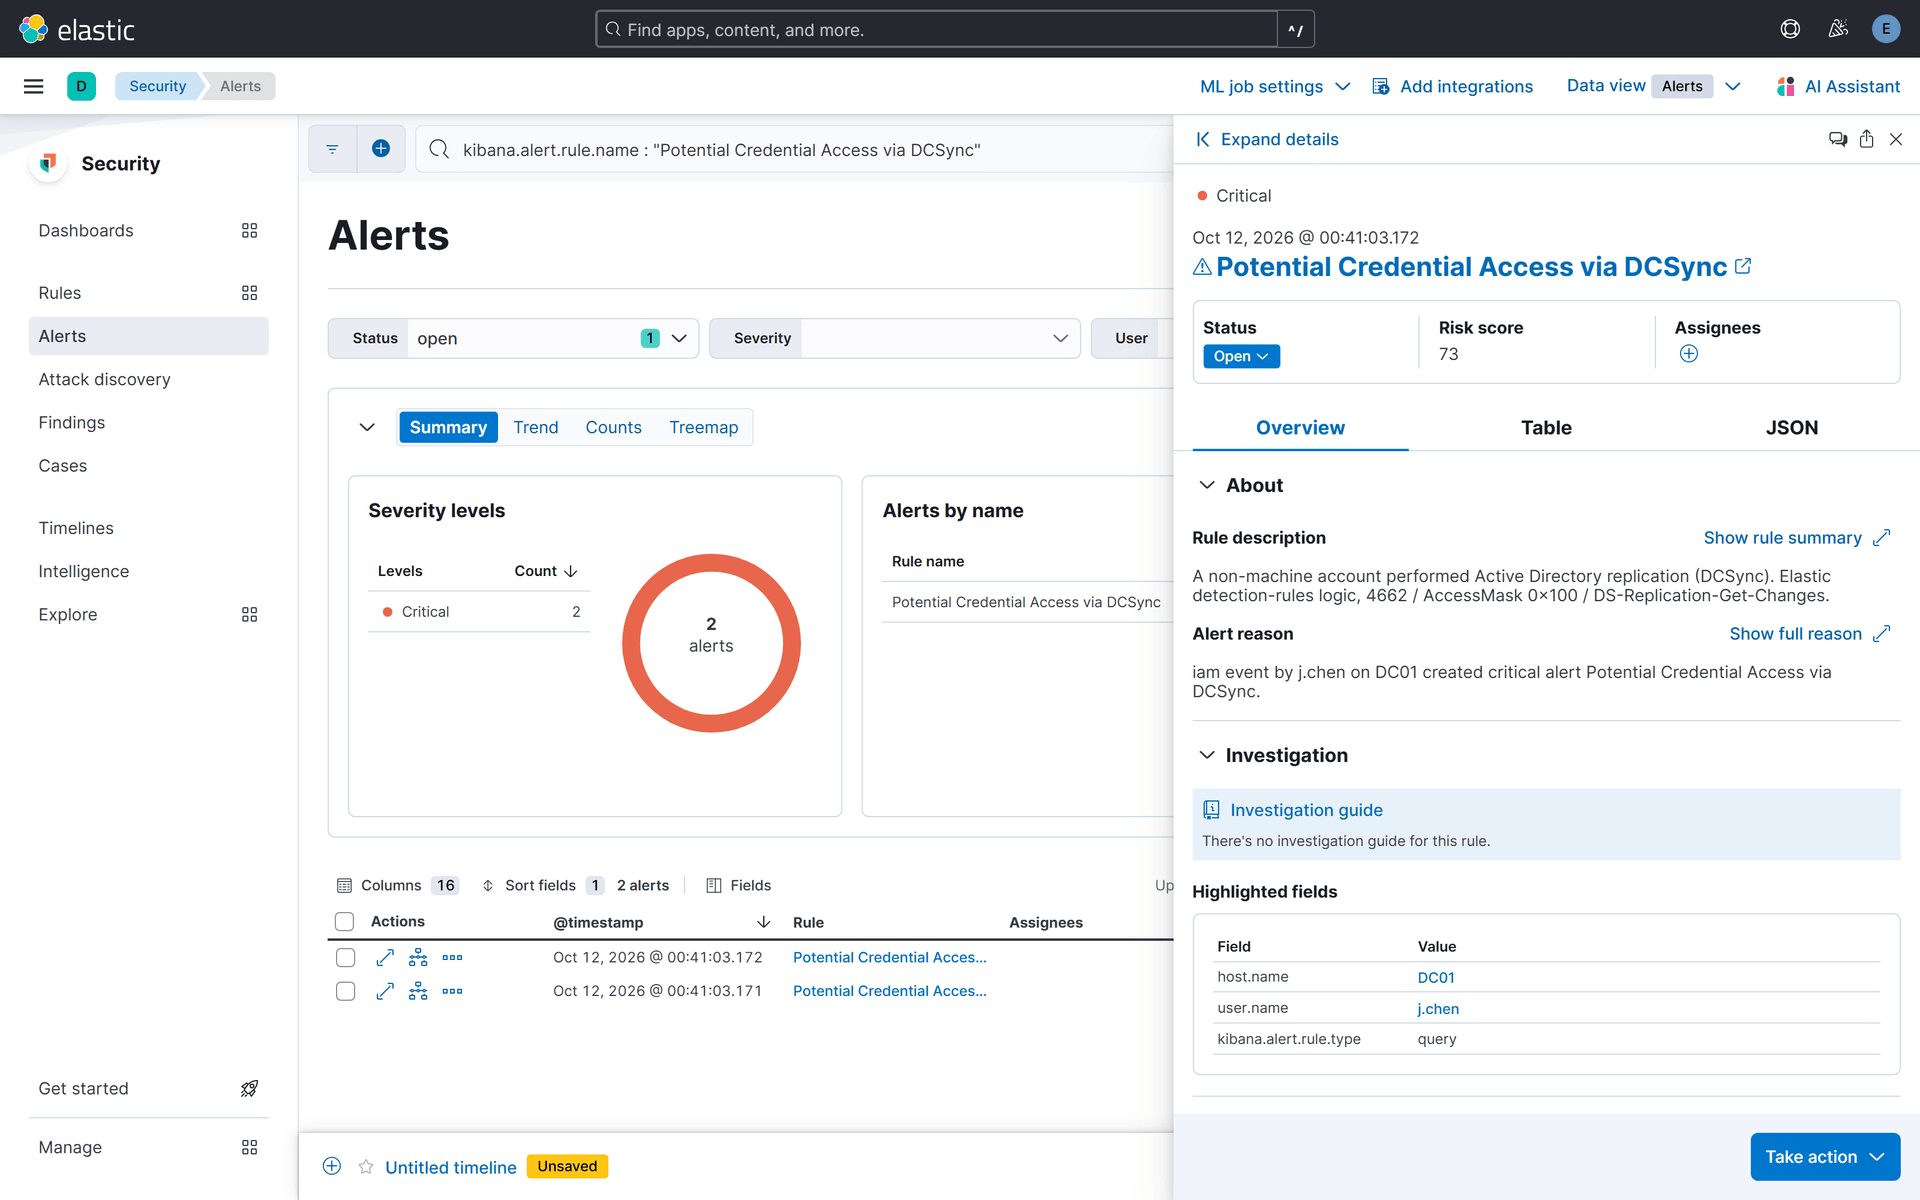
Detection is clean and done here. The next two sections are how the Copilot turns these 9 alerts from four unrelated signals into an actionable battle plan.
3. Triage
Handing these 9 alerts to batch triage, the Copilot clusters them by (rule, subject) and has the model rate, rank, flag false positives, and recommend actions. Measured on the real system:
7.8 seconds from start to rendered result table, 9 alerts clustered into 4, all scored, no degradation. Severity distribution: 2 critical, 1 high, 1 medium, none judged a false positive.
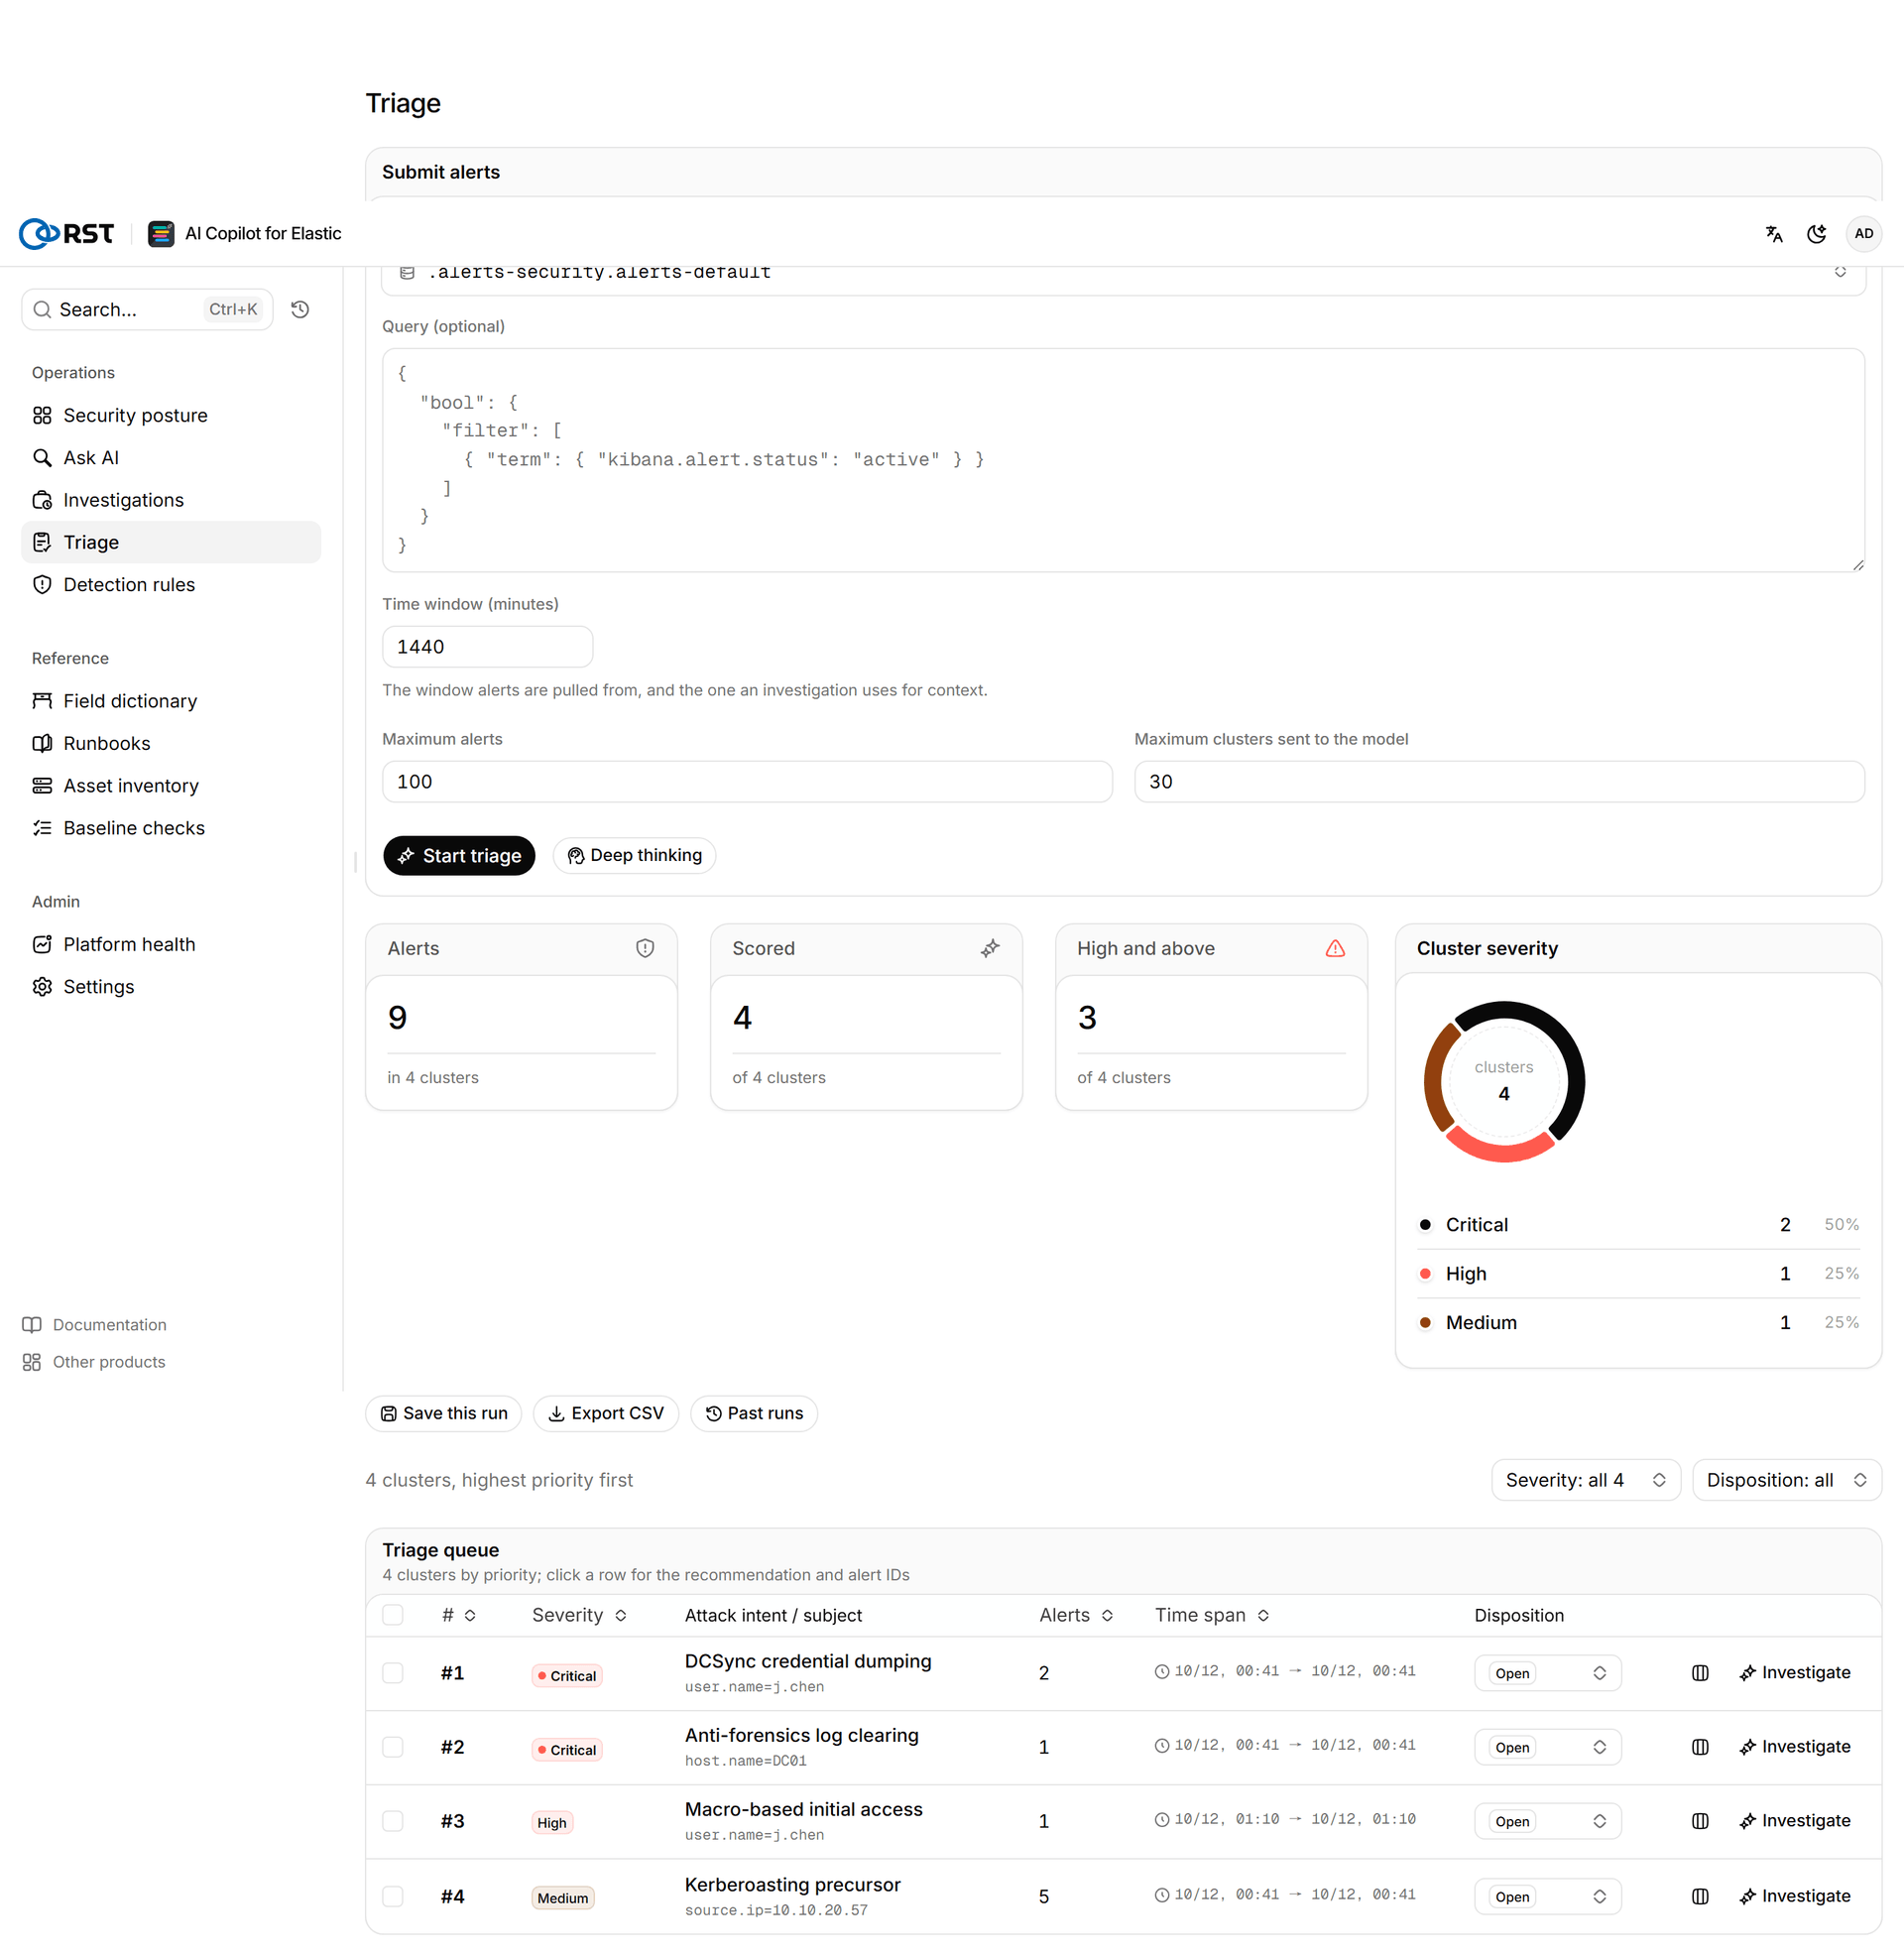
The triage queue, ordered by priority:
| Priority | Severity | Attack intent | Subject | Alerts |
|---|---|---|---|---|
| #1 | critical | DCSync credential dumping | user.name=j.chen | 2 |
| #2 | critical | Anti-forensics log clearing | host.name=DC01 | 1 |
| #3 | high | Macro-based initial access | user.name=j.chen | 1 |
| #4 | medium | Kerberoasting precursor | source.ip=10.10.20.57 | 5 |
Two details are worth pausing on. First, the largest cluster is last: the 5 RC4 Kerberos ticket alerts are rated medium and pushed to the tail, because Kerberoasting is the earliest, least lethal step of the chain, not because it has the most alerts. Second, the Copilot rated the two DCSync alerts critical and ranked them first, and in its recommendation linked them directly to the DC01 log-clear cluster; it had already begun to see these as one attack. The screen that was unreadable in the prologue becomes, 7.8 seconds later, an ordered battle plan with reasons attached.
4. Investigation
This time the analyst did not start from a critical. They picked the most ordinary-looking alert, the high "Macro-based initial access," and ran a full investigation, wanting to know what had actually happened on that workstation.

This is not dumping the logs into the model to summarize. It is an autonomous retrieval loop (up to 8 rounds): the model reads the alert, writes a read-only ES query to gather evidence, reads the masked results, and decides whether its evidence checklist is covered or it needs another query, like a tireless analyst who walks the same checklist to the end every time.
The retrieval trace this investigation actually produced (1 agentic round, 13 pieces of evidence, verdict critical, confidence high, no degradation):
| Round | What the model queried | Hits | What it revealed |
|---|---|---|---|
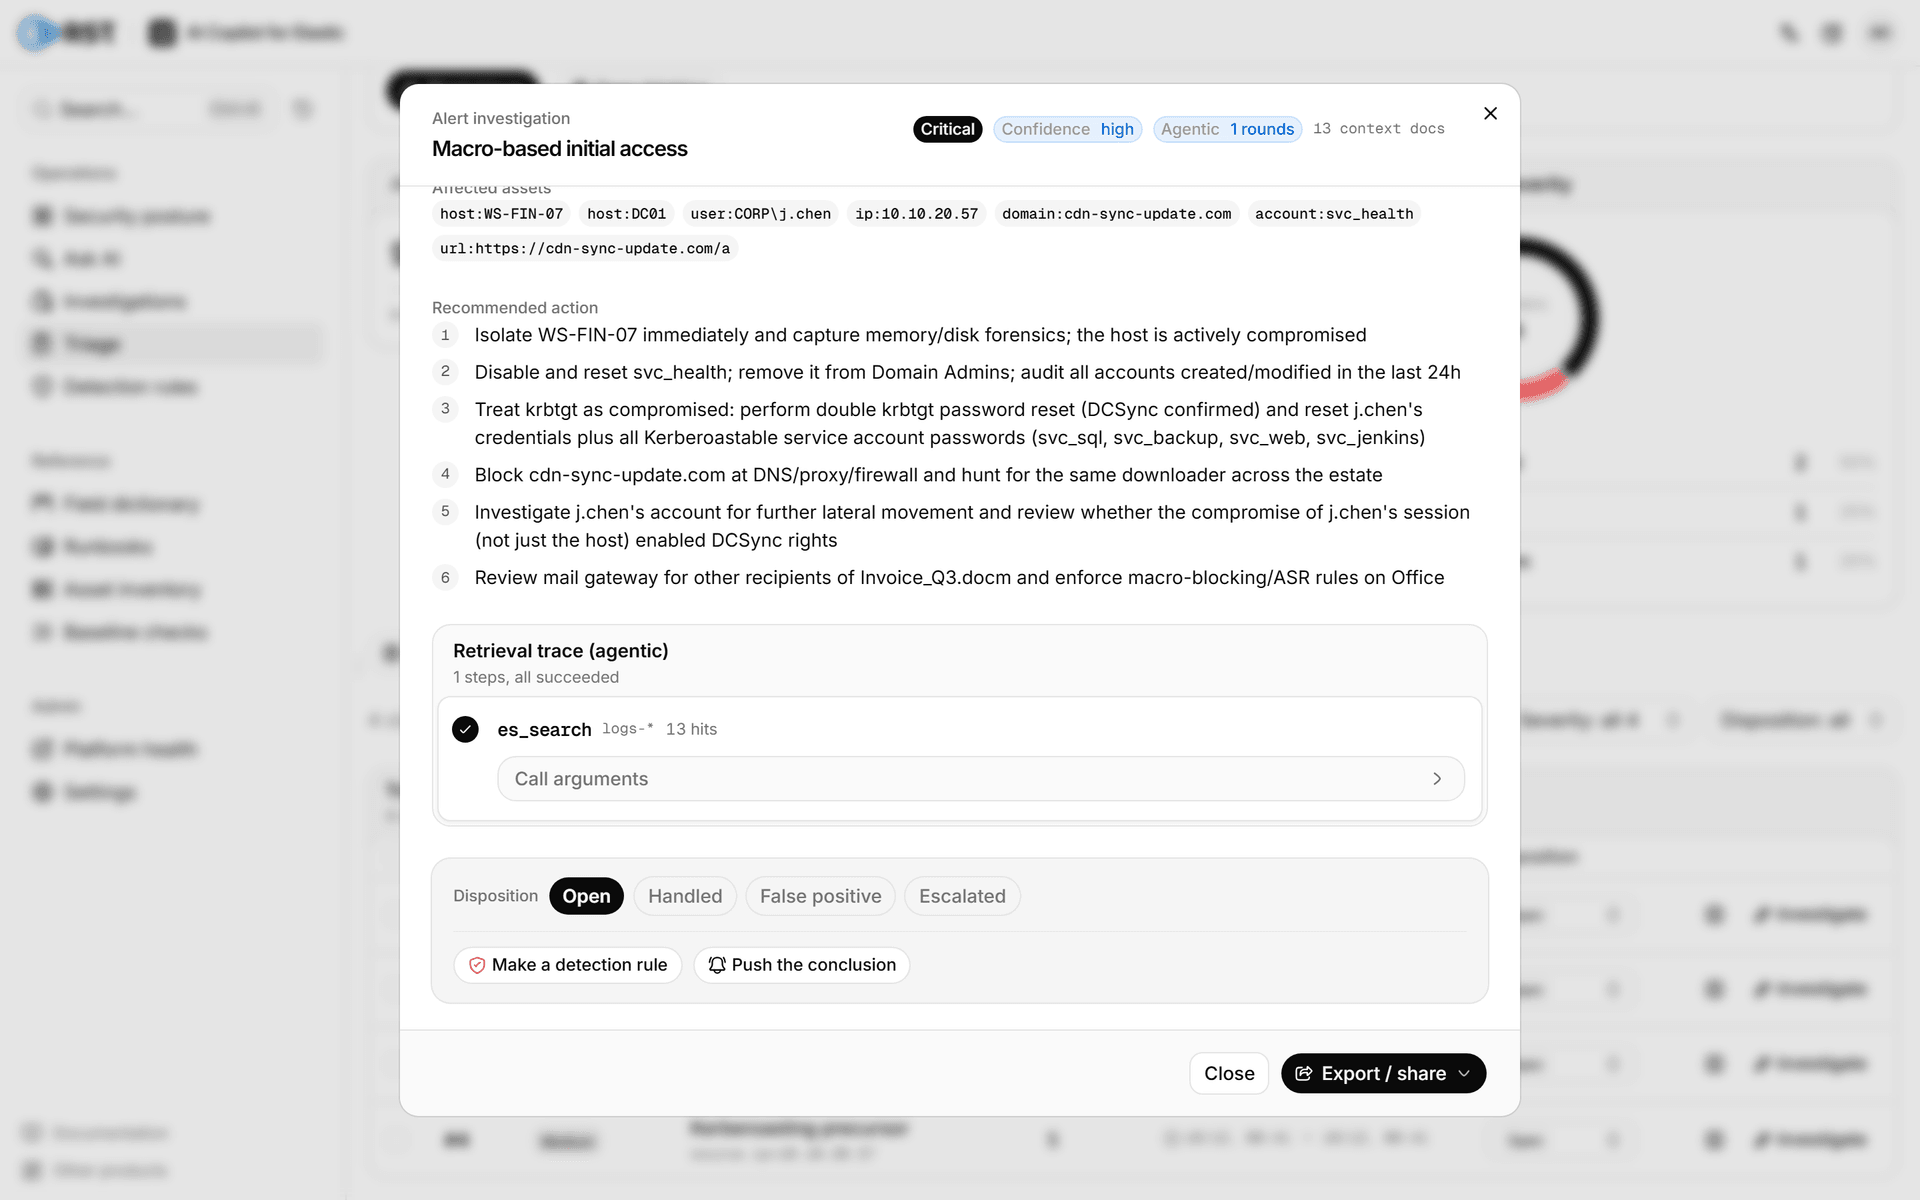
| 1 | one broad read-only query over logs-*, covering host + identity across the window | 13 | the entire chain in a single pass: interactive logon of j.chen to WS-FIN-07 → macro doc Invoice_Q3.docm → powershell -enc downloader (cdn-sync-update.com) → Kerberoasting (setspn -T corp -Q */*, RC4 TGS) → 4662 DCSync on DC01 (replicate domain + krbtgt) → backdoor svc_health into Domain Admins → C2 exfil |
The model's checklist (foothold, identity, lateral, exfil, cleanup) was satisfied by that one query, so the loop closed after a single round. On the surface the alert is only a workstation that ran a macro, yet the model reconstructed foothold → identity j.chen → DC DCSync → backdoor account svc_health → exfil, an intrusion already carried out, and escalated this high alert's verdict to critical, precisely the stages Elastic could not alert on individually, or could not link together, in the dual-track table.
In this investigation the product did several things that feeding the logs to an LLM cannot:
- Writes the ES query itself: a read-only query spanning host, identity, and the time window, covering the whole intrusion window in one pass, no query template needed from a human.
- Pivots by identity across hosts: from the
WS-FIN-07foothold the model follows thej.chenidentity toDC01and on to the backdoorsvc_health, connecting a workstation alert all the way to data exfiltration on another host. - Reconstructs rather than restates: it reads the raw 4624, 4688, 4769, 4662 events and assembles them into an ordered chain with the DCSync smoking gun.
- Knows when to stop: the loop runs up to 8 rounds and will widen the window or issue follow-up queries when a first pass comes back thin; here one pass covered the checklist, so it closed after one round instead of padding out more.
- Read-only with an index whitelist: the query is rejected if it goes out of bounds, so the model never touches data it should not just because it wanted to query.
When it finishes, the verdict comes in one pass: summary, a full timeline ordered by timestamp, the attack chain, MITRE ATT&CK techniques (T1566.001, T1204.002, T1059.001, T1558.003, T1003.006, T1136.002), affected assets, and graded remediation. The recommendations are not just disable the account; they call out senior AD incident-response moves like rotating every Kerberoasted service account (svc_sql, svc_backup, svc_web, svc_jenkins), treating krbtgt as compromised and resetting its password twice, blocking cdn-sync-update.com and hunting the same downloader across the estate, and even reviewing whether the compromise of j.chen's session, not just the host, granted the DCSync rights:
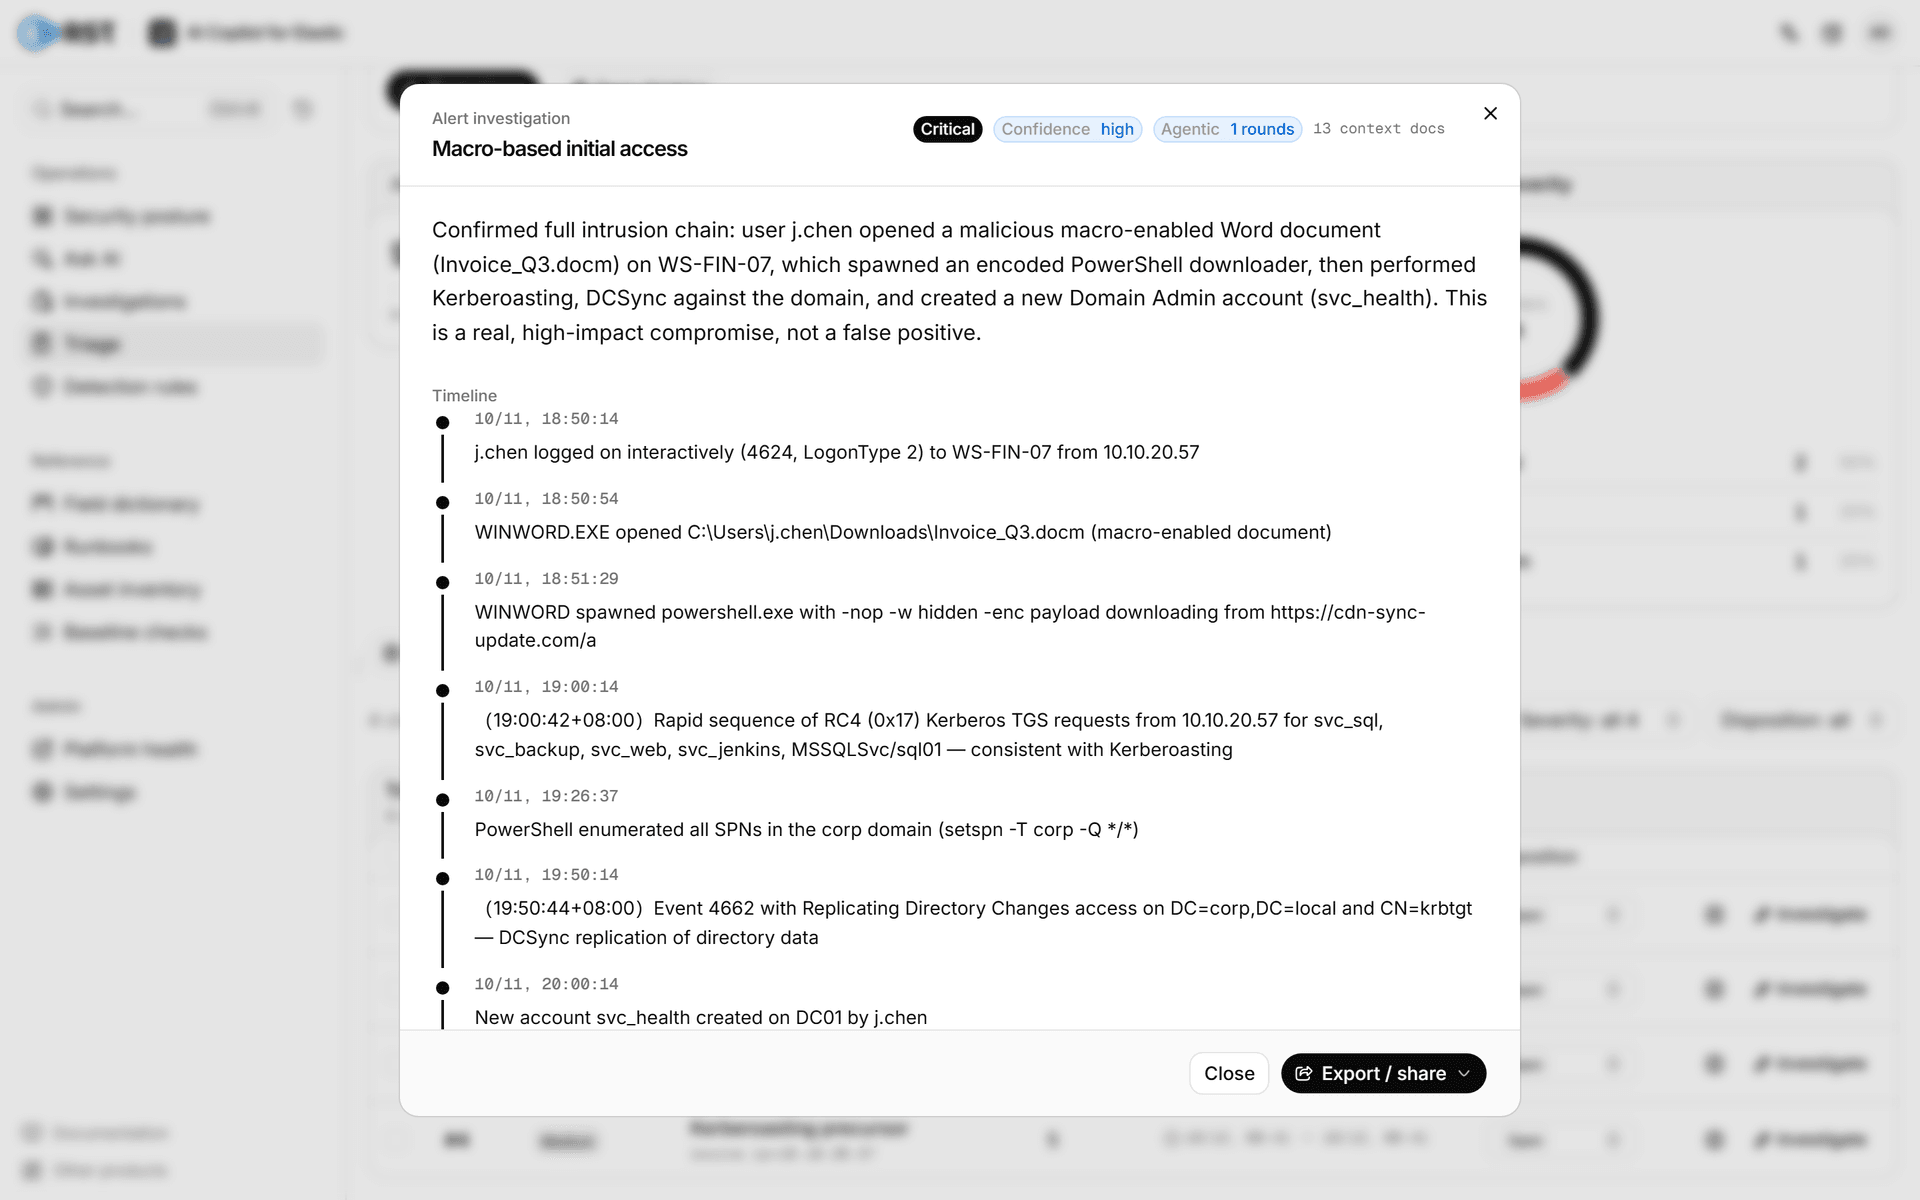
Every investigation is archived automatically under Analysis Records, traceable and reviewable:
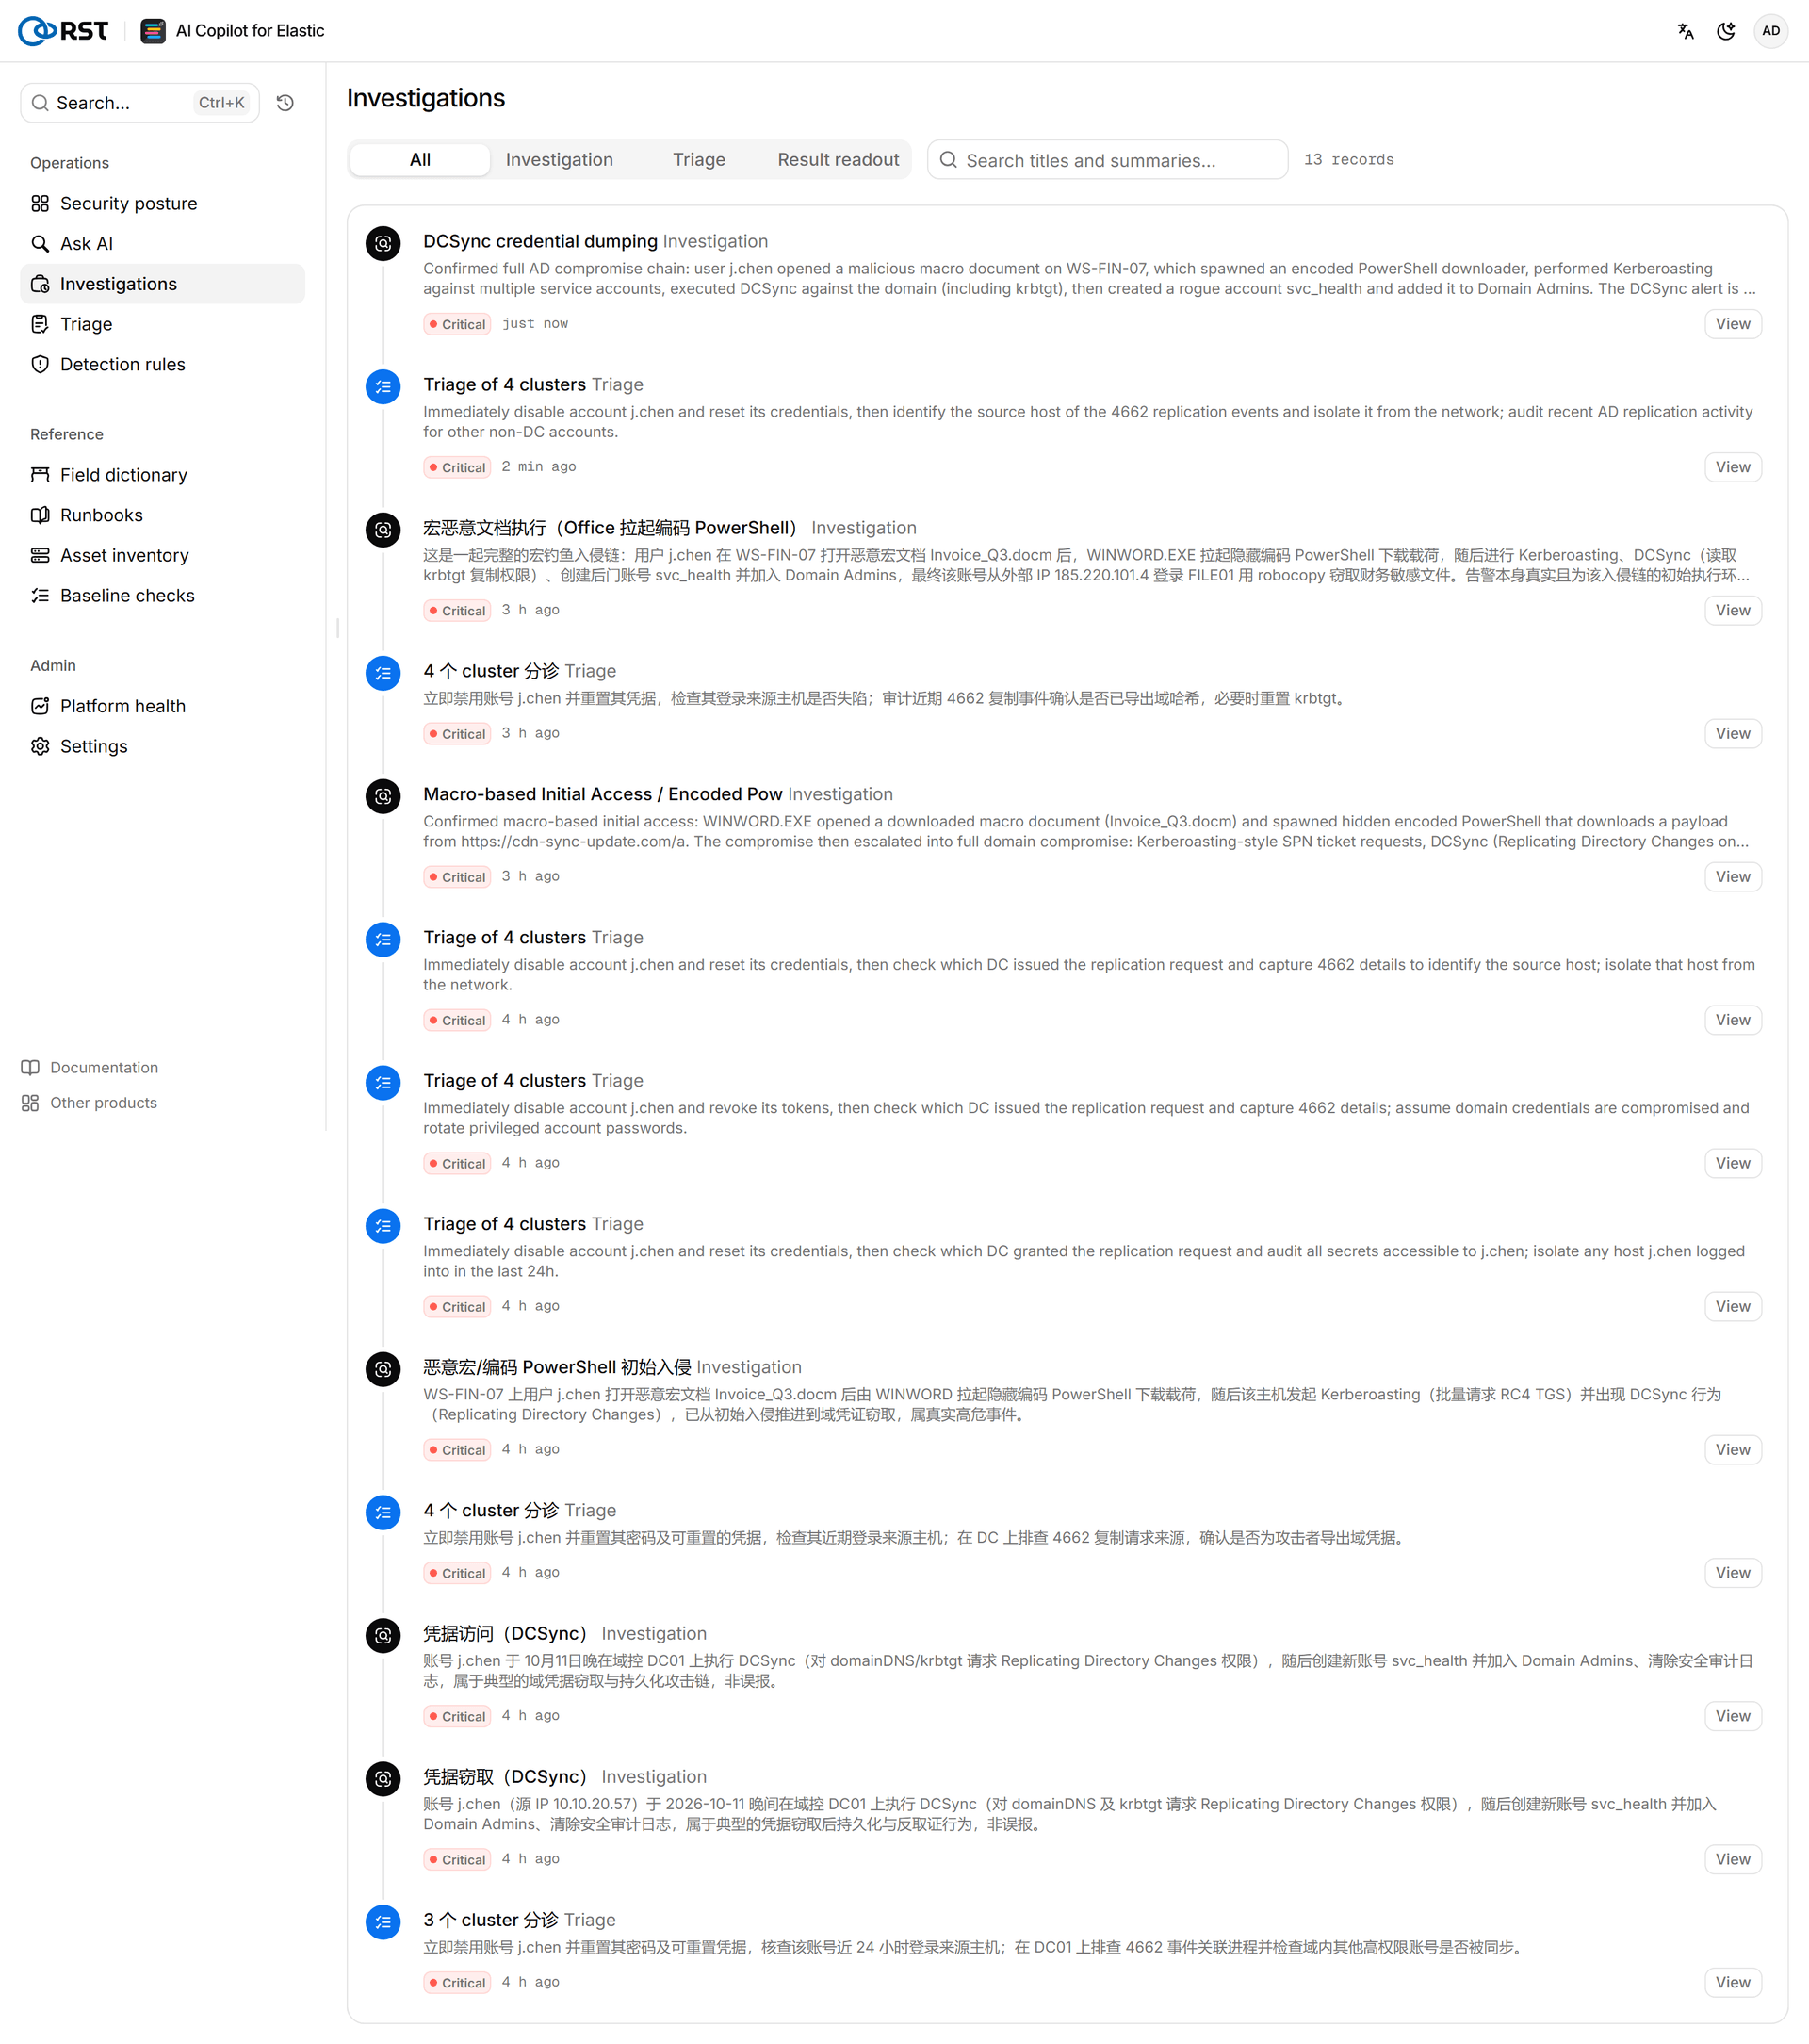
Back to the prologue: Elastic handed the analyst four alerts across different rules and subjects; the Copilot handed them one complete story, from j.chen opening a phishing document to the entire domain being emptied by DCSync, with the evidence source for every step. The full picture that used to take a senior analyst a dozen hand-written queries and half an hour to assemble now takes under a minute, traceable and auditable.
5. Guardrails
On a real intrusion chain, a smart but unreliable AI introduces new risk: inventing an account that does not exist, or waving a real DCSync through as a false positive, can both mislead response. The product bakes three constraints into triage and investigation so that every conclusion can be reviewed rather than trusted because the AI said so.
- A false positive needs counter-evidence to stand. If the model wants to call an alert a false positive, it first checks the time window for privileged operations, account changes, outbound connections, audit clears, and suspicious processes; any one of these overturns the FP verdict and escalates. For "Macro-based initial access" this investigation returned
is_likely_false_positive = false, citing the Kerberoasting and DCSync follow-on actions. Better to escalate a true false positive for human review than to let one real threat slip. - Entities must come verbatim from the evidence. Any username, IP, or host that appears in the conclusion but cannot be found in the evidence rows is removed from affected assets and flagged unverified, preventing the model from hallucinating accounts.
- Read-only, index whitelist, graded masking. Read-only search against Elastic plus polling for alert ingest, no rule changes, no automated response; every ES query passes the index whitelist and is rejected if out of bounds; outbound content is masked by deployment mode (cloud, private, airgapped), and in air-gapped mode the whole loop runs locally, so the model sees real values while no data leaves the domain.
6. Value and conclusion
The expensive part of a SOC was never buying the SIEM; it is the human labor of understanding an alert after the SIEM raises it. That labor has three old problems, slow, inconsistent, senior-dependent, and the product targets exactly these three.
Slow becomes fast. Ordering a screen of alerts plus recommending actions drops from opening each one and going by gut to 7.8 seconds; the thorough investigation of a single alert drops from a senior analyst's dozen hand-written queries and half an hour to under a minute.
Inconsistent becomes reproducible and auditable. Every investigation walks the same minimal checklist, so it will not check the foothold today and forget the identity pivot tomorrow; a false-positive verdict must be backed by counter-evidence, and every conclusion carries its query evidence source.
Senior-dependent becomes leveled up. Knowing to query by host, then pivot by account, and which negatives to rule out is the hardest senior experience to replicate, and the product bakes it into the retrieval loop, so a tier-1 analyst gets a near-senior-level evidence chain from a single investigation.
| Step | Traditional manual | RST AI Copilot for Elastic |
|---|---|---|
| Prioritize | open each by severity or count, easily drowned by the noisiest alerts | 7.8 seconds to intent-aware priorities plus action recommendations |
| Correlate | judge by experience whether alerts are one attack | cluster plus cross-subject pivot, auto-connect scattered alerts into a chain |
| Judge FPs | by experience; a miss lets a real threat through | counter-evidence mechanism overrules hasty FP calls, verdict auditable |
| See the full picture | a dozen hand-written queries, 30 to 60 minutes, varies by person | autonomous retrieval, under a minute, with timeline plus MITRE plus evidence |
| Coverage | tends to stop at the alert surface, missing foothold or exfil | actively traces back to foothold and DC along the minimal checklist |
| Data safety | no dedicated constraint | read-only plus index whitelist plus egress masking, safe for production Elastic |
One phishing invoice, one Kerberoasting run, one domain takeover done entirely on legitimate credentials: the day every SOC dreads. On that day Elastic Security did what it does best, denoising a flood of events into a handful of detection alerts, and RST AI Copilot for Elastic filled in the two things most missing after Elastic's detection, second-scale intent-aware triage ordering, and autonomous, traceable, guardrailed cross-host investigation.
It took a seemingly ordinary encoded PowerShell alert and, inside a minute, reconstructed it into a complete story from phishing to DCSync domain takeover, without inventing accounts and without waving a real threat through as a false positive. The product does not replace the analyst and does not auto-respond; the response decision stays in human hands. Leave detection to Elastic, comprehension to the Copilot, and the decision to the human. The same SOC team can watch more alerts and miss the real one less often.