

Product evaluation··Sevion Xia
RST AI Copilot for Zabbix: a hands-on evaluation
A core uplink starts dropping frames; Zabbix reports downstream database timeouts and ping loss first, and the root-cause alert arrives minutes later: how RST AI Copilot for Zabbix finds the root cause from trigger dependencies and traces it to a physical-layer fault within a minute.

Version v1.0 · 2026-10 · Test environment: RST AI Copilot for Zabbix 2.0.3 · Zabbix 7.0.31 LTS (server · web · Agent 2, PostgreSQL 16) · model MiniMax-M3
Summary
The uplink port Gi1/0/1 on core switch core-sw-01, which connects the order system's access switch, starts to degrade: frames are lost in both directions and the core side keeps counting input errors. Over the next five minutes Zabbix first reports database connection timeouts in the order service, then a failed health check on the order portal, the only "High" alert on the screen, then ICMP loss on the access switch. The root cause, a "Warning"-level interface error-rate alert, arrives 4 minutes after the first symptom. An unrelated /etc/passwd change sits on the same screen.
The test ran on an 11-host Docker lab. Agent 2, SNMP, ICMP and web scenarios are all collected for real against the official Zabbix templates, and the fault is injected on the switch with tc netem (20% frame loss each way, reproducible). The switches are simulated with net-snmp, and the interface input-error counter is synthesised as received packets × loss rate; it is the only synthetic number in this paper. RST AI Copilot for Zabbix handles the correlation and investigation that follow the alerts. All figures below come from one run on 2026-10-13, made with the product's English interface:
- Correlation: in 29.8 seconds, 6 Problem events are grouped into 6 groups. Using the Zabbix trigger dependencies, the product finds one alert storm with core-sw-01 as its root cause (confidence 90%) and folds the ICMP-loss groups of access-sw-03 and ord-cache-01 into it. The work queue puts the root cause first; the portal and database-timeout groups follow, each with a recommendation that names the core-sw-01 link as the likely cause, and the unrelated account change comes last.
- Investigation: an autonomous investigation of the root cause makes 8 read-only calls in 25.0 seconds. It finds 7 input errors per second on Gi1/0/1 and none outbound, rules out congestion and link flapping, shows by peer comparison that core-sw-01 is the only switch of its kind with errors, and concludes a physical-layer fault on that port (SFP, fibre or patch cable).
- Guardrails: the investigation can call only Zabbix's read-only
*.getmethods, and the gateway pins the query scope to the selected host group. Each call returns at most 20 rows, and the data is masked before it reaches the model. Every investigation runs within limits on rounds, time and tokens.
Zabbix collects and alerts; RST AI Copilot for Zabbix explains, within a minute, what is behind that screen of alerts and shows the lookups that support it. People decide what to do.
1. Prologue
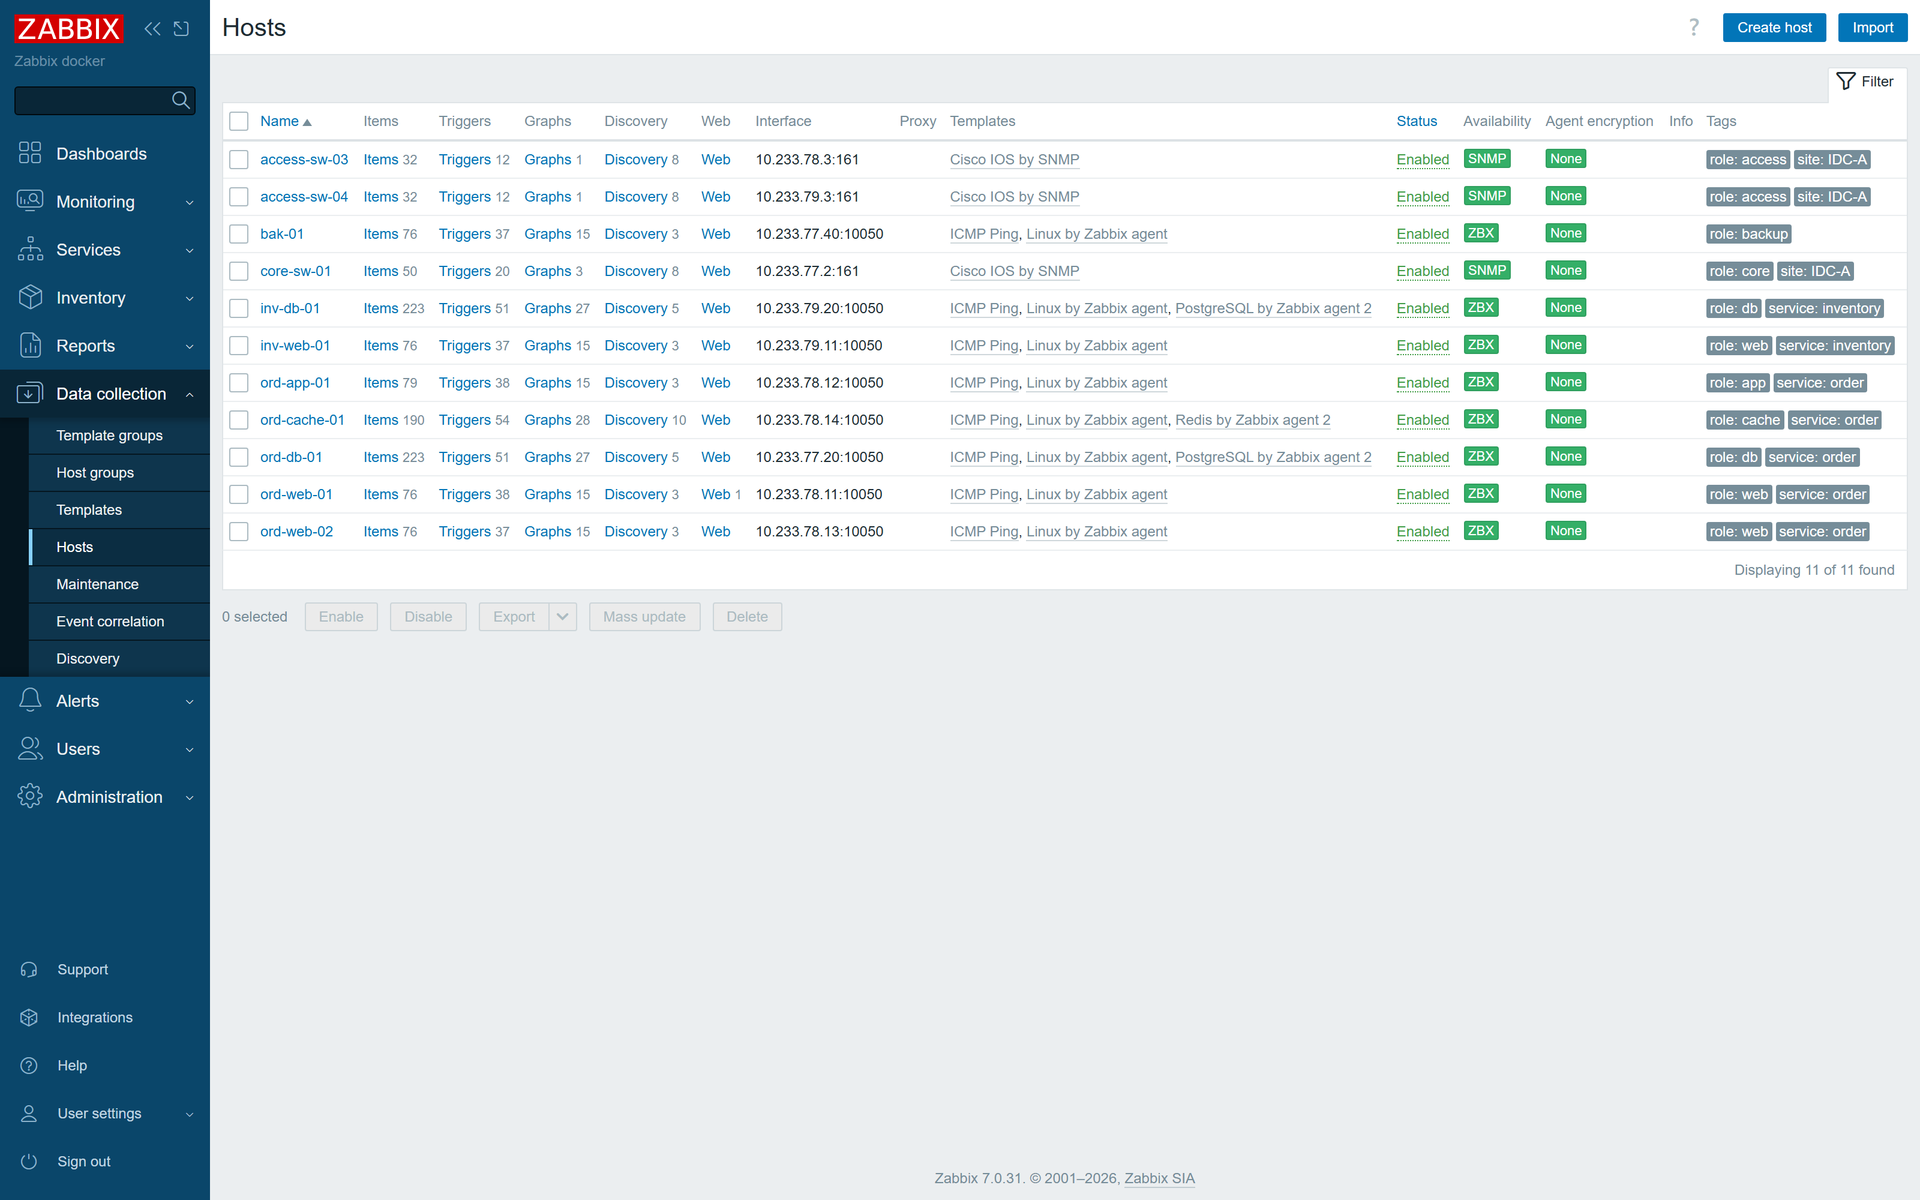
The test network is a lab segment of data centre IDC-A with 11 monitored hosts. Core switch core-sw-01 has two access switches below it: access-sw-03 serves the order system (portals ord-web-01/02, order application ord-app-01, cache ord-cache-01) and access-sw-04 serves the inventory system (inv-web-01, inv-db-01). The order database ord-db-01 and the backup server bak-01 sit on the core side. A traffic container keeps requesting both services so that the links carry real traffic. The three switches are Cisco IOS devices simulated with net-snmp; every other host is a real running container.

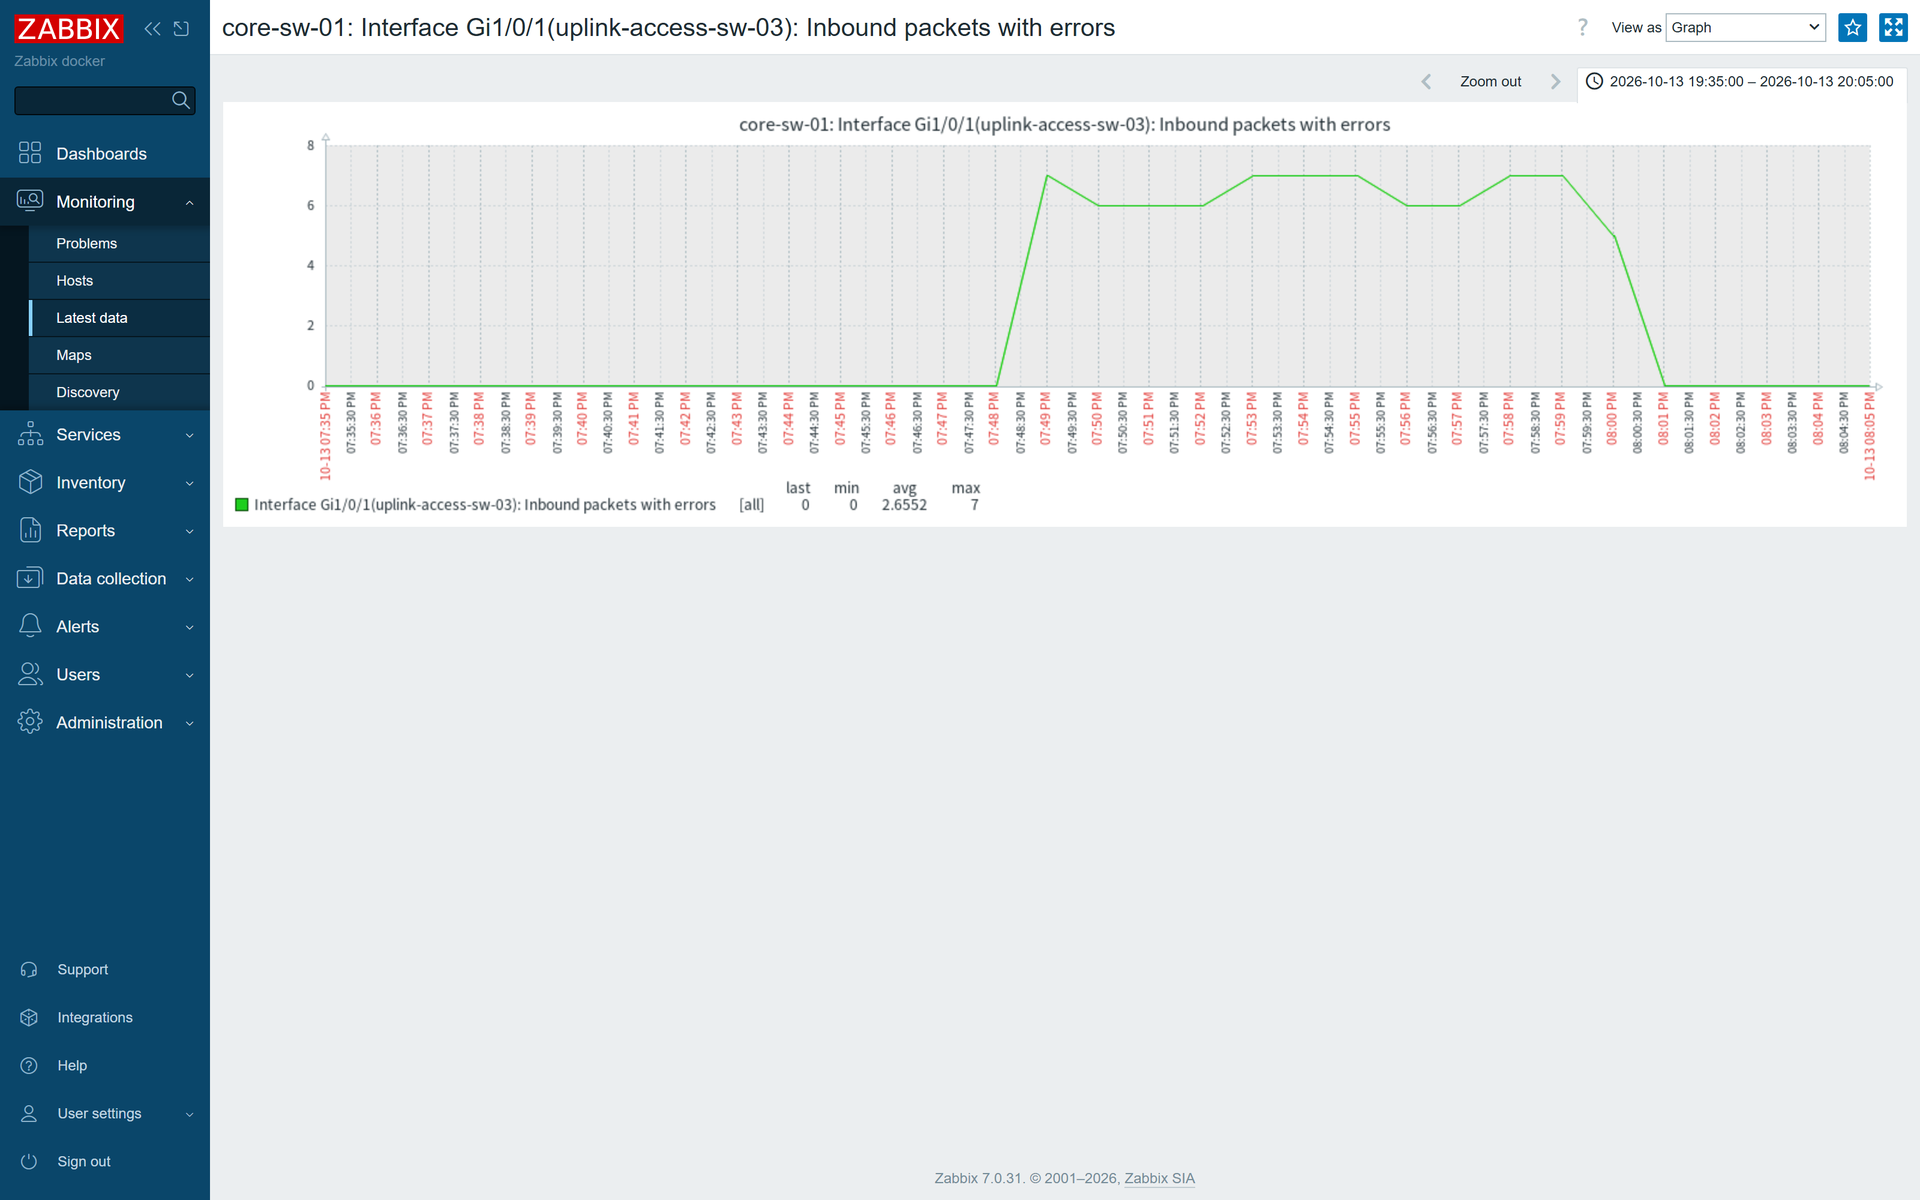
At 19:48:25, core-sw-01 Gi1/0/1 (the uplink to access-sw-03) starts dropping frames in both directions, and the core side counts 6 to 7 input errors per second. The order application's connections to the database cross this link, so connection timeouts start at 19:49; the order portal's health check fails at 19:50; ICMP loss shows up on access-sw-03 at 19:52 and on ord-cache-01 at 19:53; the interface error-rate alert fires at 19:53. The inventory system uses Gi1/0/2 and is not affected.
At 19:58 the on-call engineer opens the Zabbix Problems page:
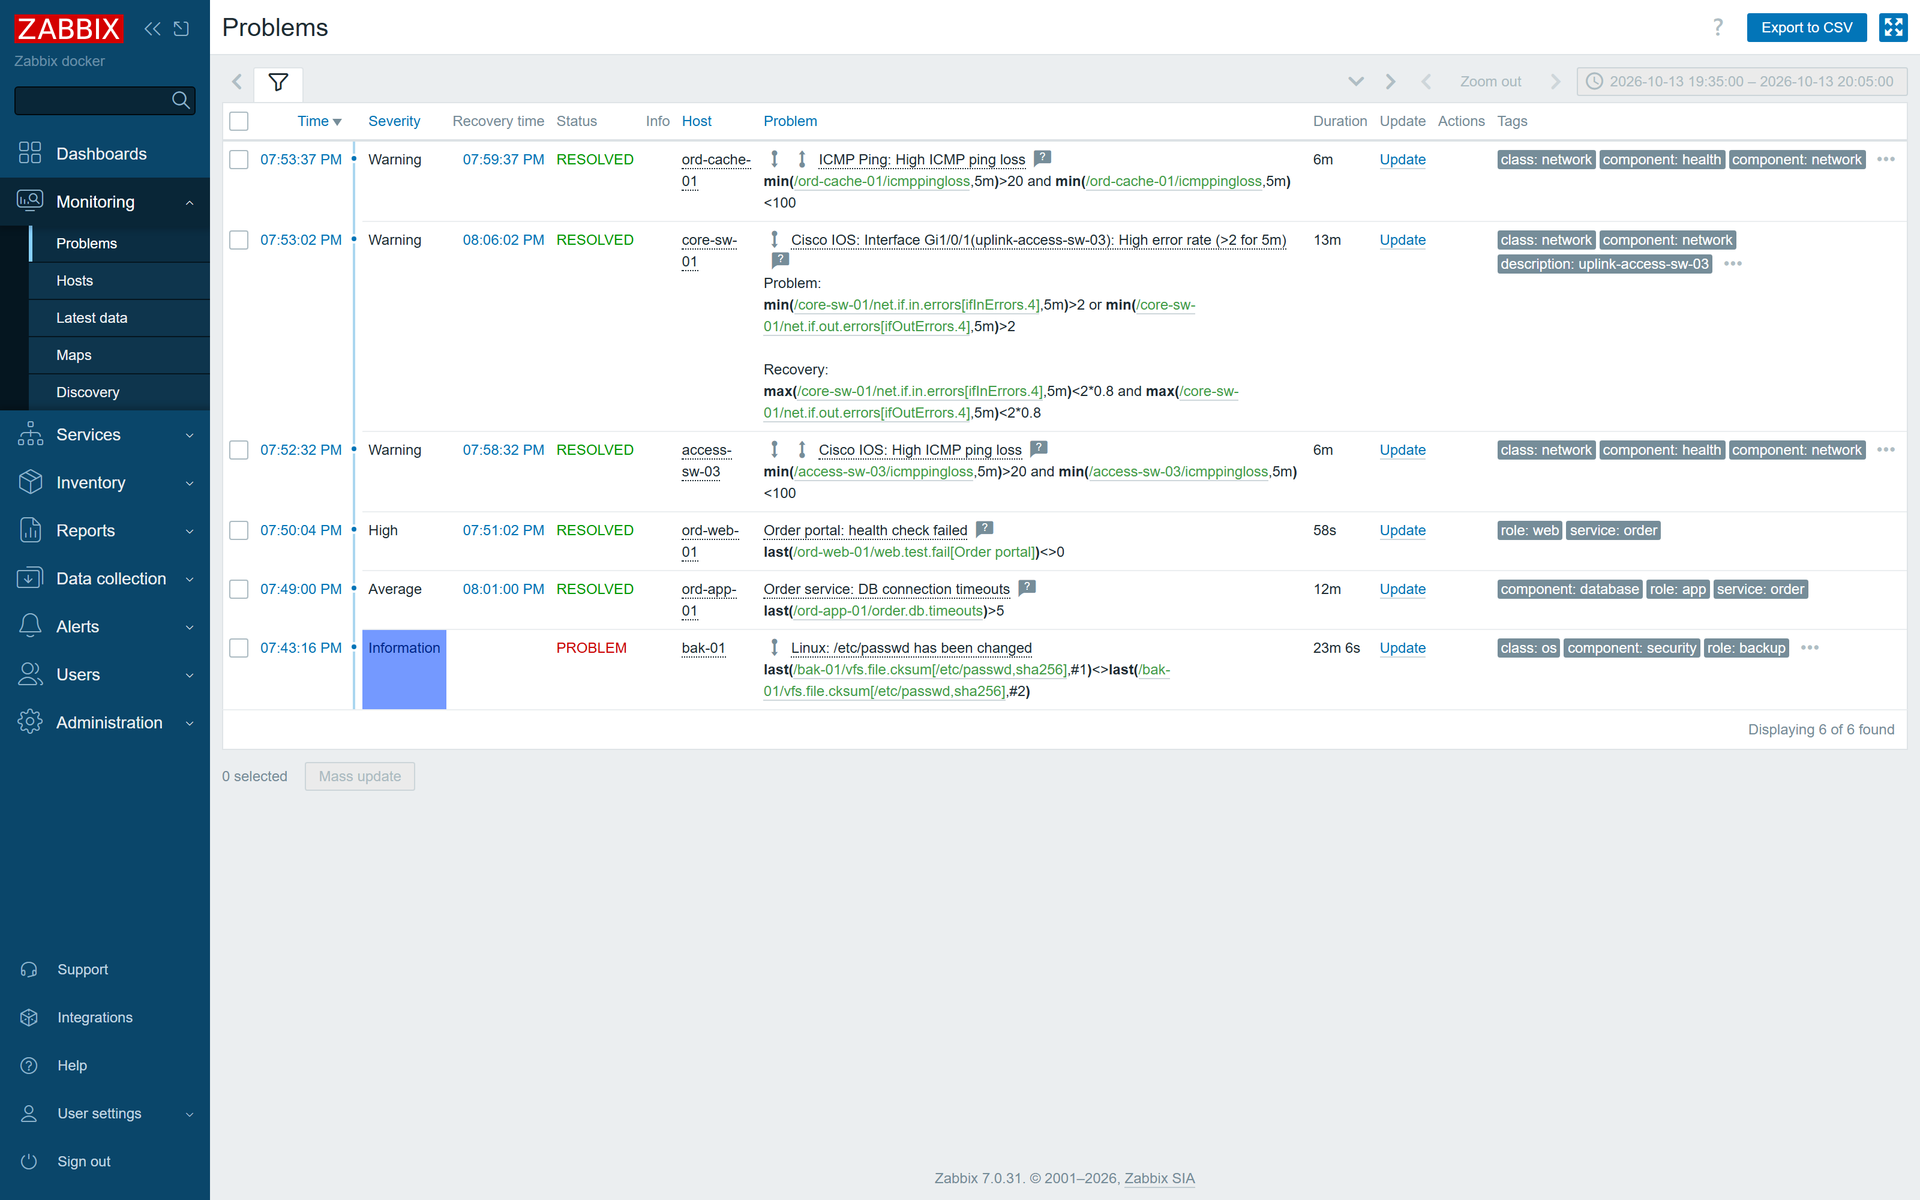
The window holds 6 Problems: the portal health check (High, already recovered), the order service's database timeouts (Average), core-sw-01's interface error rate (Warning), ICMP loss on access-sw-03 and ord-cache-01 (Warning), and the /etc/passwd change on bak-01 (Information). The screenshot was taken after the fault was removed at 19:59:48, so most rows already show RESOLVED. The engineer has three questions to answer:
- Which one first? The loudest is the portal, the earliest is the database timeout; the interface alert at the root is a "Warning", like the two ICMP-loss alerts.
- Which ones belong together? Do the timeouts, the portal failure and the ICMP loss share a cause, and is the account change related?
- What is the root cause? An application that cannot reach its database may point to the database, the application or the network in between, and telling them apart means going through graphs host by host and logging in to switches to read counters.
RST AI Copilot for Zabbix sits on top of Zabbix and reads problems, events, triggers and history through the Zabbix API. It does not replace collection or alerting; it handles the correlation and investigation that come after the alerts. At the same moment its Alerts page lists these Problems by severity and time:
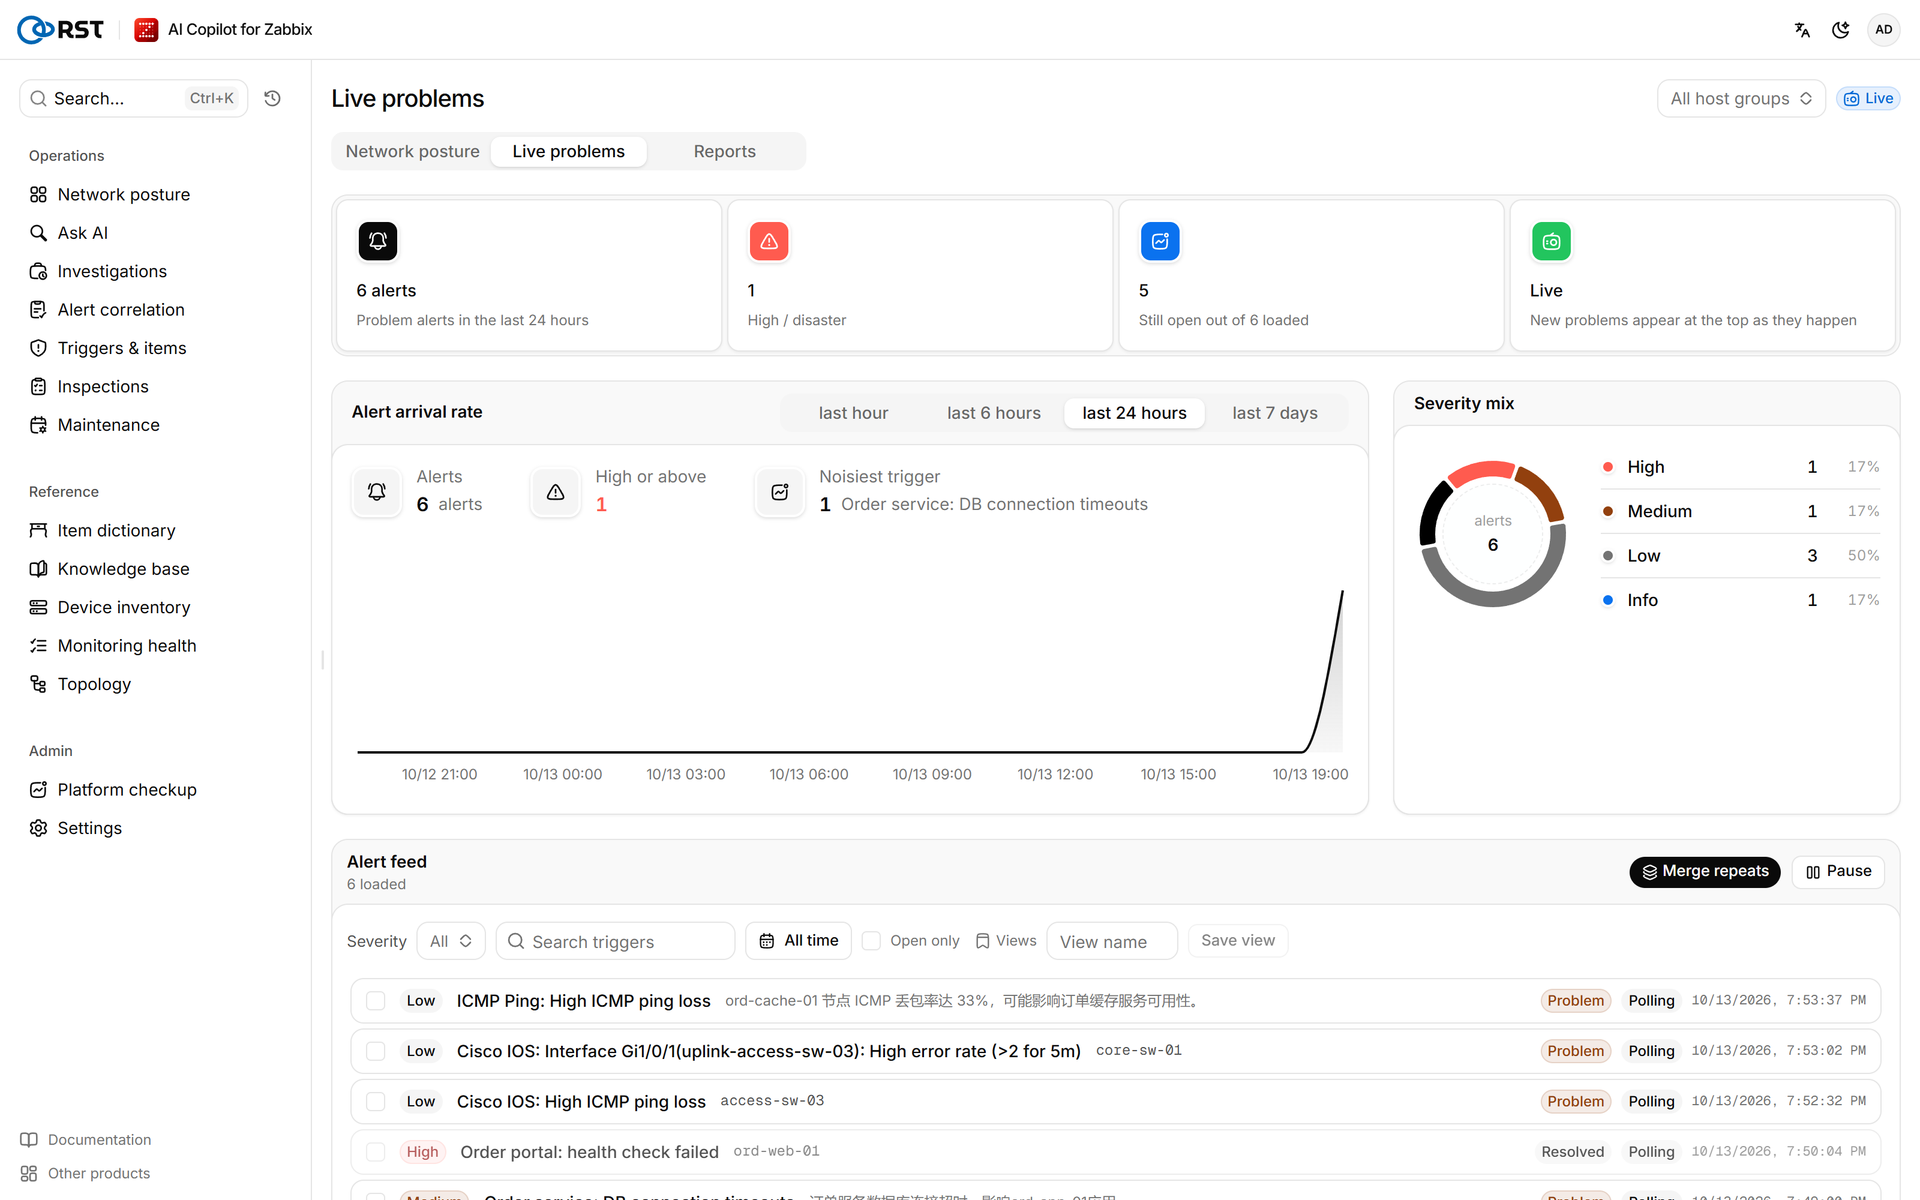
2. Two timelines
The left side of the table is what actually happened on the link; the right side is whether Zabbix alerted, and what RST AI Copilot for Zabbix added.

Times are local; alert times are Zabbix event times.
| Time | What happened | Zabbix alert | Added by RST AI Copilot for Zabbix |
|---|---|---|---|
| 19:33 | A system account is created on bak-01 (unrelated) |  /etc/passwd has been changed · Information (19:43:16; the checksum is compared every 15 minutes) /etc/passwd has been changed · Information (19:43:16; the checksum is compared every 15 minutes) | Its own group, raised one level to "Low", ranked fourth |
| 19:48:25 | core-sw-01 Gi1/0/1 loses about 20% of frames each way; the core side starts counting input errors |  None (the template needs more than 2 errors/s for 5 minutes) None (the template needs more than 2 errors/s for 5 minutes) | The investigation finds 7 input errors/s on Gi1/0/1 and none outbound |
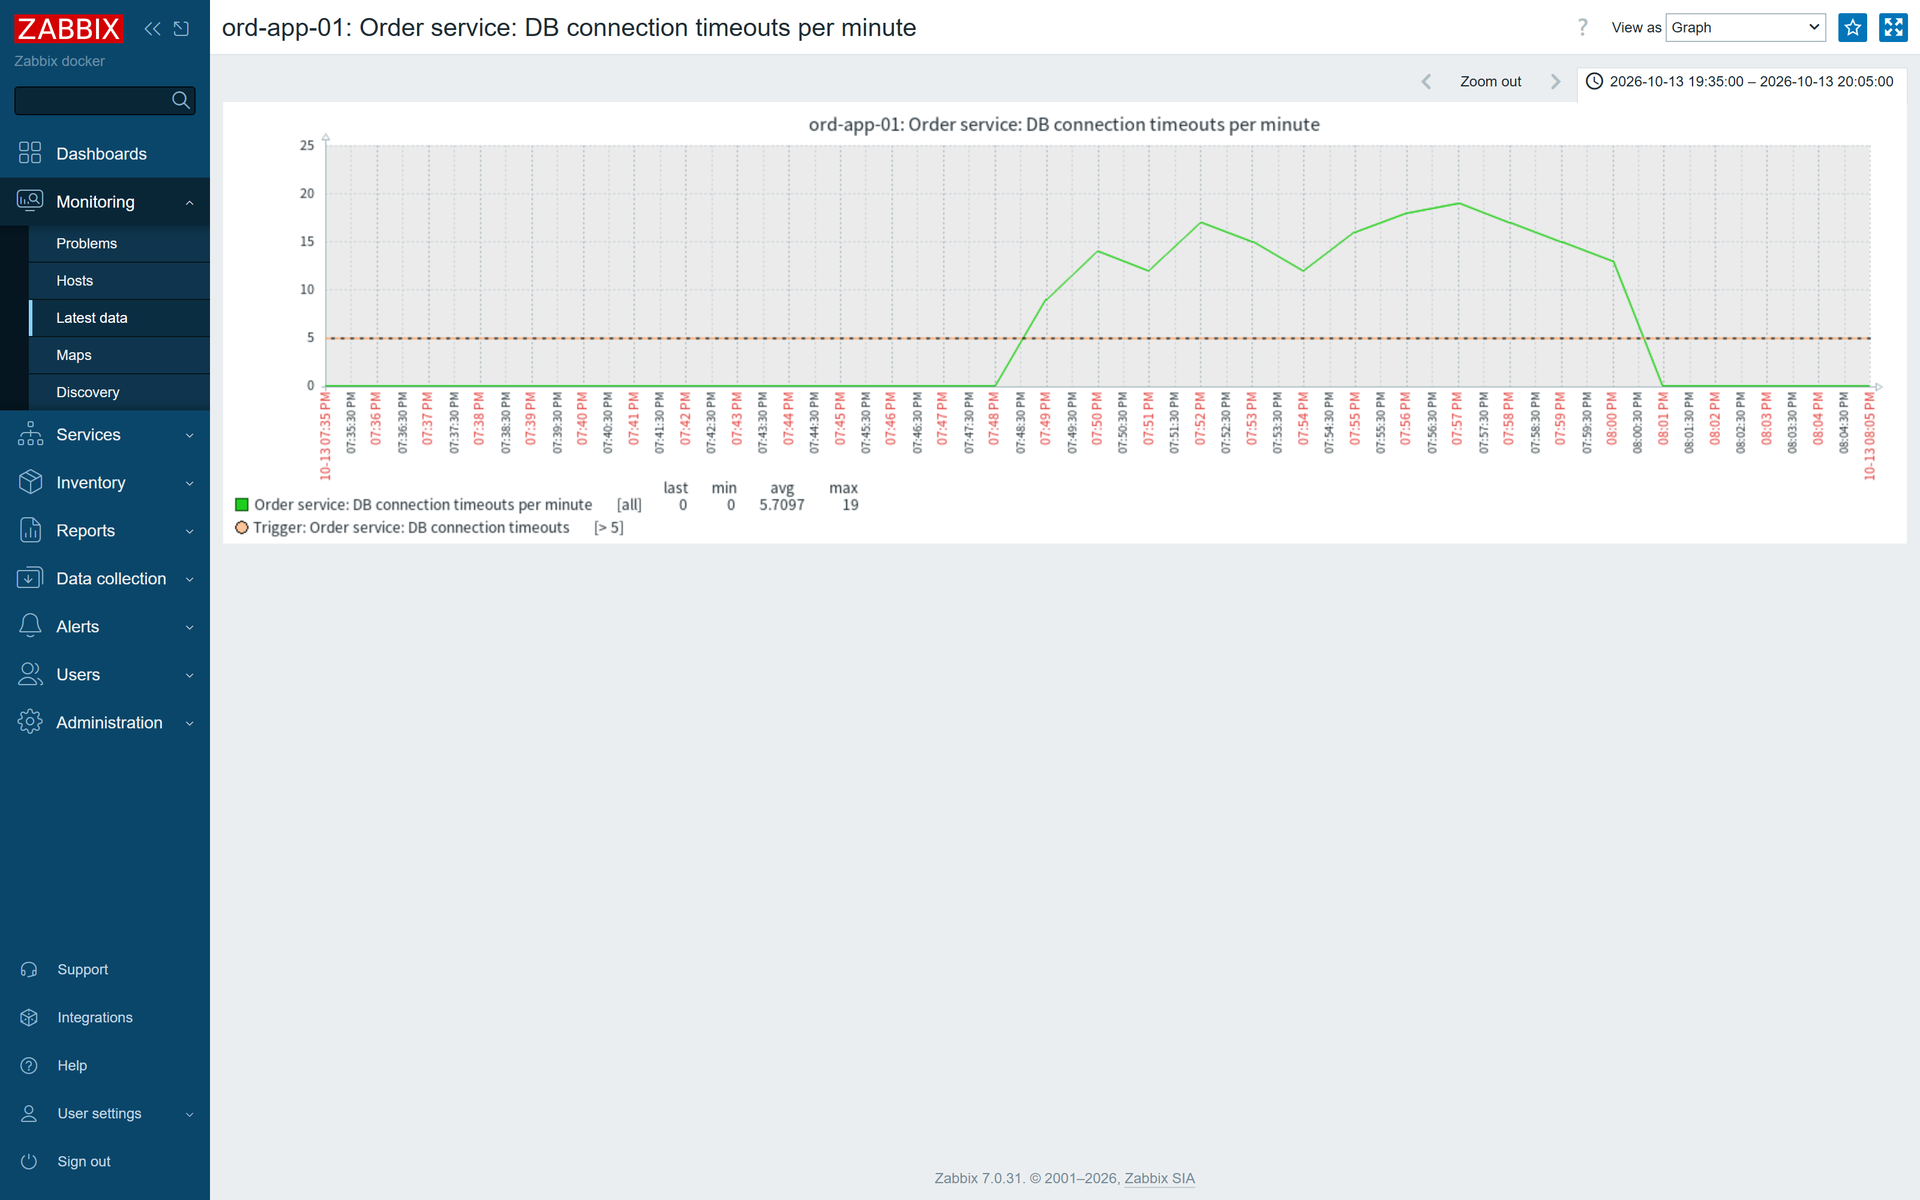
| 19:49:00 | The order application's connections to ord-db-01 cross this link and time out | Order service: DB connection timeouts · Average (first alert) | Ranked third; recommendation names the core-sw-01 link as the likely cause |
| 19:50:04 | The portal's /health depends on the database connection and returns 503 | Order portal: health check failed · High (recovered 19:51:02) | Ranked second; recommendation names the core-sw-01 link as the likely cause |
| 19:52:32 | Pings to access-sw-03 cross this link and are lost | High ICMP ping loss · Warning | Folded into the root cause, not listed separately |
| 19:53:02 | The error rate has been above the line for 5 minutes | Interface Gi1/0/1(uplink-access-sw-03): High error rate · Warning (4 minutes after the first symptom) | Identified as the storm root cause from trigger dependencies (confidence 90%), ranked first |
| 19:53:37 | Pings to ord-cache-01 are lost | High ICMP ping loss · Warning | Folded into the root cause, not listed separately |
| Throughout | ord-db-01 itself is healthy; the fault is on the path to it | None | Not listed |
| Throughout | The inventory system uses Gi1/0/2; its link is healthy | None | The investigation's peer comparison: access-sw-04 has 0 input errors |
Two kinds of rows stand out. The rows without alerts: for the first 5 minutes after the link degrades, Zabbix has nothing pointing at the link. And the root-cause row: it arrives 4 minutes after the first symptom, at the same level as the ICMP-loss alerts, and on the Problems page it sits below the portal's High alert.
Input errors on core-sw-01 Gi1/0/1 rise after 19:48, settle at 6 to 7 per second and fall back to 0 once the fault is removed at 19:59:48:
In the same period, the order service's database timeouts per minute cross the trigger threshold of 5:
Trigger dependencies follow the links in Zabbix: the order hosts' ICMP and agent triggers depend on access-sw-03's "Unavailable by ICMP ping", and access-sw-03 depends on core-sw-01. This is what RST AI Copilot for Zabbix uses to find the root cause:
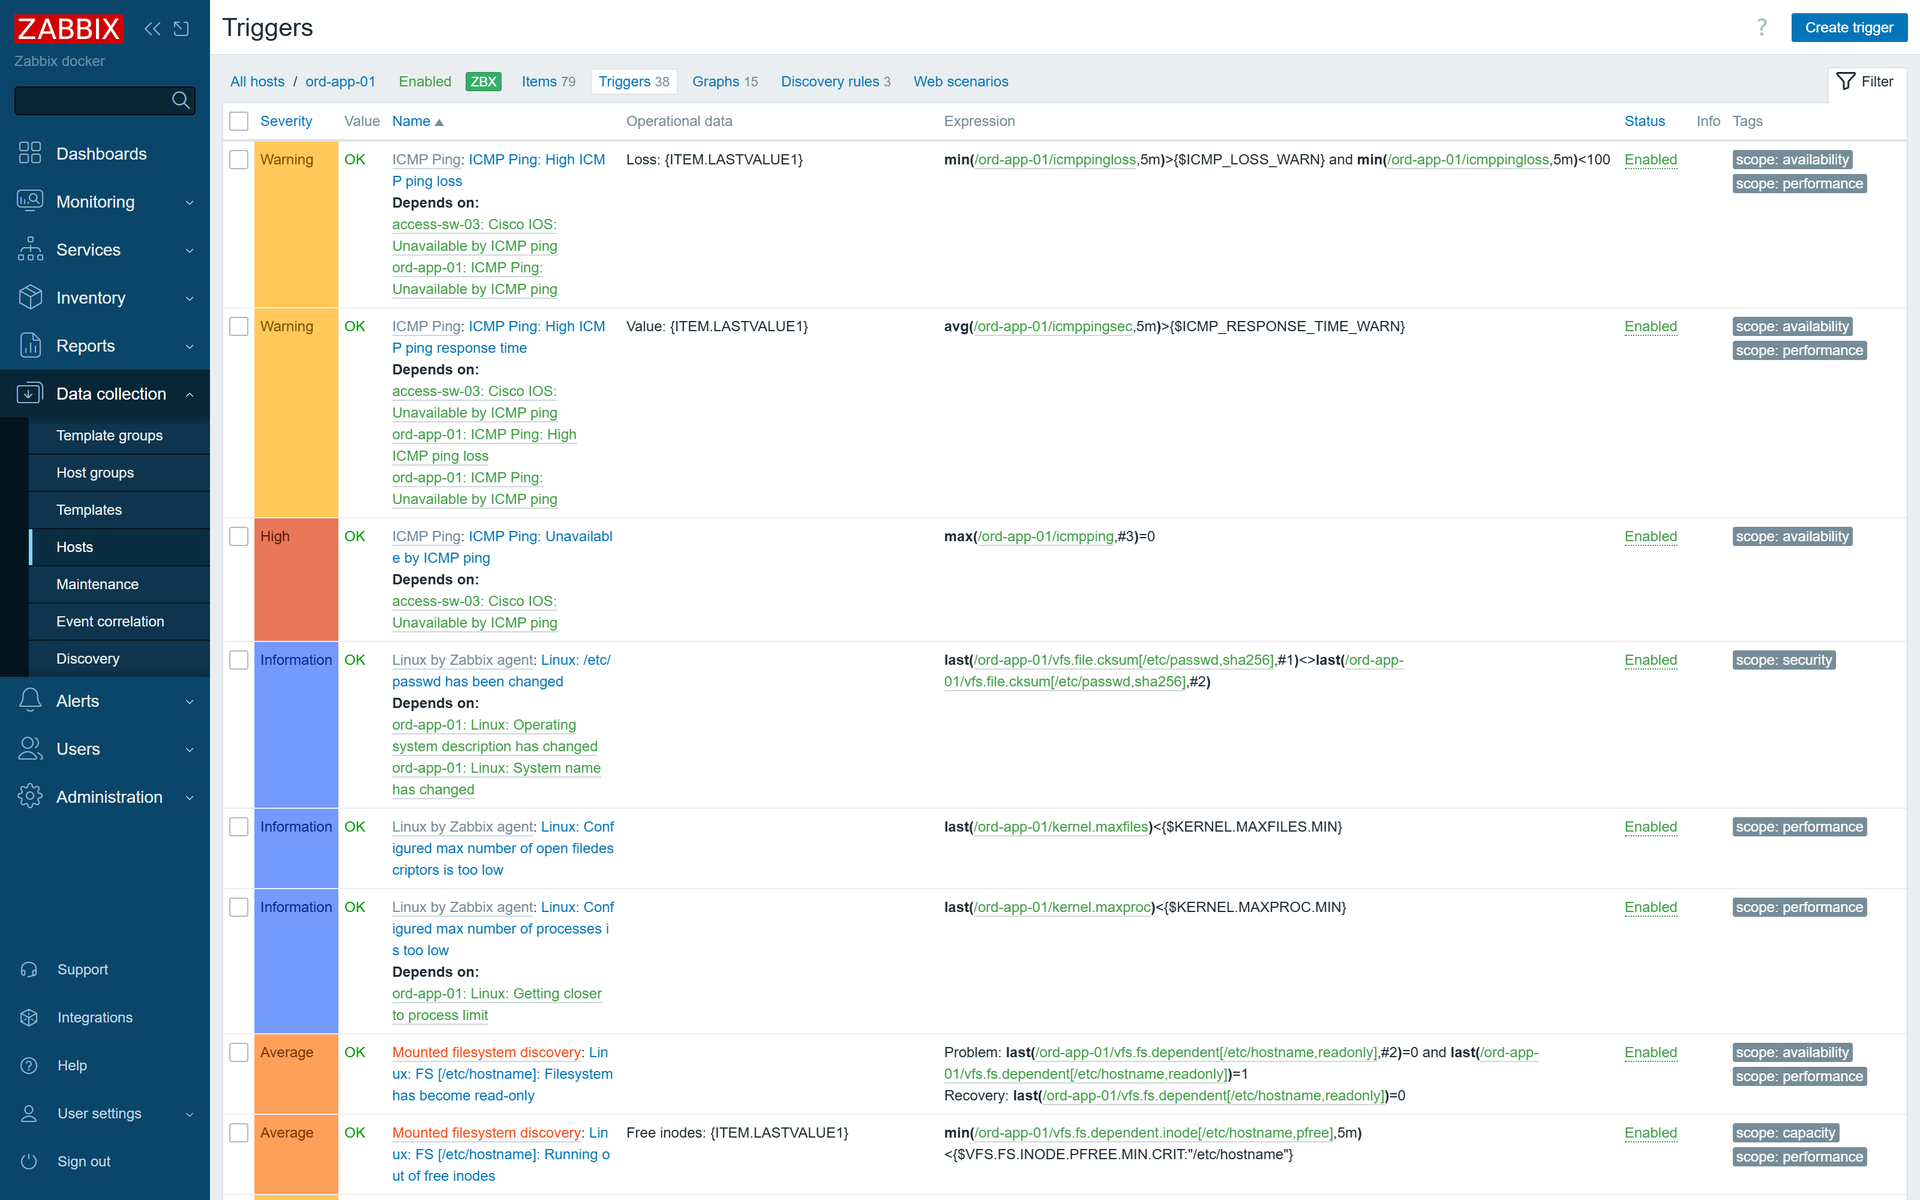
All 11 hosts are available and collected:
3. Correlation
On the Alert correlation page the engineer selects host group IDC-A with a 30-minute window and clicks Correlate. The product pulls the Problem events in the window (including ones that started earlier and are still open), first looks for alert storms and their root causes using three bases (trigger dependencies, LLDP neighbours, simultaneous bursts within a host group), then groups by (trigger, host), adds vendor, model and role from the device inventory, and has the model rate, rank, check for false positives and recommend actions.
Clicked at 19:58:44, result at 19:59:14: 29.8 seconds. 6 Problem events in 6 groups, 1 storm found, 2 downstream groups folded into the root cause, the other 4 groups all scored, no degradation. Severity: High 2, Medium 1, Low 1; no group judged a false positive.
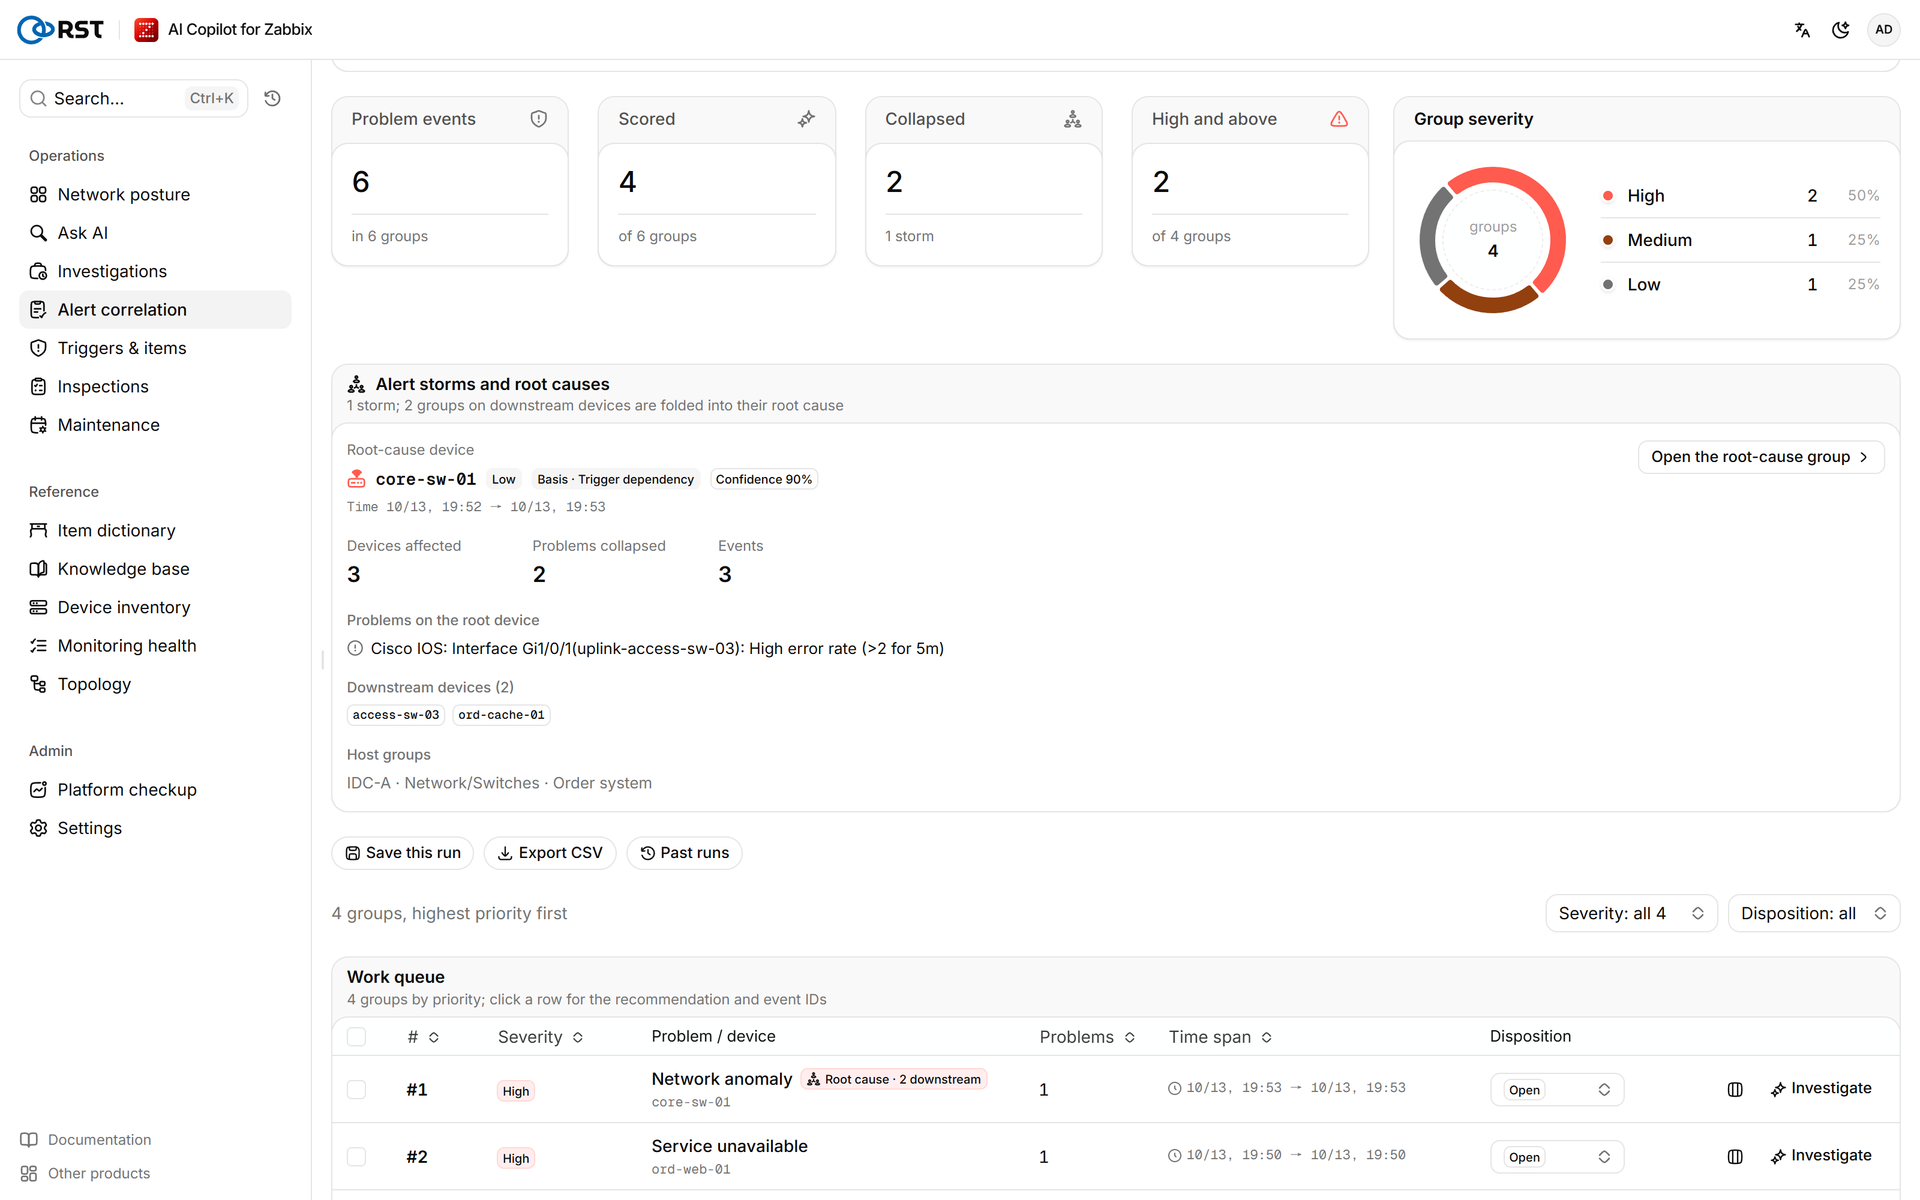
The storm card lists the root-cause device core-sw-01, basis "Trigger dependency", confidence 90%, 3 devices affected, 2 problems collapsed, 3 events, with access-sw-03 and ord-cache-01 as downstream devices:
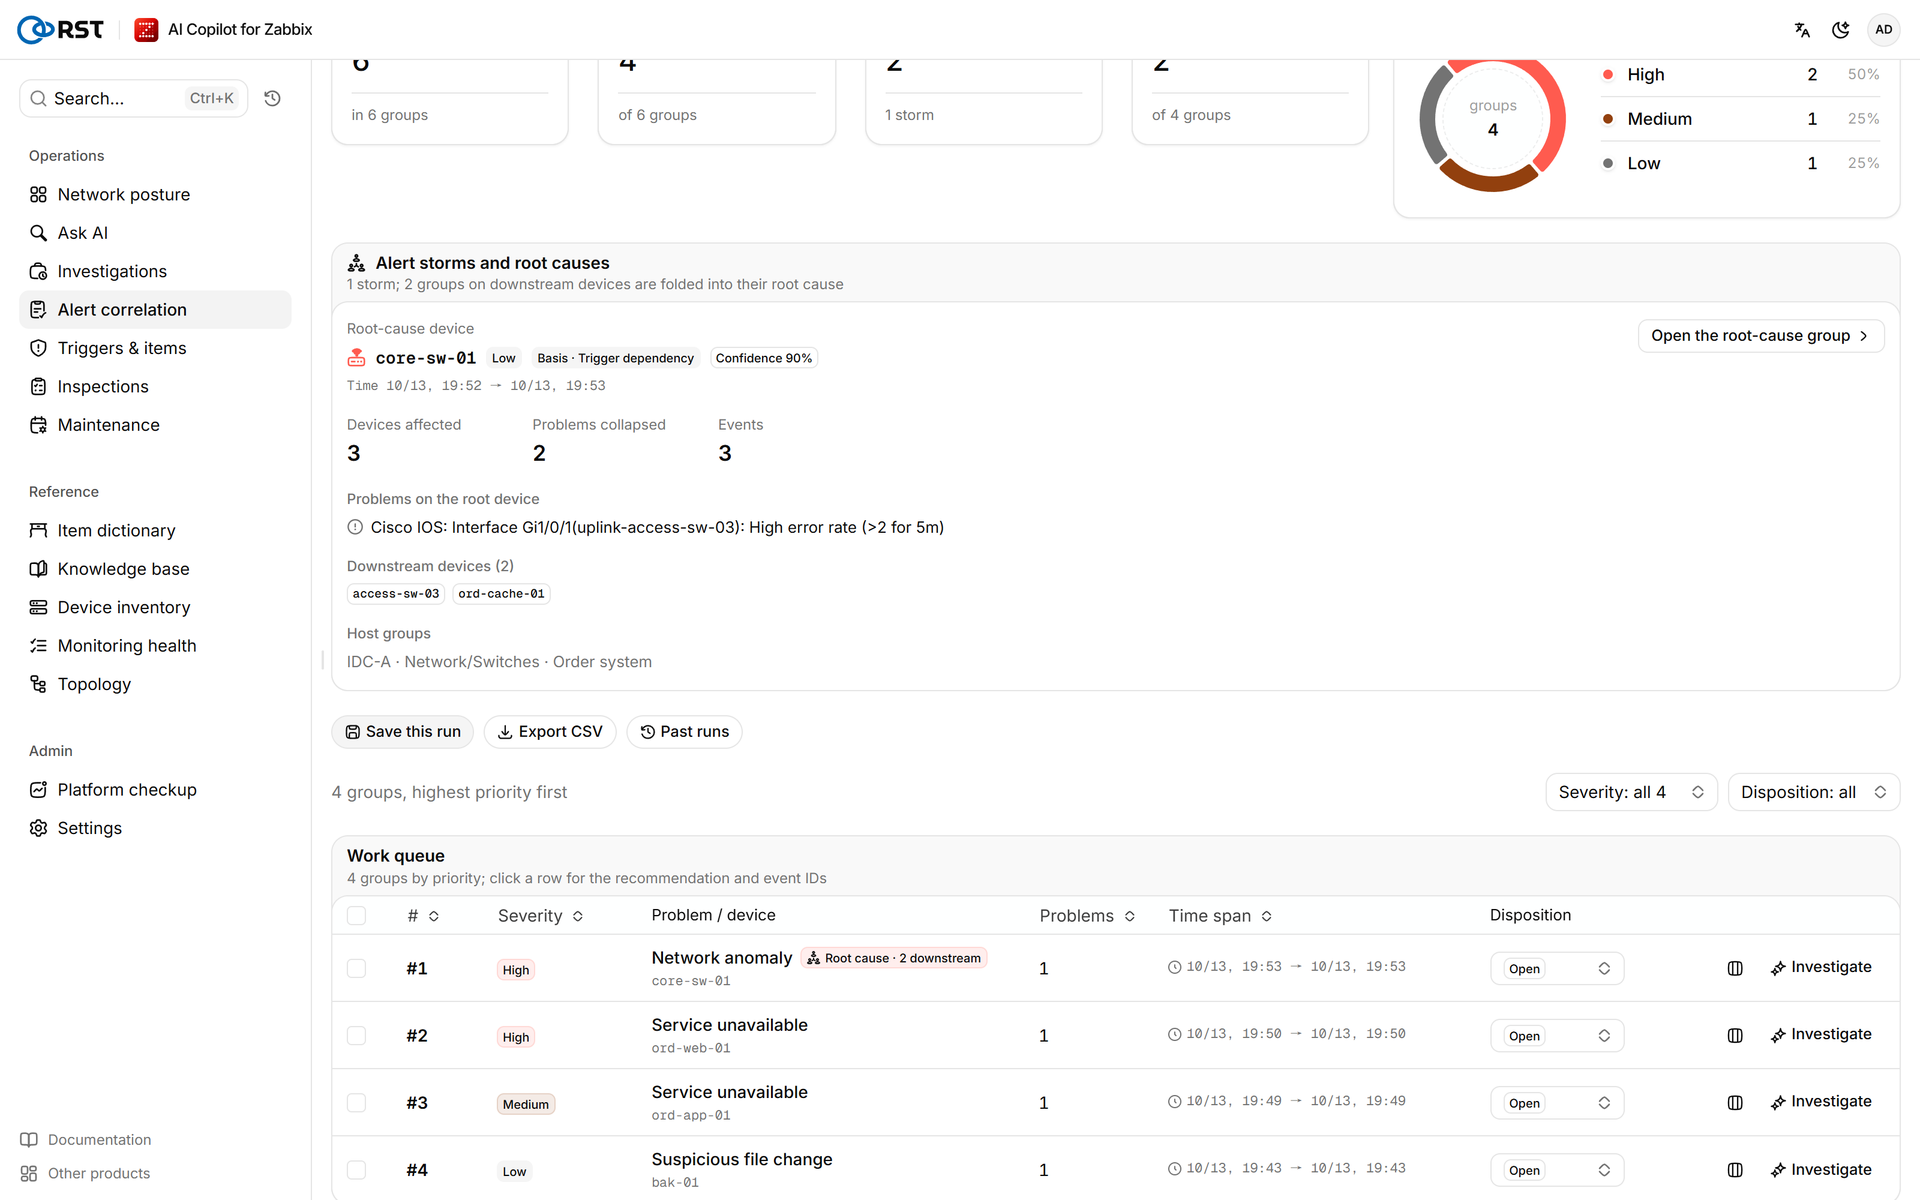
| Priority | Severity | Finding / device | Problems | Recommendation |
|---|---|---|---|---|
| #1 | High | Network anomaly · root cause · 2 downstream · core-sw-01 | 1 | Inspect the Gi1/0/1 SFP and cable toward access-sw-03, check CRC and input errors with show interface Gi1/0/1, reseat or replace the transceiver; ord-web-01 and ord-app-01 should recover once the link is stable |
| #2 | High | Service unavailable · ord-web-01 | 1 | Likely downstream of the core-sw-01 link errors; re-run the portal health probe after the uplink is restored |
| #3 | Medium | Service unavailable · ord-app-01 | 1 | Likely downstream of the core-sw-01 link errors; confirm database connectivity after the uplink is restored |
| #4 | Low | Suspicious file change · bak-01 | 1 | Review the /etc/passwd diff and the auth logs, and match it against change tickets |
The interface alert that Zabbix rates "Warning" is ranked first. The correlation result is a starting point for the engineer; a few details are worth checking before acting:
- #2 and #3 are separate groups: the portal and database-timeout alerts are application triggers with no dependency configured, and in this run ord-web-01 and ord-app-01 had no ICMP alert, so the dependency chain did not pull them into the storm. Both recommendations still name the core-sw-01 link as the likely cause. Adding dependencies to the application triggers would fold them into the storm as well.
- The badge on the storm card: the "Low" next to core-sw-01 is the highest Zabbix severity among the storm's own problems (all "Warning" here). The work queue shows the rated severity, "High".
- #4: the model reads the account change as a suspicious file change and suggests a security review. In Zabbix it is "Information"; the product raises it only one level, to "Low", behind the root cause. Whether it was a planned change is for the change tickets to say.
4. Investigation
The engineer clicks Investigate on the top-ranked root-cause group.

The investigation has two steps:
- Initial context: before the model starts, the server prepares the Problem itself (masked, and fenced as untrusted data), the vendor, model and role from the device inventory, and the query scope fixed by the gateway (host group IDC-A).
- Autonomous lookup: the model chooses among 10 network tools (errors, flaps, traffic, ICMP, reboots, device health, routing neighbours, neighbour problems, peer comparison, change signals) and one general read-only call,
zabbix_call. Every call is checked by the gateway before it runs, and the model decides the next step from what comes back. By default an investigation gets at most 6 model rounds and 180 seconds, with several calls allowed per round.
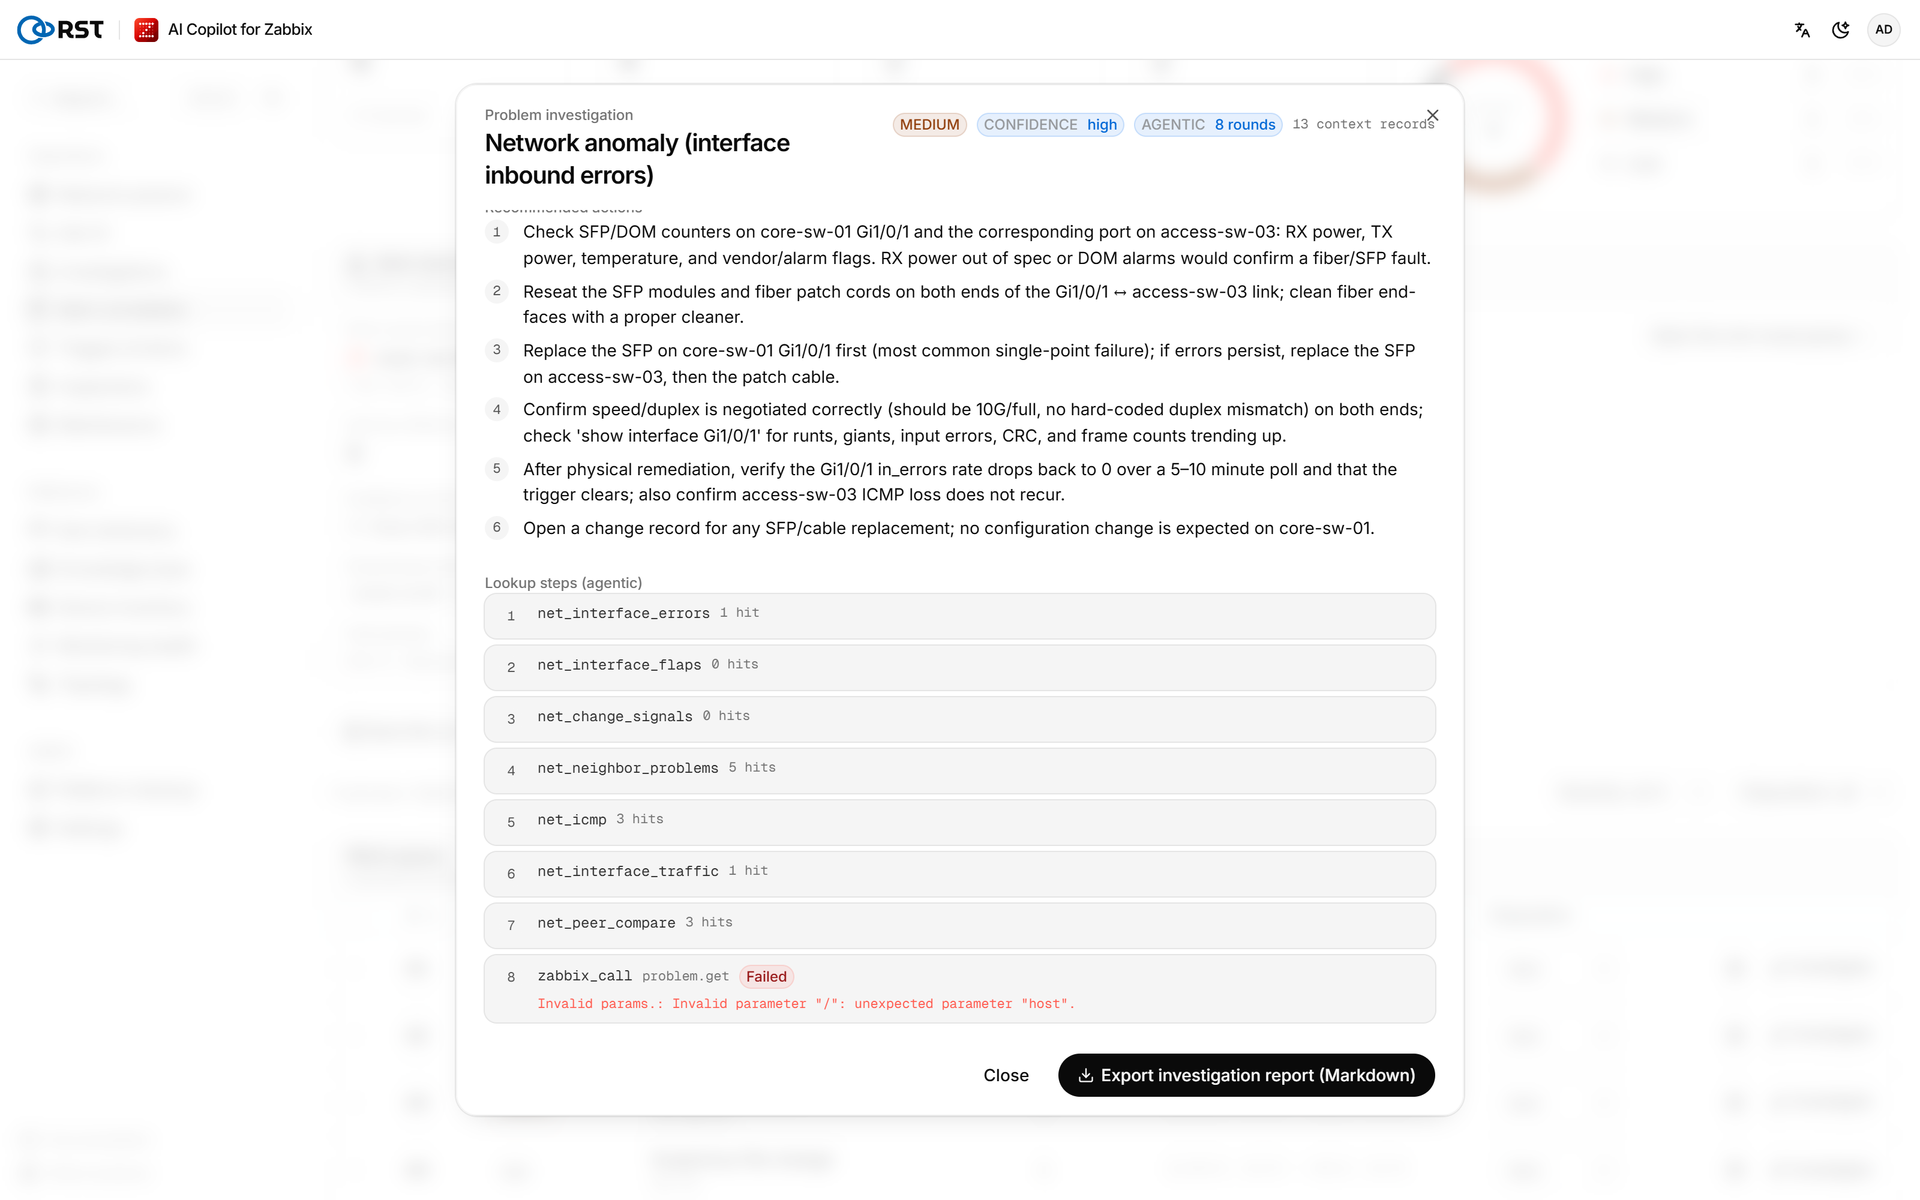
This investigation made 8 read-only calls in 25.0 seconds, with high confidence and no degradation (the report header shows "AGENTIC 8 rounds").
Link evidence: 7 input errors/s, congestion and flapping ruled out
The model starts with the failing port and the switch itself:
| # | Tool · target | Result |
|---|---|---|
| 1 | net_interface_errors · core-sw-01 Gi1/0/1 | 7 input errors/s, 0 output errors, no discards |
| 2 | net_interface_flaps · Gi1/0/1, 1 hour | No up/down transitions |
| 3 | net_change_signals · core-sw-01, 1 hour | No reboot, firmware or configuration change |
| 5 | net_icmp · core-sw-01 | 0% loss |
| 6 | net_interface_traffic · Gi1/0/1, 1 hour | About 33 kbps in, 20 kbps out on a 10G port; peak utilisation 0% |
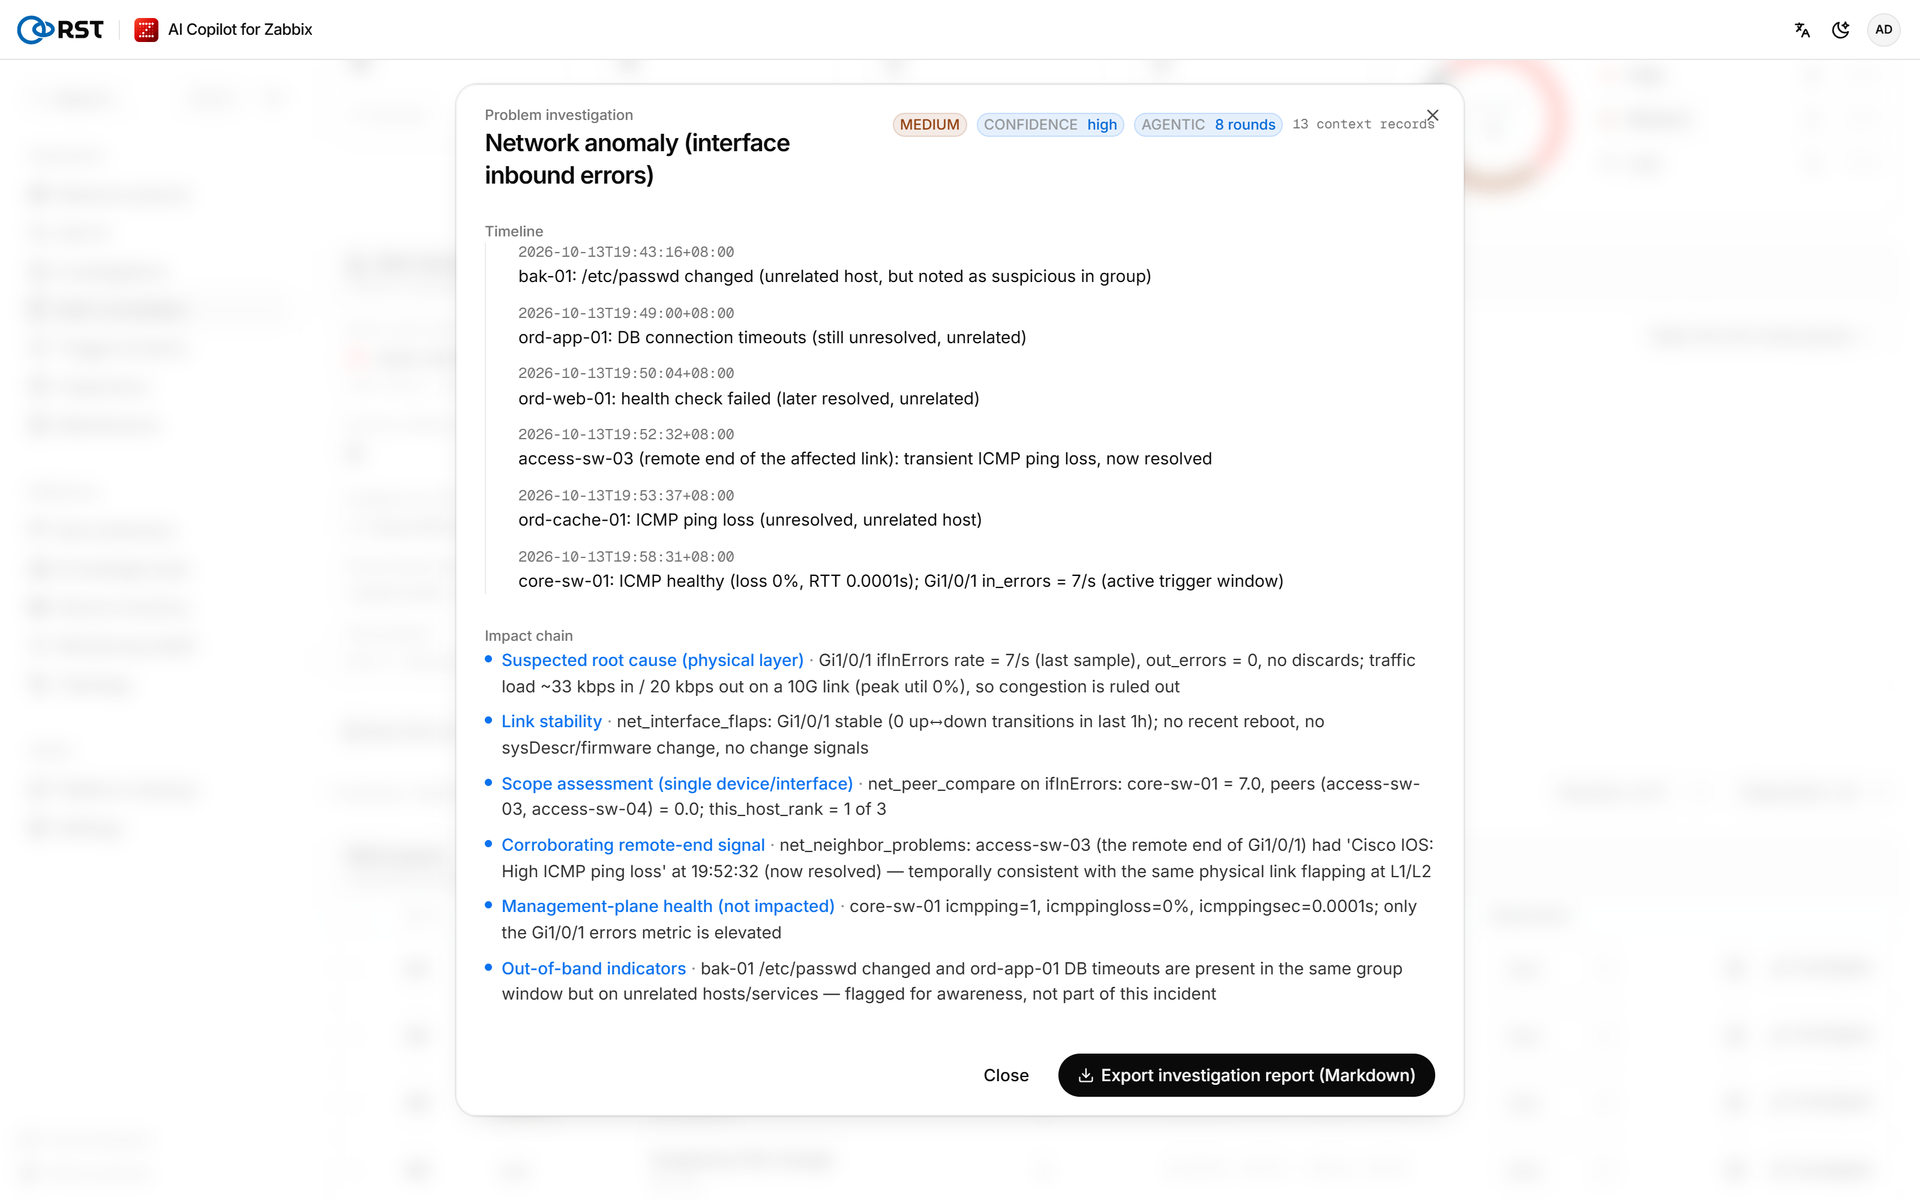
Errors appear only inbound, the link does not flap, the switch answers pings and the traffic is far below the port's capacity, which rules out congestion and recent changes.
Peer comparison: only core-sw-01 has errors, a conclusion in 25.0 seconds
The model then looks at the surroundings:
| # | Tool · target | Result |
|---|---|---|
| 4 | net_neighbor_problems · core-sw-01 | 5 problems on other hosts in the group, including ICMP loss on access-sw-03, the far end of Gi1/0/1 |
| 7 | net_peer_compare · ifInErrors on same-template devices | core-sw-01 at 7, ranked first; access-sw-03 at 0, access-sw-04 at 0 |
| 8 | zabbix_call · problem.get | Invalid parameters; Zabbix returned an error |
Call 7 is the key piece of evidence: of the three switches on the same template, only core-sw-01 has non-zero input errors. Call 8 used a parameter that problem.get does not accept; the error went back to the model as a result, did not stop the investigation and was not counted as evidence.
Conclusion (confidence high, not a false positive):
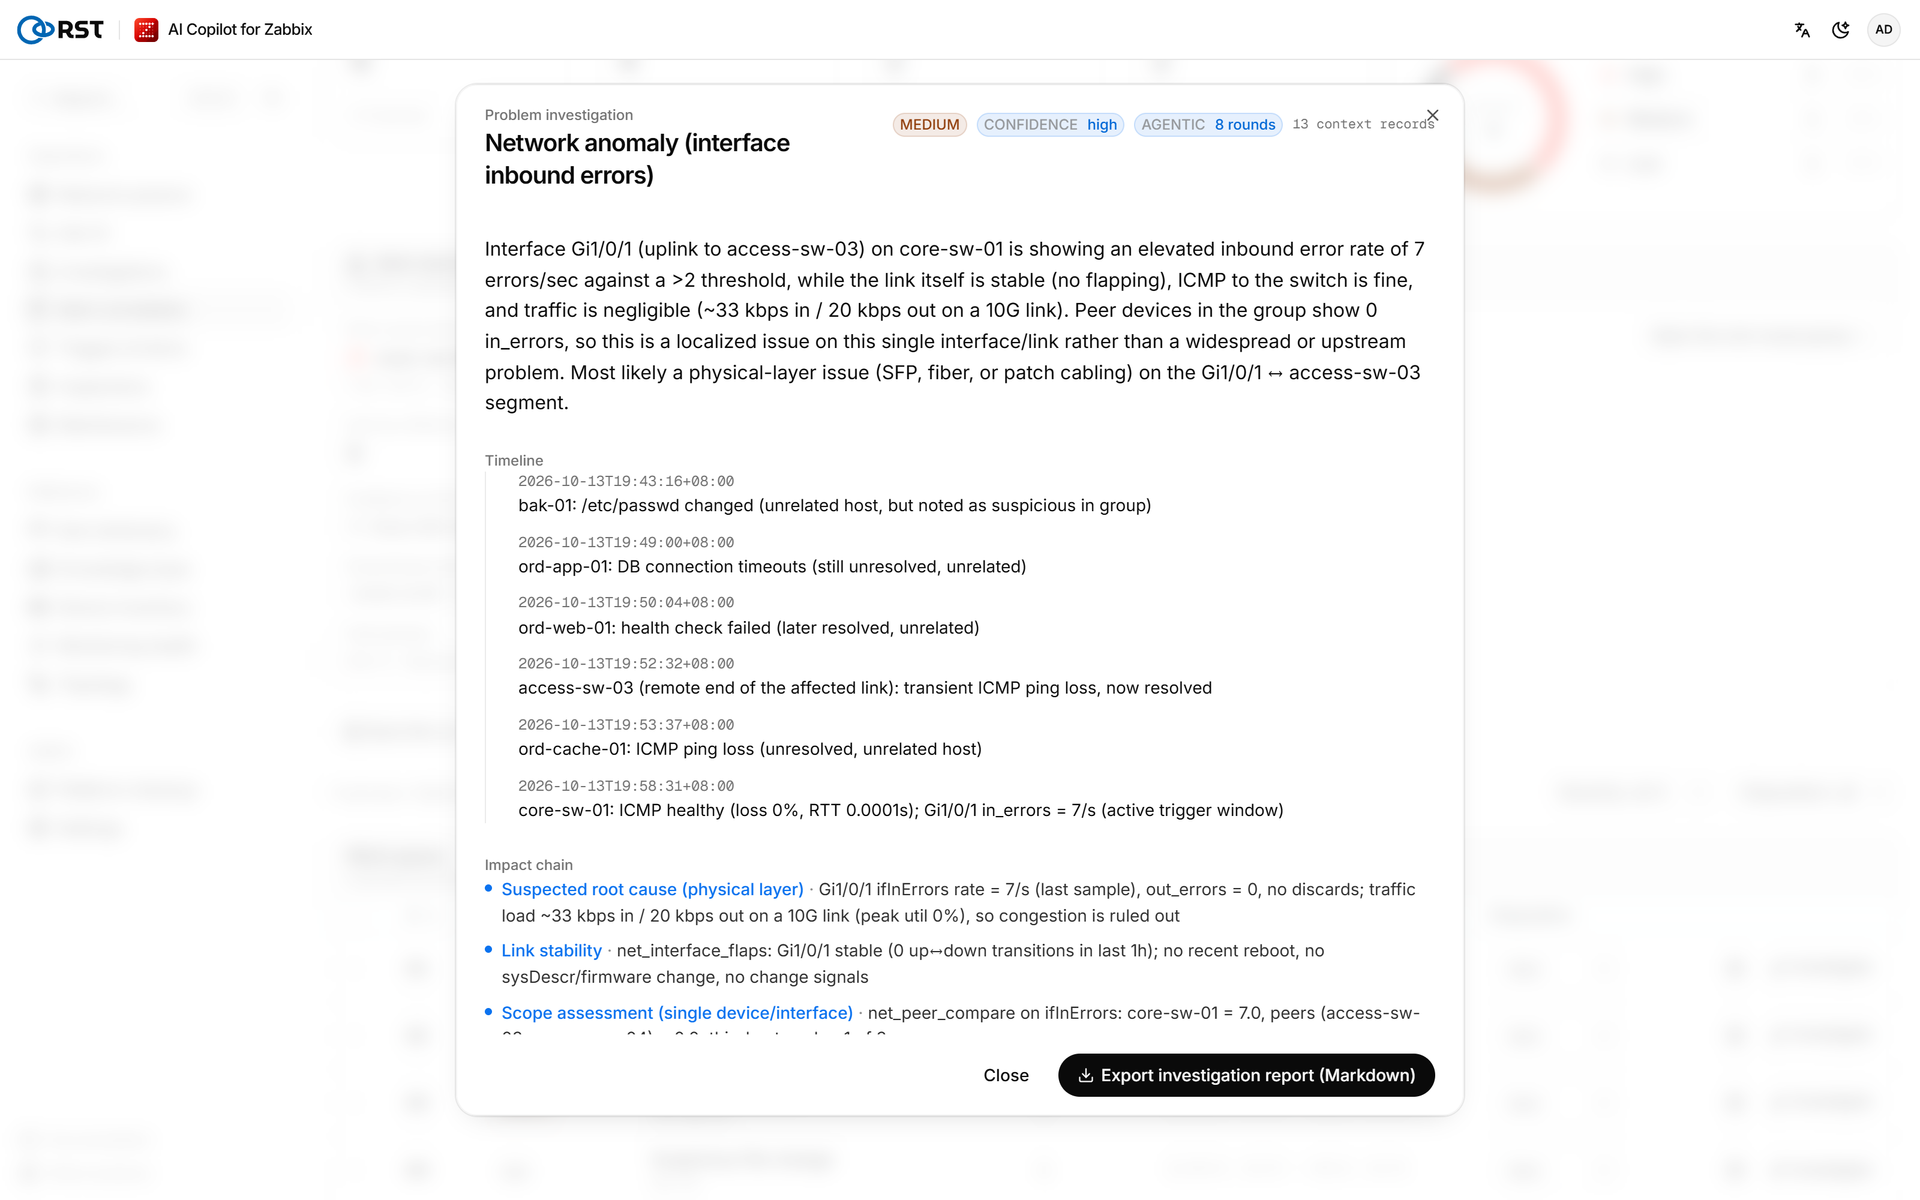
Interface Gi1/0/1 (uplink to access-sw-03) on core-sw-01 is showing an elevated inbound error rate of 7 errors/sec against a >2 threshold, while the link itself is stable (no flapping), ICMP to the switch is fine, and traffic is negligible (~33 kbps in / 20 kbps out on a 10G link). Peer devices in the group show 0 in_errors, so this is a localized issue on this single interface/link rather than a widespread or upstream problem. Most likely a physical-layer issue (SFP, fiber, or patch cabling) on the Gi1/0/1 ↔ access-sw-03 segment.
The report gives 6 recommended actions: check the SFP DOM readings (receive and transmit power, temperature, alarms) at both ends of the link; reseat the SFPs and patch cords and clean the fibre end faces; replace the core-sw-01 SFP first, then the access-sw-03 one, then the patch cable; confirm speed and duplex at both ends; after the fix, check that the input-error rate returns to 0 over 5 to 10 minutes and that the alert clears; record the replacement as a change.
Points to check
A few things are worth checking when reading the report:
- Where the downstream symptoms belong: the report's timeline marks the database timeouts, the portal failure and the ICMP loss on ord-cache-01 as "unrelated". The correlation result had already folded ord-cache-01's loss into the root cause through trigger dependencies, and its recommendations for the portal and the timeouts name the core-sw-01 link. Where the two disagree, go by the storm card and the dependency chain behind it.
- The far end: the model did not read the error counters of access-sw-03's uplink port (Gi1/0/48); the "single link" judgement rests on the peer comparison. The recommended actions already include checking the receive power at both ends.
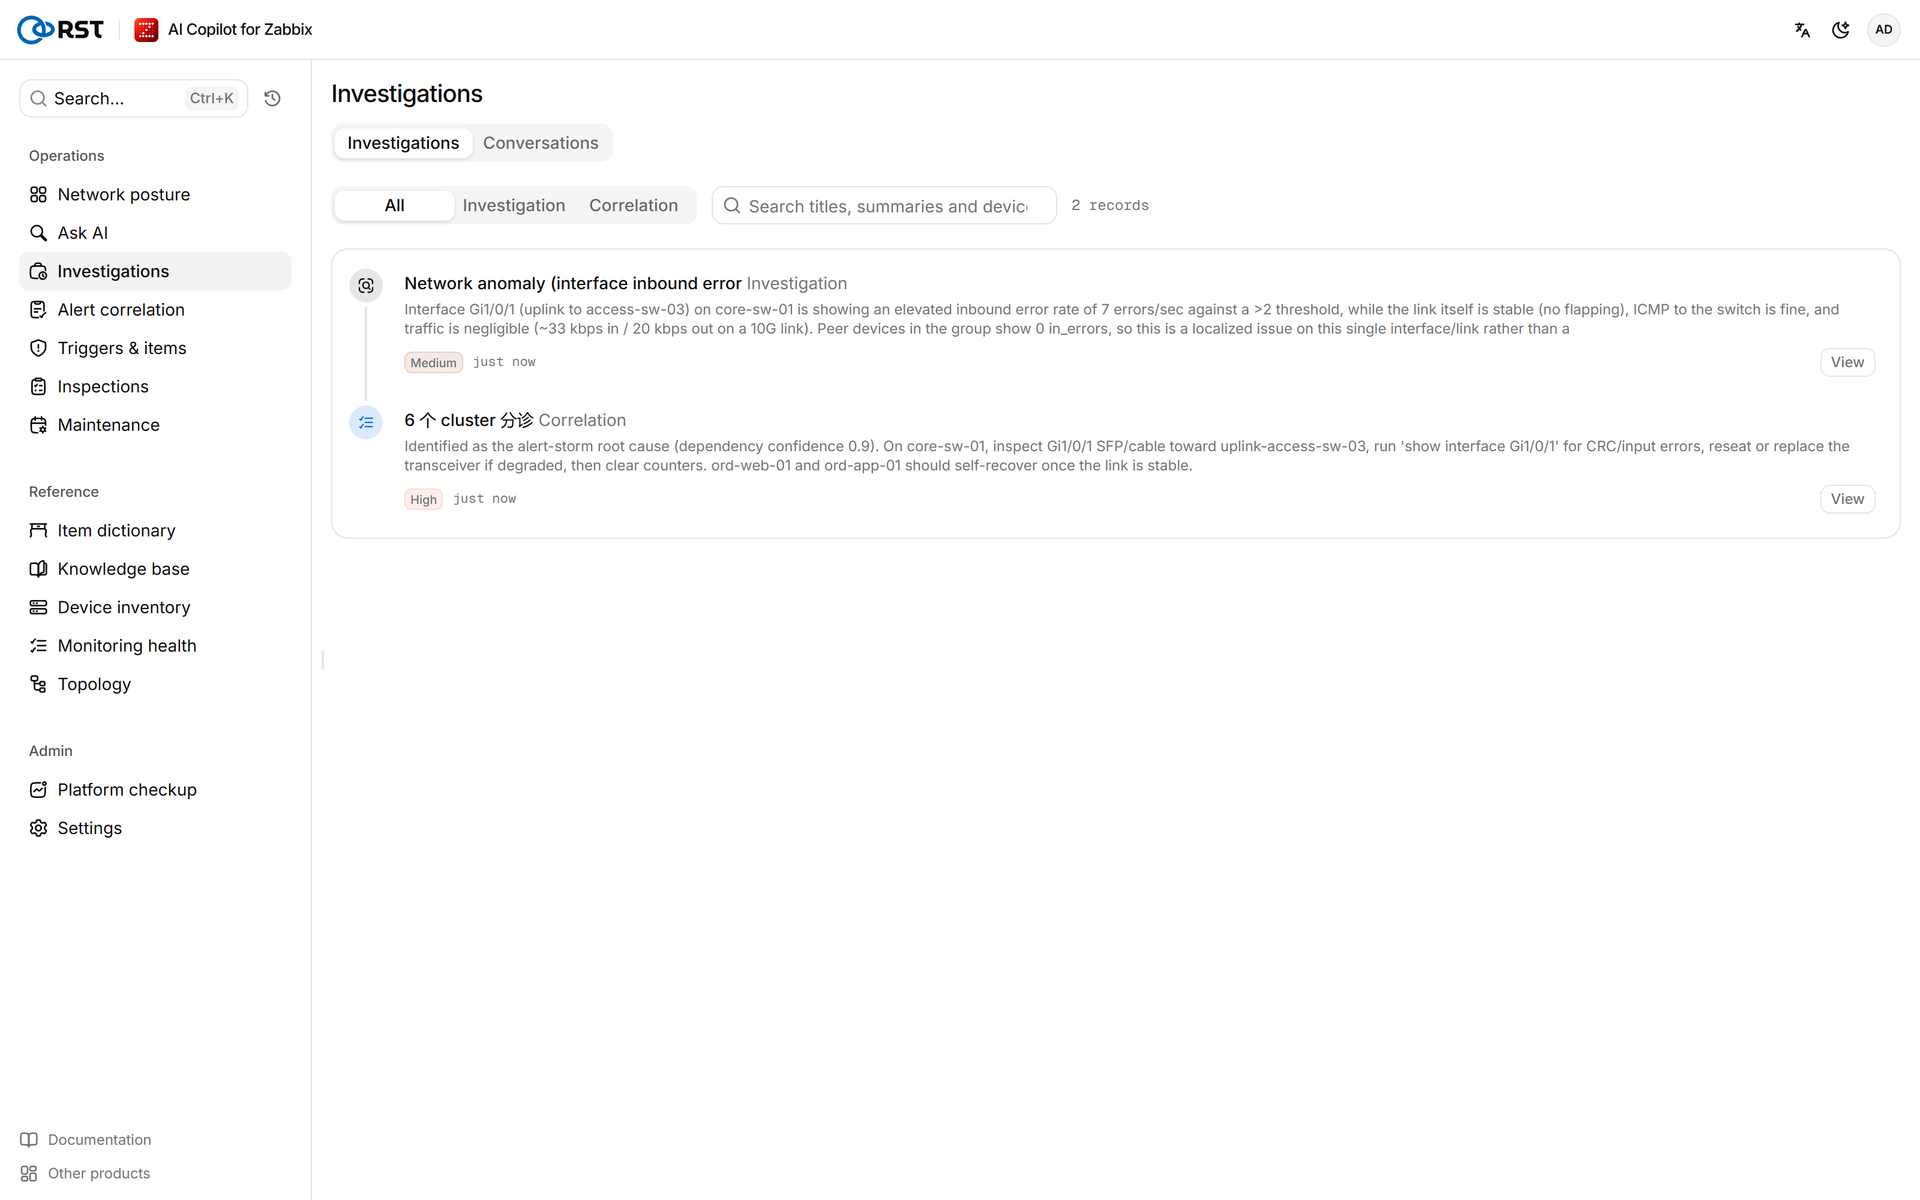
Every correlation and investigation is kept in Analysis records for later review:
5. Guardrails
Letting a model choose its own lookups means guarding against overreach, out-of-scope access and leaking internal information. This investigation ran under the following controls:
- Read-only and checked: every Zabbix call in investigations and chat goes through the gateway's check, which lets only
*.getthrough and rejectscreate,updateanddelete. The product's only writes are acknowledging or closing problems and maintenance windows, which are role-gated and need a person to confirm; correlation and investigation never trigger them. All 8 calls in this run were read-only; oneproblem.gethad invalid parameters, was rejected by Zabbix and came back to the model as an error. - Host-group scope: the gateway injects the selected host group (IDC-A in this run) as the query scope, and the model cannot change it.
- Row limit and masking: each call returns at most 20 rows. Before anything is sent to the model it is masked according to the masking mode: in cloud-model mode, IP addresses are cut to /24, email addresses are obscured, and passwords, tokens and cookies are replaced with placeholders. This run used cloud mode. Problem names, tags and host descriptions are wrapped in random boundary markers in the prompt and treated as untrusted data.
- Budget: each investigation gets at most 6 model rounds and 180 seconds, with an optional token budget; past the limit it returns a degraded result that is clearly marked. This run finished in 25.0 seconds without degradation.
- Severity limits: the model can raise a Zabbix trigger's severity by at most one level; only the storm's root-cause group is exempt. The work queue sorts root causes first, then by final severity. In this run, bak-01's "Information" alert went up only to "Low".
- Evidence kept: the report lists the calls made and the basis for each finding, and correlations and investigations are stored in Analysis records, so an engineer can check them one by one.
6. Value and conclusion
Most of an operations team's effort goes into the time after the alerts: reading a screen of Problems, working out which share a cause, and checking host by host. That work is slow, varies from person to person and leans on senior engineers.
Faster: correlation, ranking and recommendations for 6 Problems take 29.8 seconds; going from the interface alert to a physical-layer fault on one port takes 25.0 seconds.
Reproducible and auditable: correlation is based on the trigger dependencies already configured in Zabbix, so it gives the same answer each time; every call, result and basis of an investigation is kept in Analysis records.
A lower bar for experience: "the portal alert is the loudest, but look at the core switch's errors first" used to be a senior engineer's call. With trigger dependencies in place, a first-line engineer who clicks Correlate and Investigate gets the same ranking and the same lookups.
| Step | By hand | RST AI Copilot for Zabbix |
|---|---|---|
| Prioritising | Read by Zabbix severity; the portal alert comes first and the root cause sits among the Warnings | 29.8 seconds to find the storm, root cause ranked first, downstream ICMP loss folded in |
| Separating noise | Unrelated alerts share the screen and are judged one by one | The account change gets its own group, raised only one level, behind the root cause |
| Finding the cause | Graphs host by host, logging in to switches to compare counters | 8 read-only calls in 25.0 seconds; congestion, flapping and changes ruled out; peer comparison narrows it to one device |
| Recommending action | Personal experience | 6 steps tied to specific devices and ports |
| Data safety | No specific controls | Read-only calls, host-group scope, row limit, outbound masking |
In this run, Zabbix collected and alerted on every host and service. RST AI Copilot for Zabbix identified a "Warning"-level interface alert that arrived 4 minutes after the first symptom as the storm's root cause in 29.8 seconds, ranked it first and folded the downstream ICMP loss into it, then narrowed it in 25.0 seconds to the physical layer of core-sw-01 Gi1/0/1.
Every finding comes with the calls that were made and what they returned, so engineers can check the evidence before they act. The product does not remediate anything on its own; replacing an SFP or moving traffic to another uplink stays a human decision. Zabbix raises the alerts, RST AI Copilot for Zabbix does the analysis, and people make the call.